
As GDP differential widens, S&P earnings growth should decelerate from 20-25% in 2018 to 7% in 2019 while EM earnings growth accelerates from 3% to 8%. Hence, there is a leadership transition both in momentum in economic growth and in earnings growth. EM moves from last to first in our regional matrix in terms of EPS growth while the US moves from first to last.
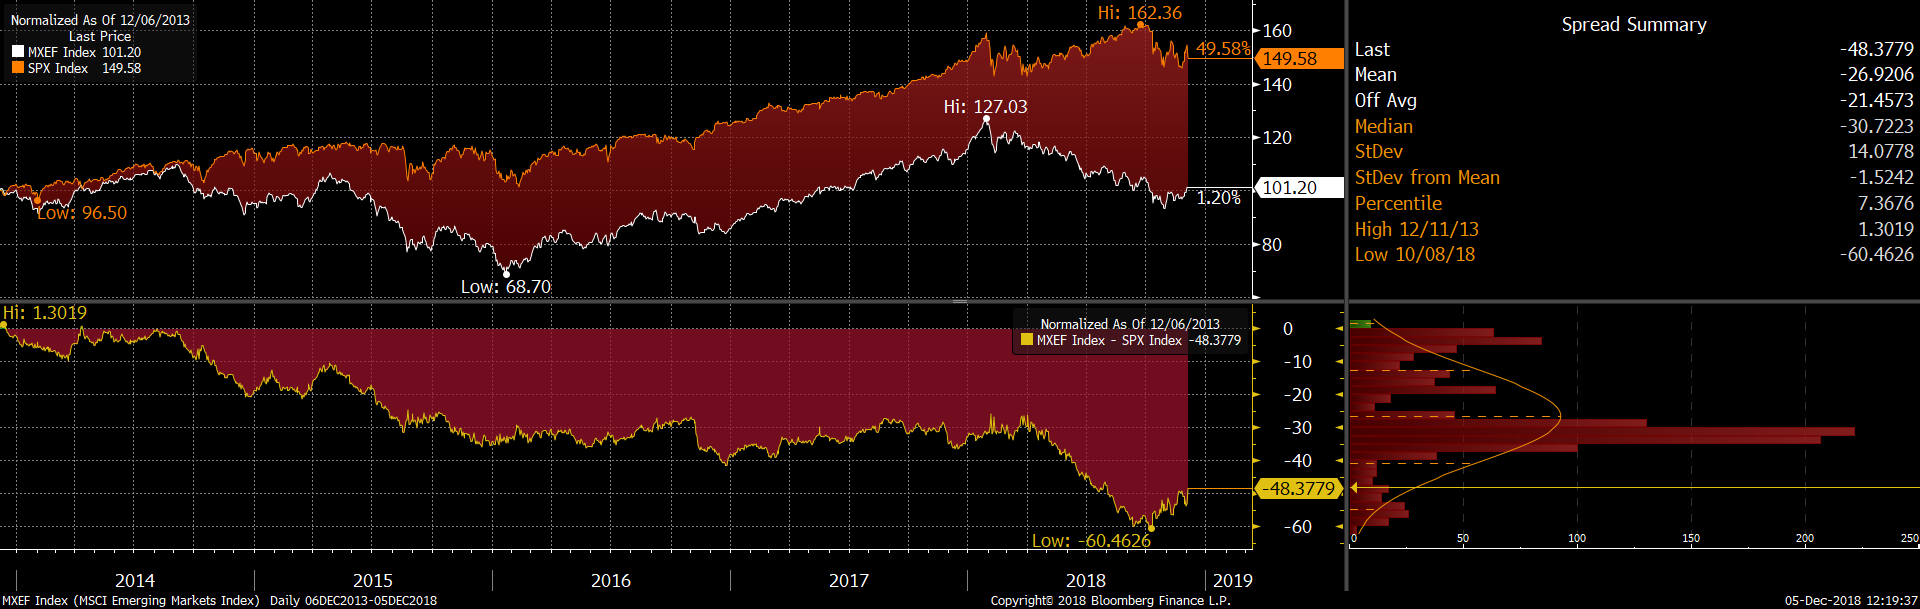
How much is priced ? MSCI EM has already outperformed DM by 830 bps since the trough and outperformed S&P by 10% reversing around one third of the underperformance from March to September 2018 (see chart above). If our matrix is right, we could expect another 10% in the coming weeks.
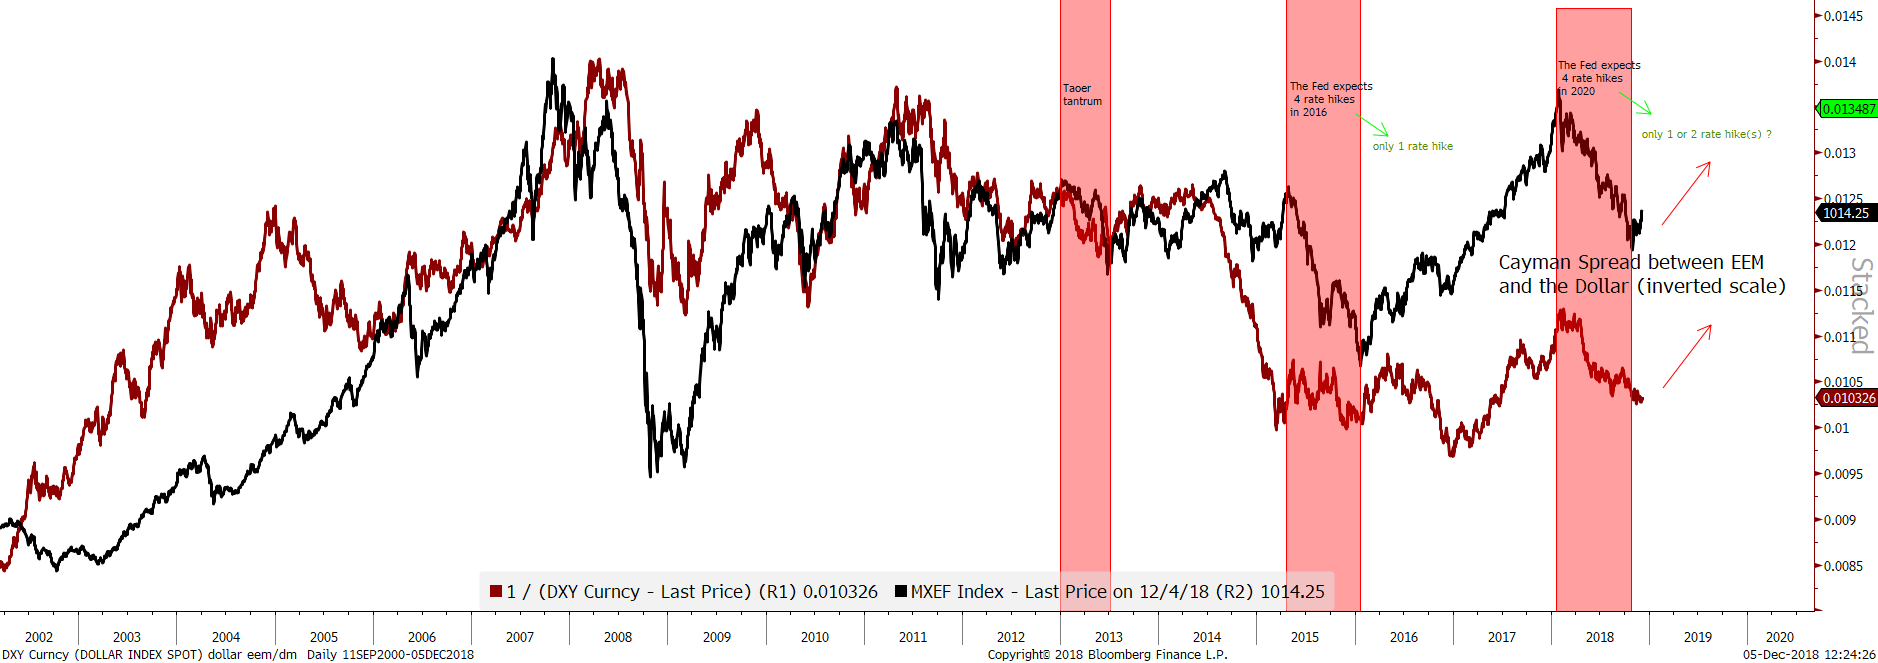
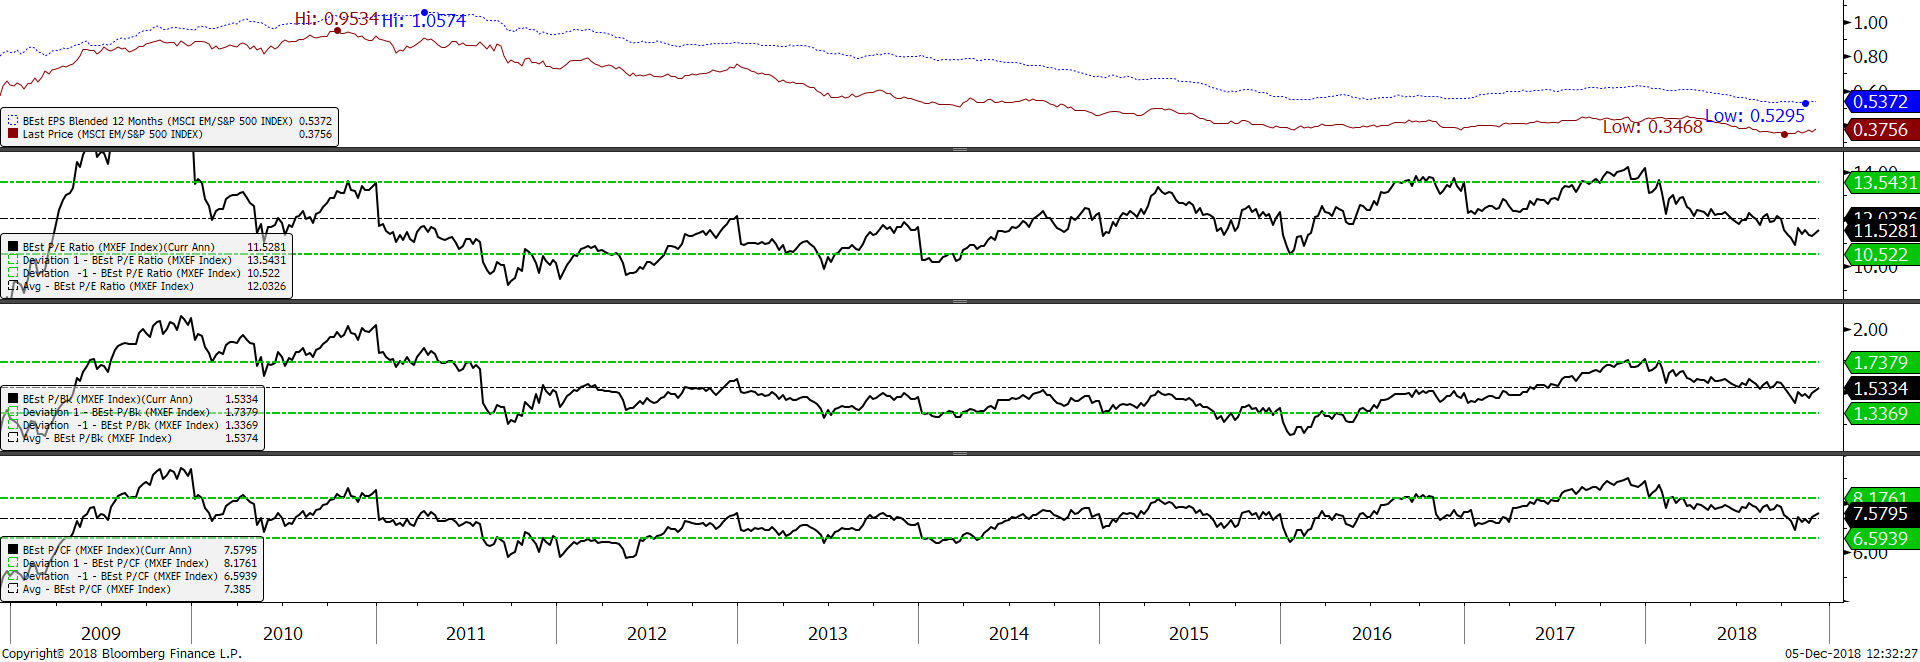
Two catalysts support our matrix: (1) a dollar reversal thanks to a more dovish fed and (2) a cheap valuation in absolute and relative
The P/E at the low of the sell-off was 10.84x, having peaked at around 14.2x by the end of 2017. The de-rating in multiple was even worse than in 2015-2016. Only in 2011 with the Greek crisis did it fall lower ( 9.4x at the trough). The chart below shows the evolutions of P/E since 2009:
In fact the continuation of the out-performance relies on China and the truce in trade wars. Please find all details on the trade wars here. But something already strikes us: the initiation of a major reform of Intellectual property protection which is one of the US’s key asks.
Then, economically, the first derivative is rebounding as can be observed in the citigroup economic surprise of China (see below):
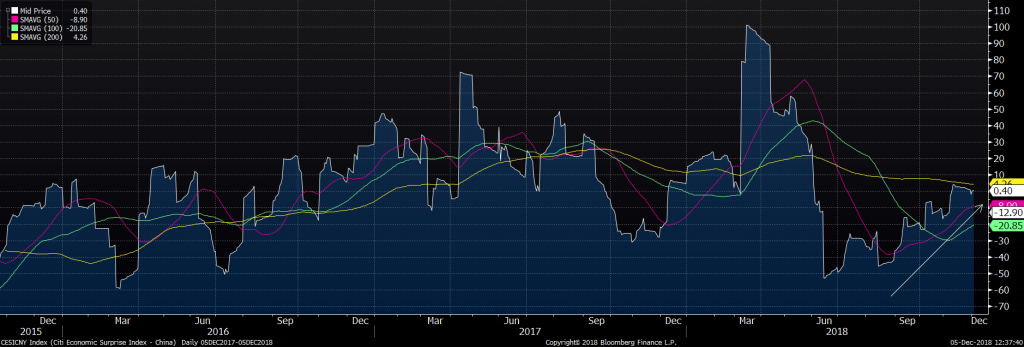
The bearish Earnings momentum has made a small inflexion. to be monitored…
