China Manufacturing PMIs for February beat across the board:
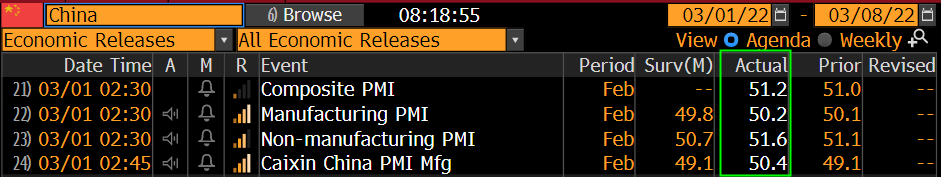
Big jump in China Manufacturing New Orders in February, up to 50.7 from 49.3 in January.
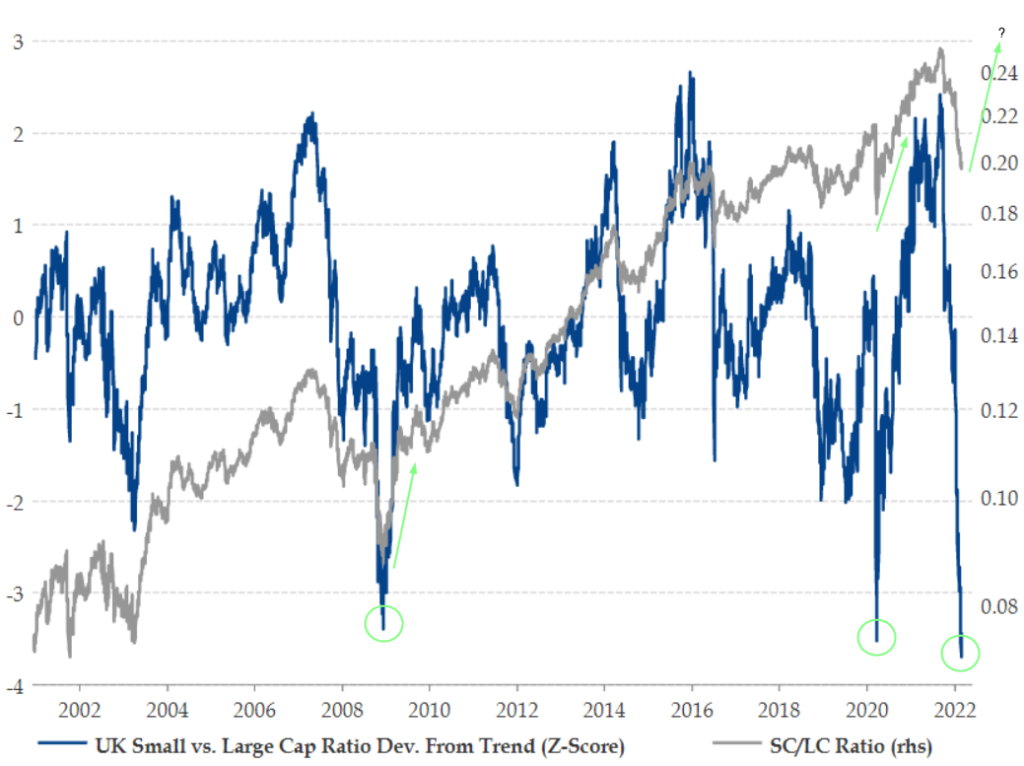
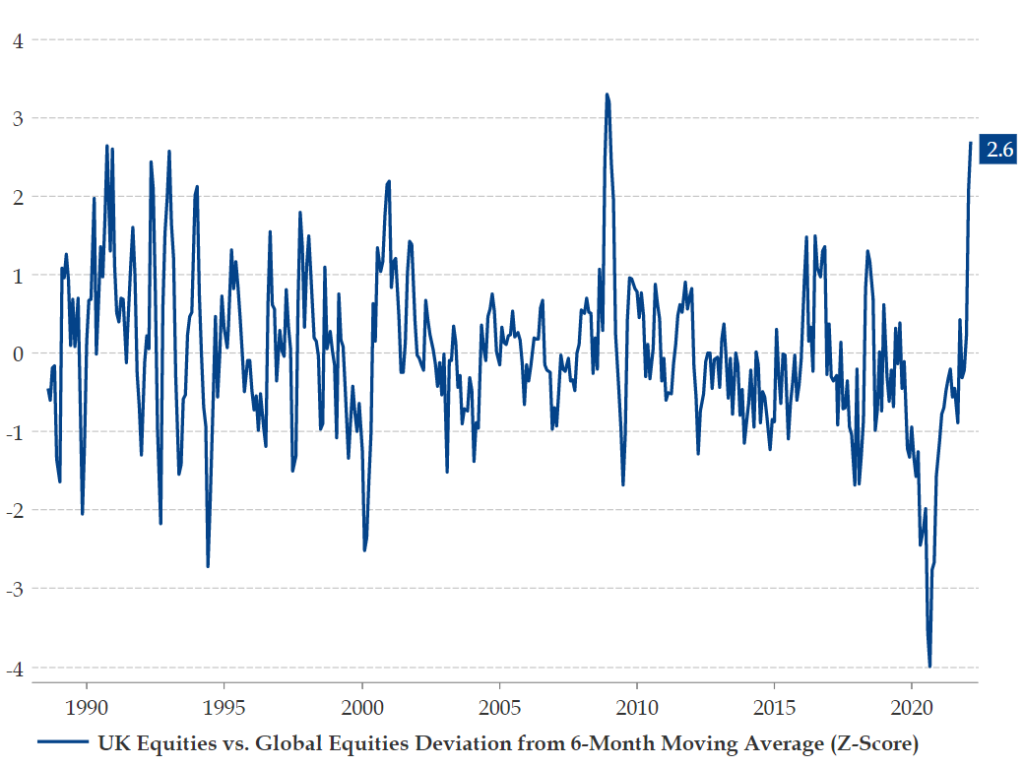
UK small cap equities have rarely underperformed large cap equities like they have today… Now nearly -4 standard deviations from trend.
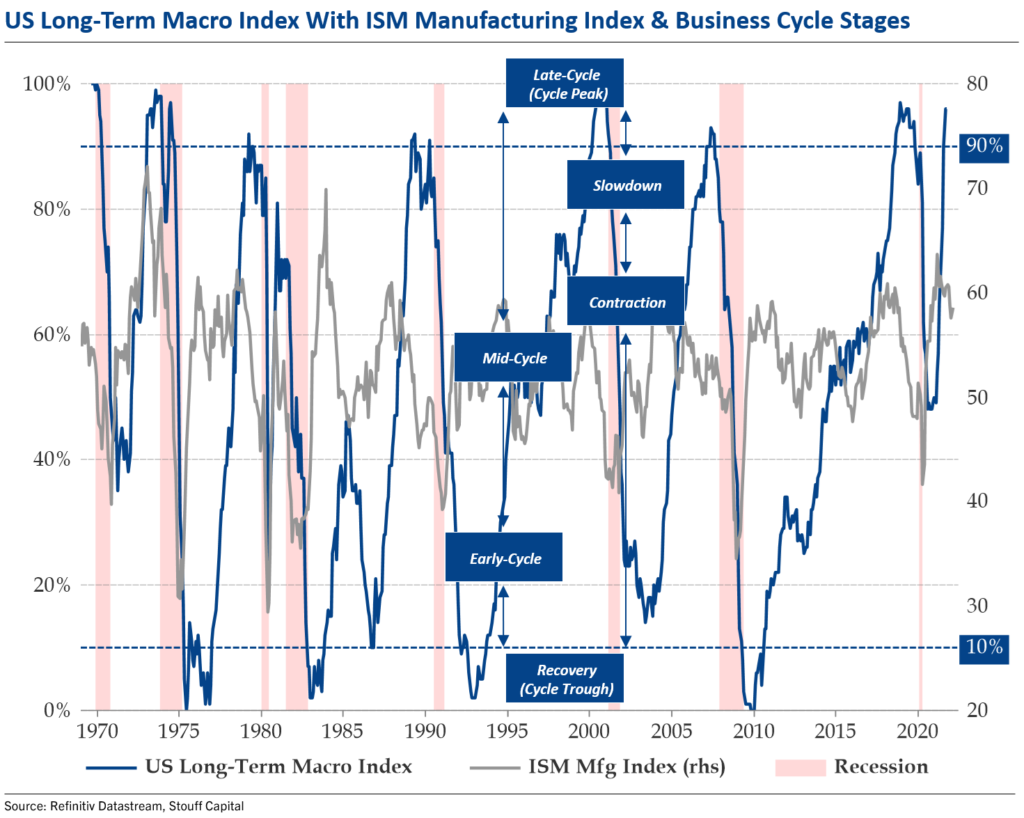
US Long-Term Macro Index (Macro Compass) declined to the 93rd percentile in January, down from the 95th percentile in December.
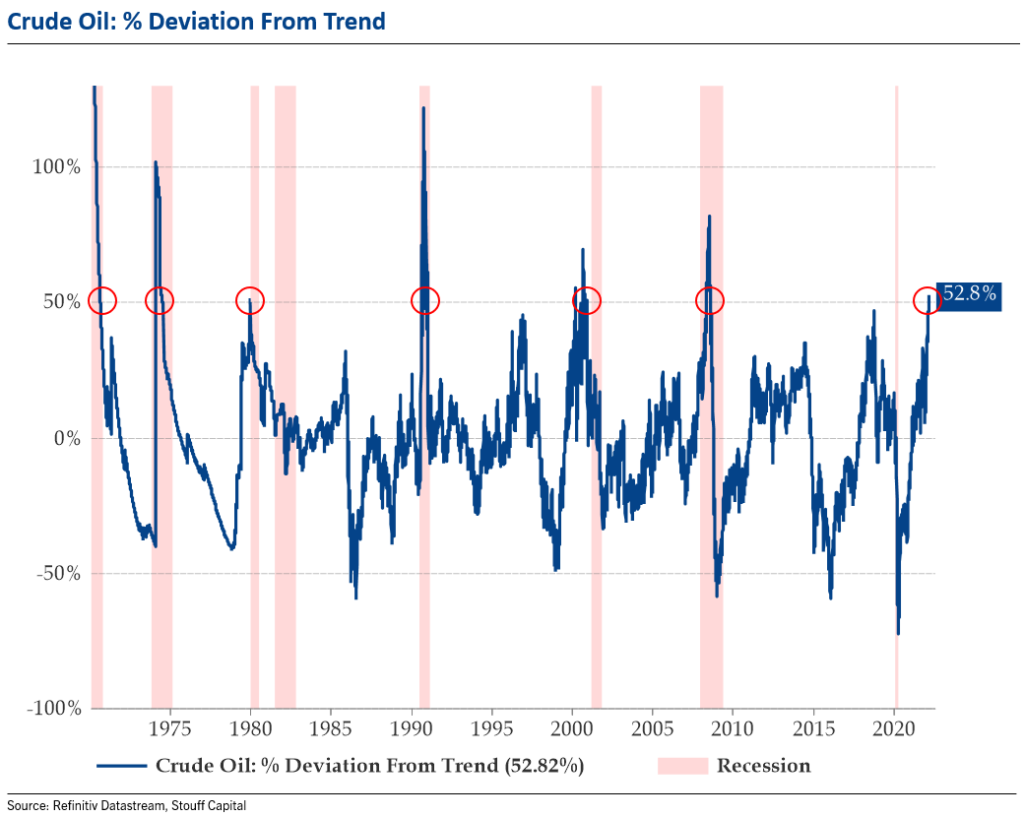
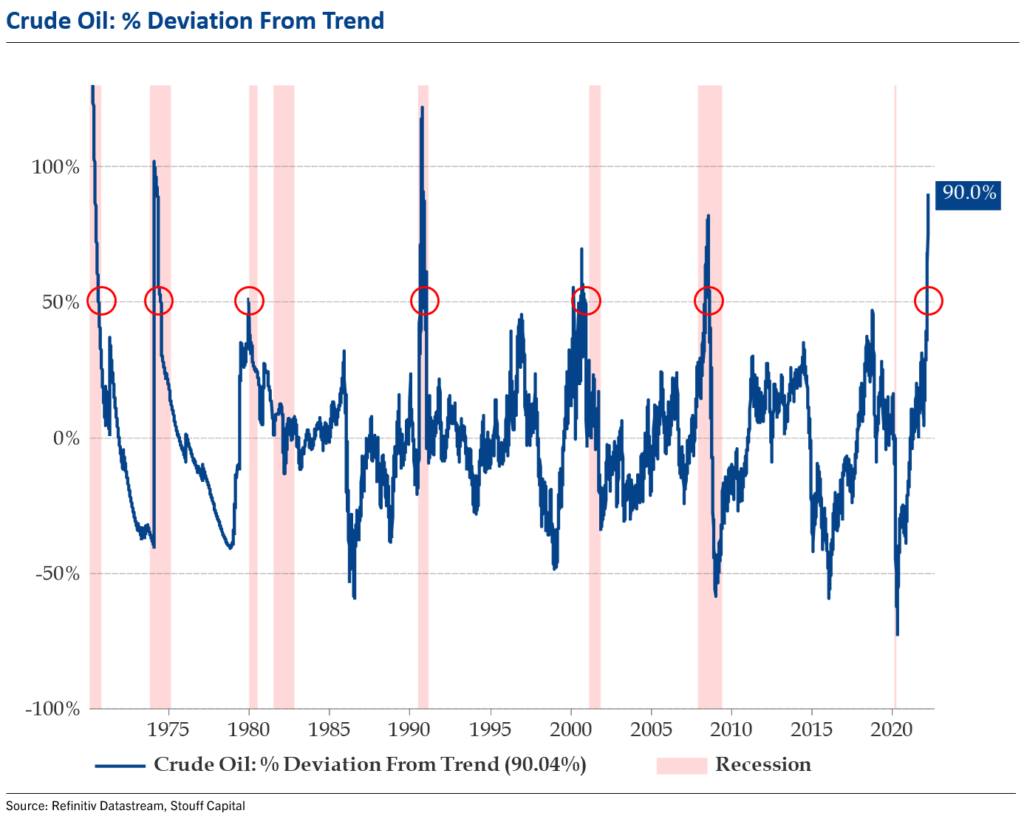
Crude oil is now nearly 53% above trend, levels historically consistent with triggering a US recession. 100% track record since 1970.
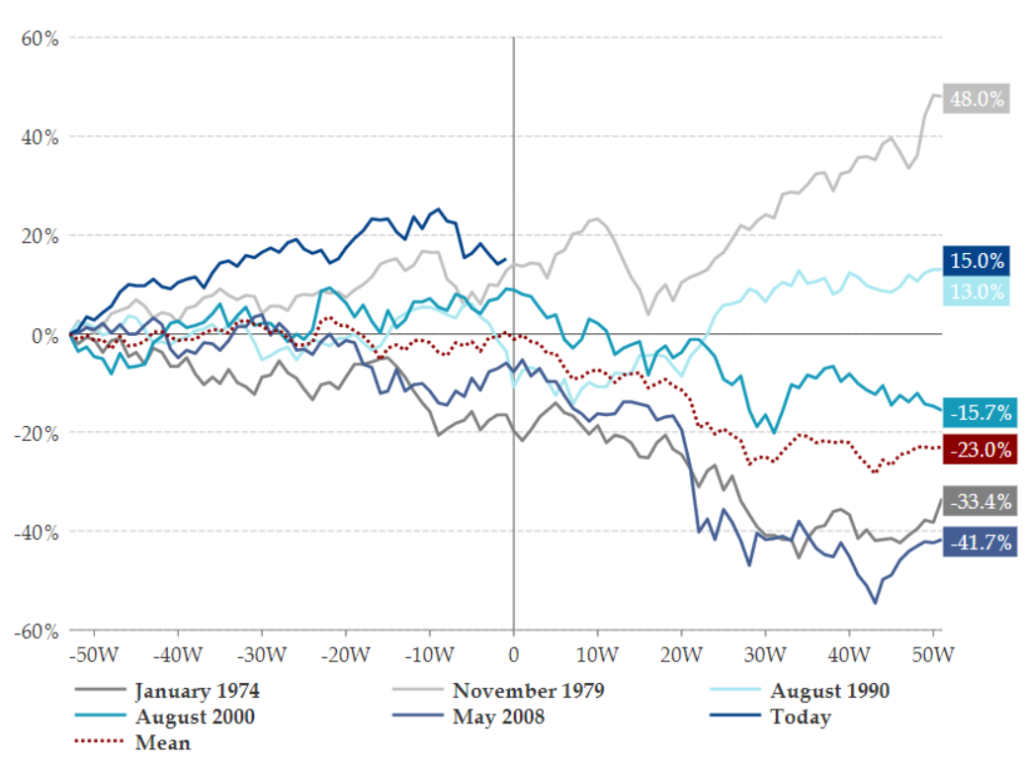
Here’s a look at the last 6 times oil prices hit 50% above trend: S&P 500 -12 Months/ +12 Months.
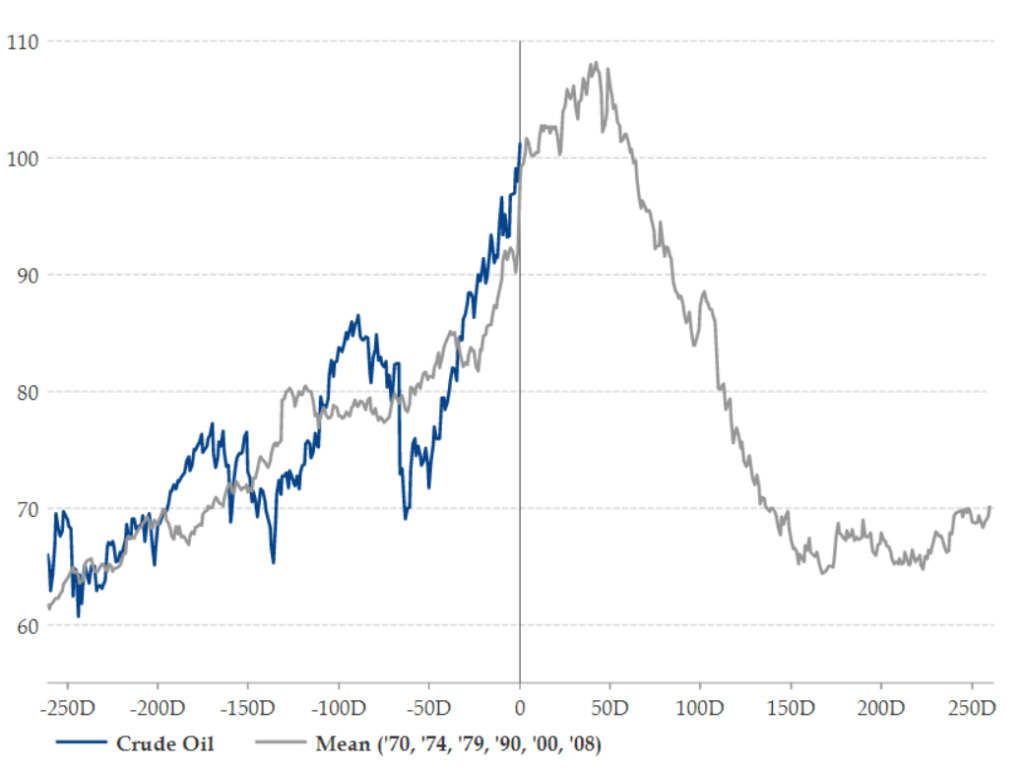
Here is a also look at crude oil today versus the mean trajectory following a cross 50% above trend: -12 Months/ +12 Months.
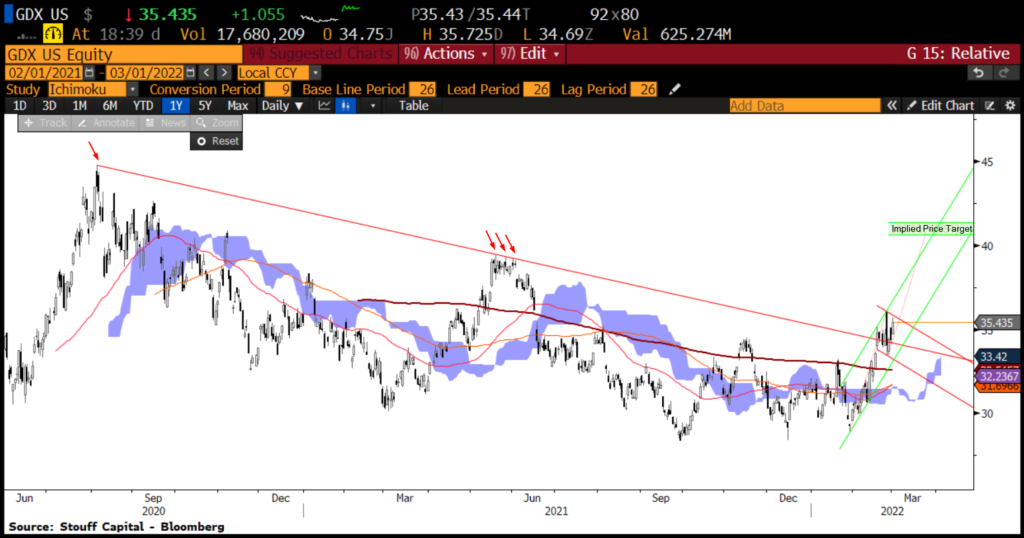
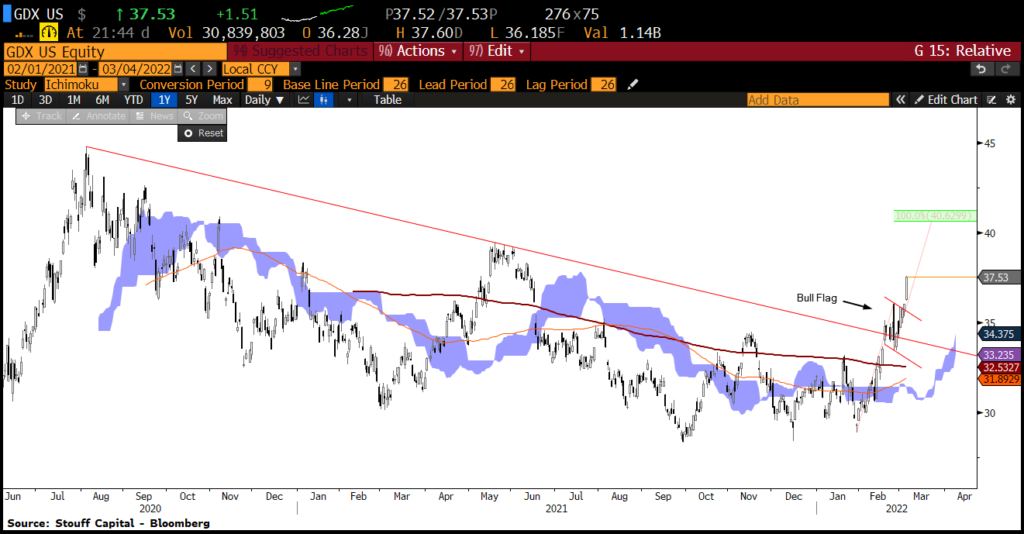
GDX looks like it’s getting ready to move higher after consolidating around key breakout levels. This looks like a small bull flag to me. Should we breakout to the upside, the implied price target is ~41. Kairos has entered a small position.
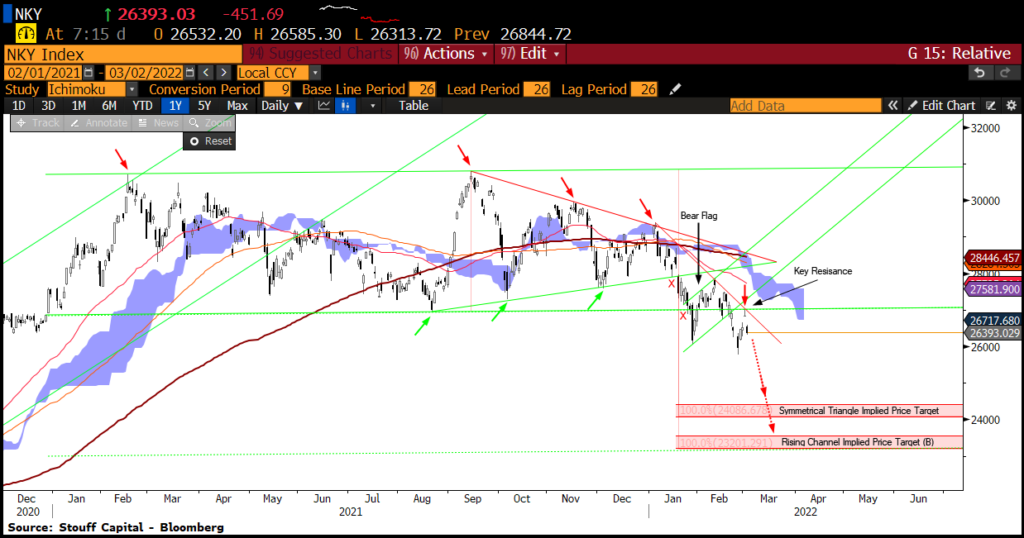
Japan failed to recapture key support levels yesterday above 27000. This could open up a window for a move down to ~24000. On watch.
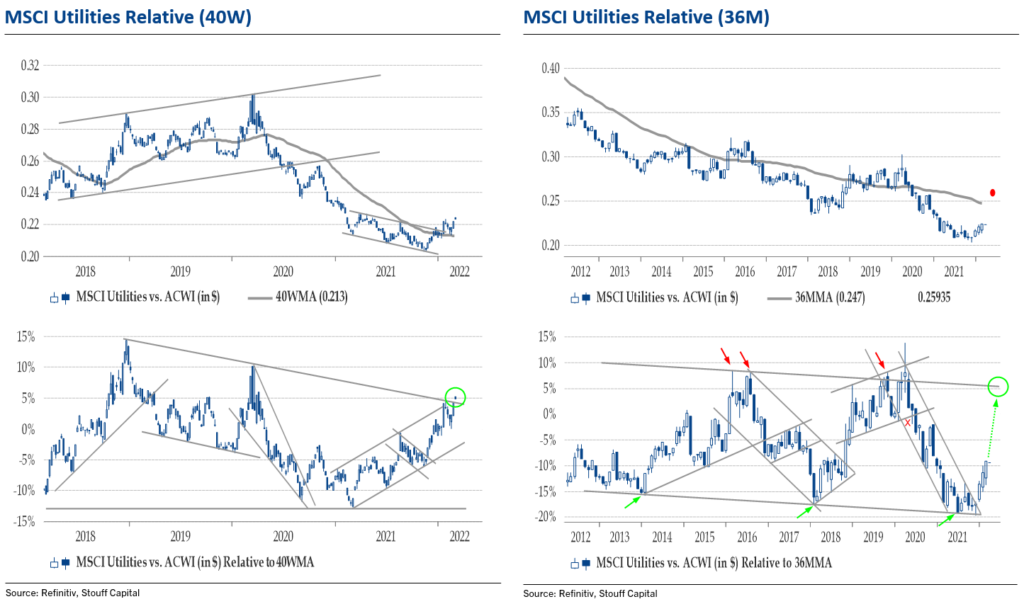
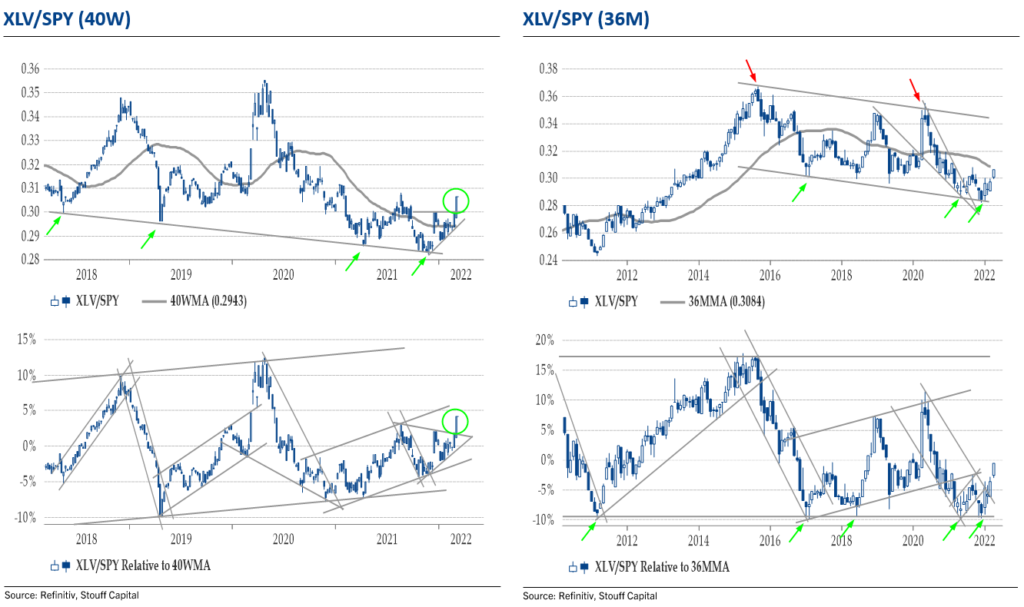
Utilities are on the move in relative terms. Big breakout on 40-week momentum. 36-month momentum broke out in December, with now 3 solid months of outperformance versus global equities. I think this breakout targets a move to 5% above the 36MMA… The red dot on 36M price chart.
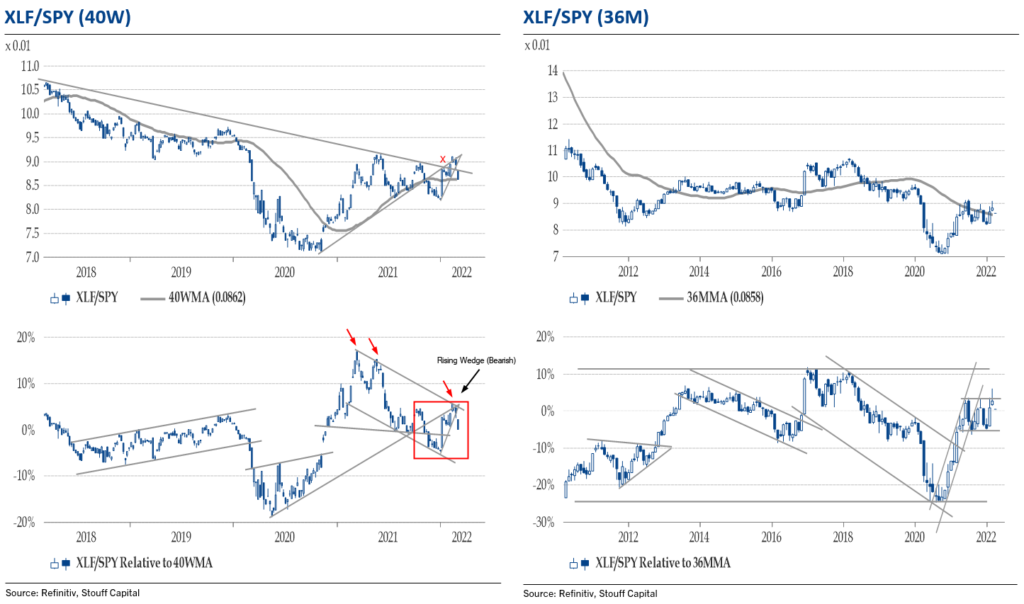
XLF/SPY: A dog out of the prairie.
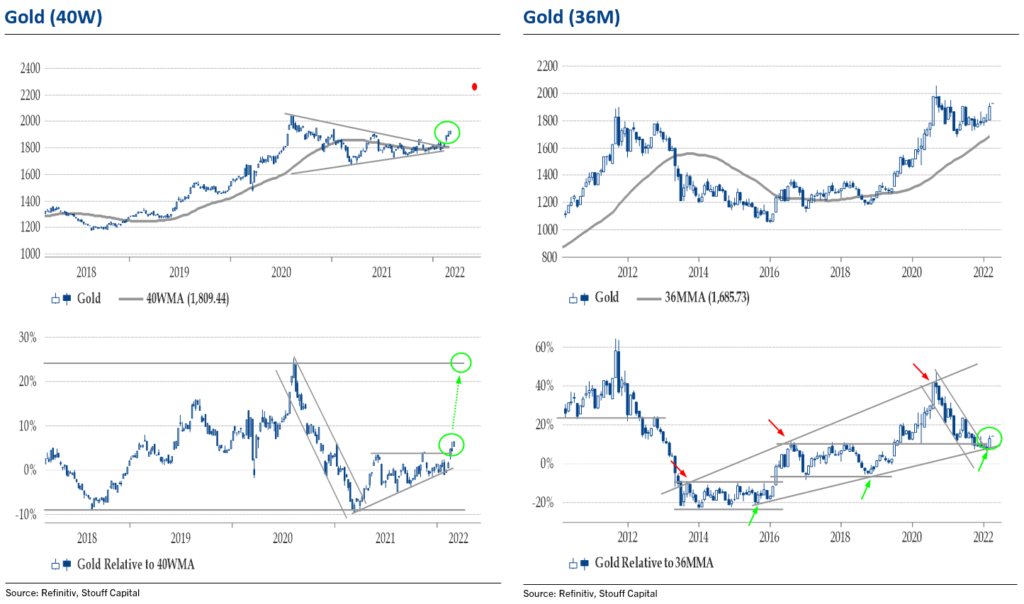
Gold has broken out. A move to 25% above the 40-week moving average seems likely, implying a price target of ~2260 for gold. Red dot on chart.
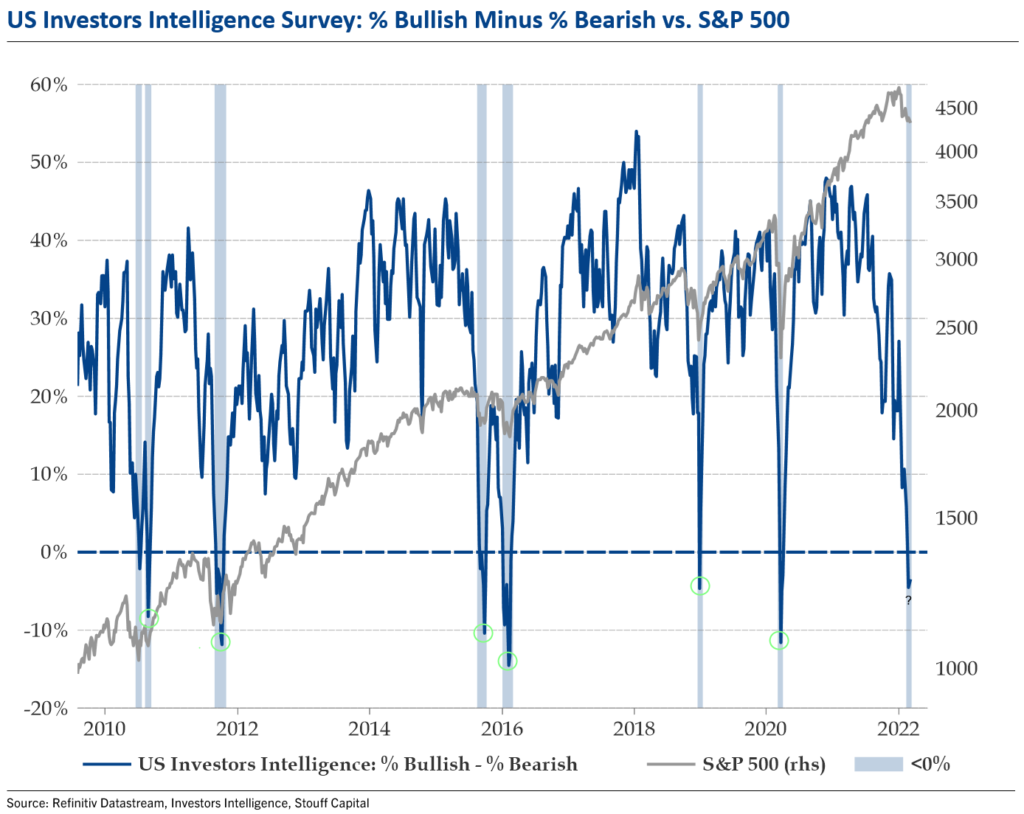
Bears > Bulls for the first time since March 2020…

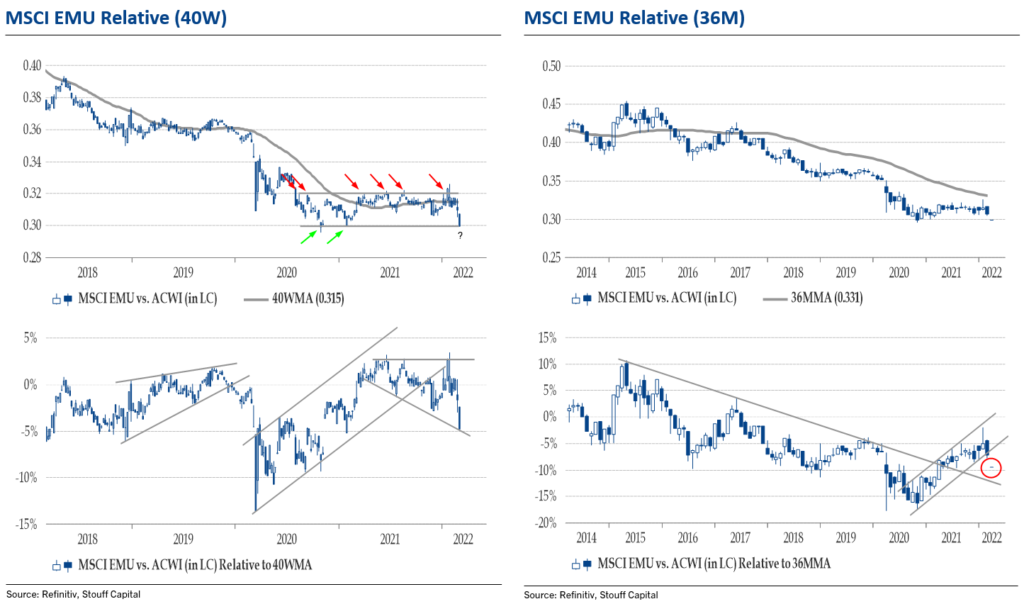
European equities in relative terms have been trading within a tight range for 2 years now… Europe really needs to hold here or the party’s over.
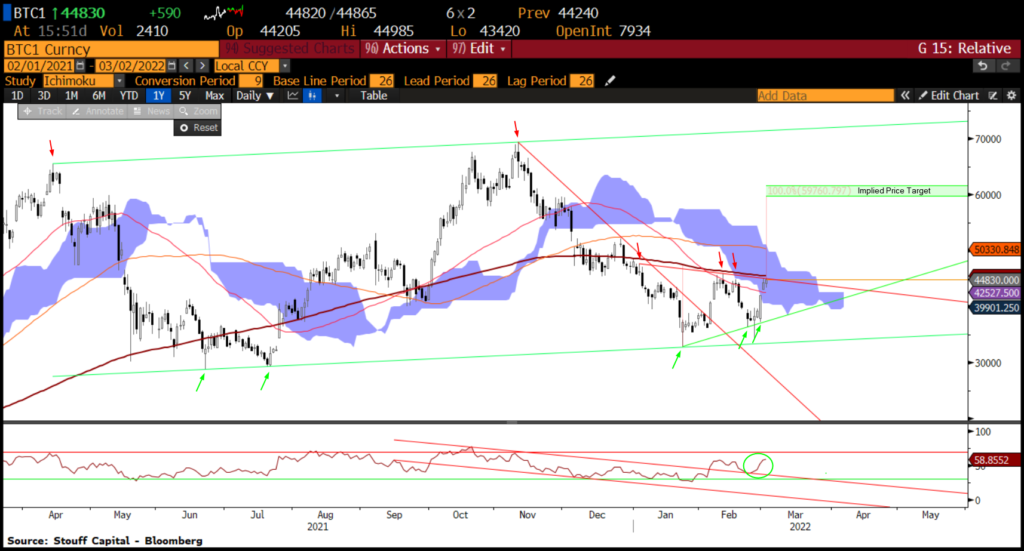
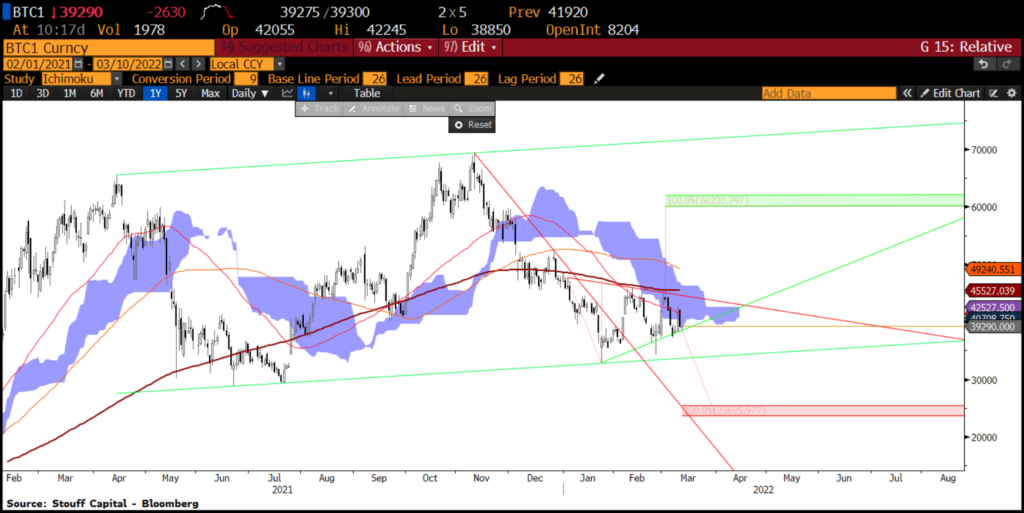
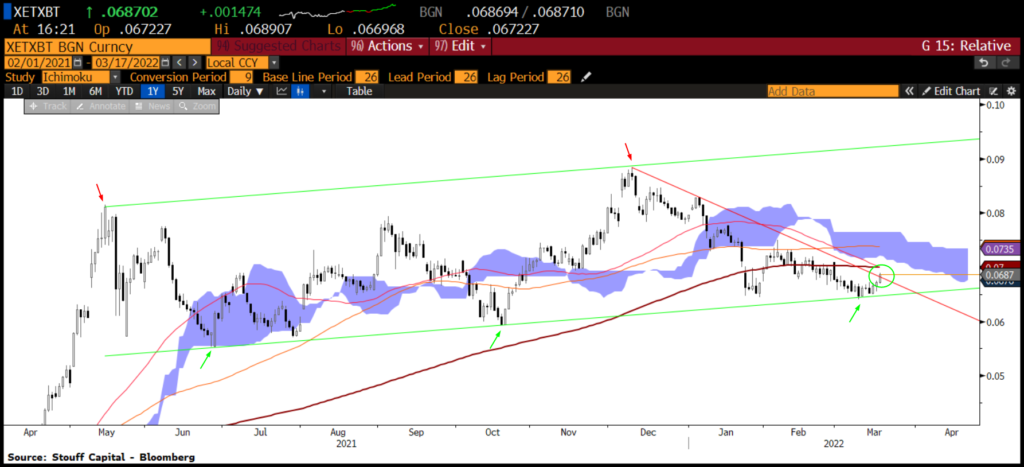
Bitcoin looks to have formed a symmetrical triangle at the bottom end of the huge rising channel. The upper boundary of the triangle is exactly in line with the 200-day moving average. IF we break above these levels, the measured move targets 59760. Something to keep an eye on.
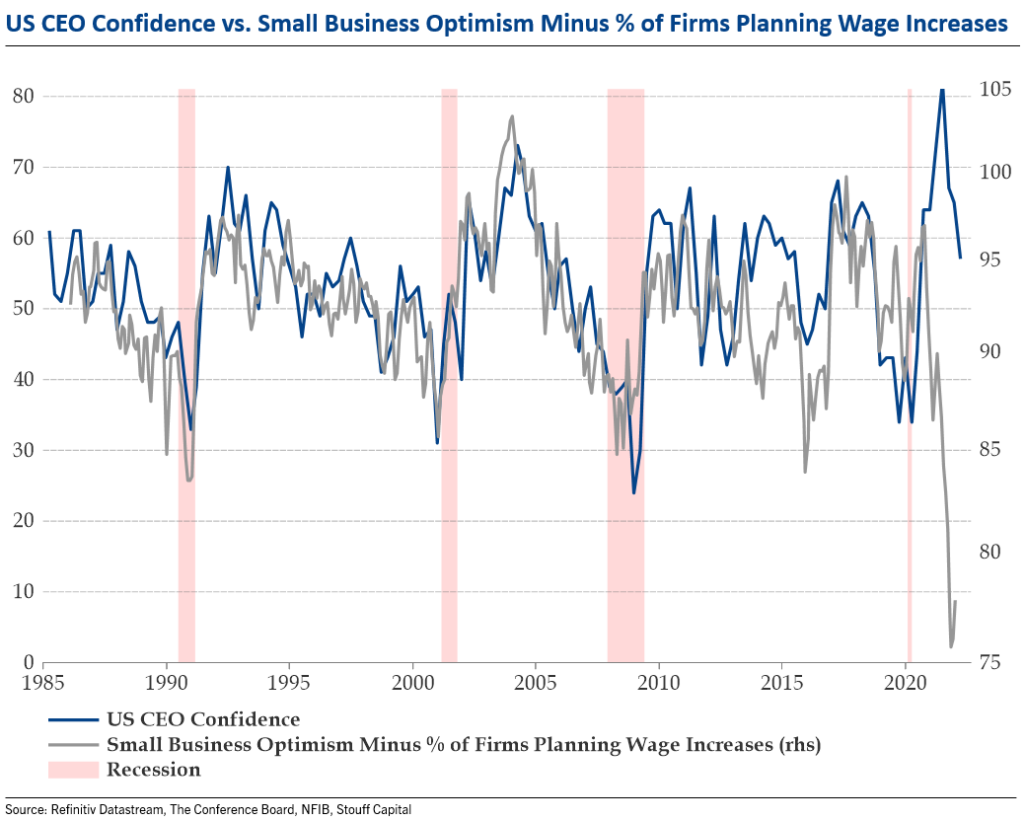
US CEO Confidence according to the latest report from The Conference Board is plunging. I addressed this point at our presentation in December. Wage growth is at a 40-year high and lead indicators suggest top line growth is peaking – it’s a double whammy for margins.
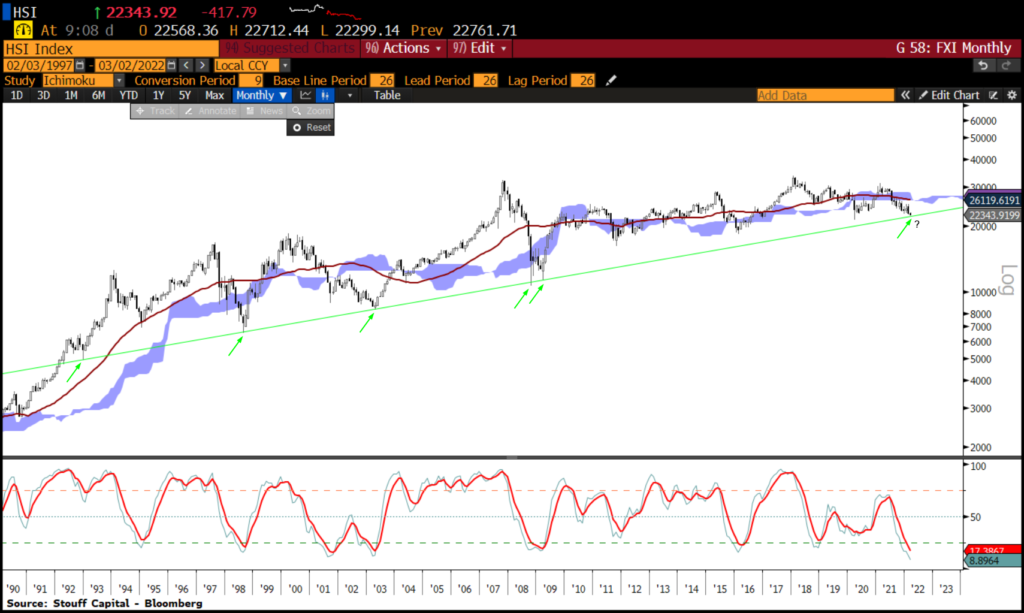
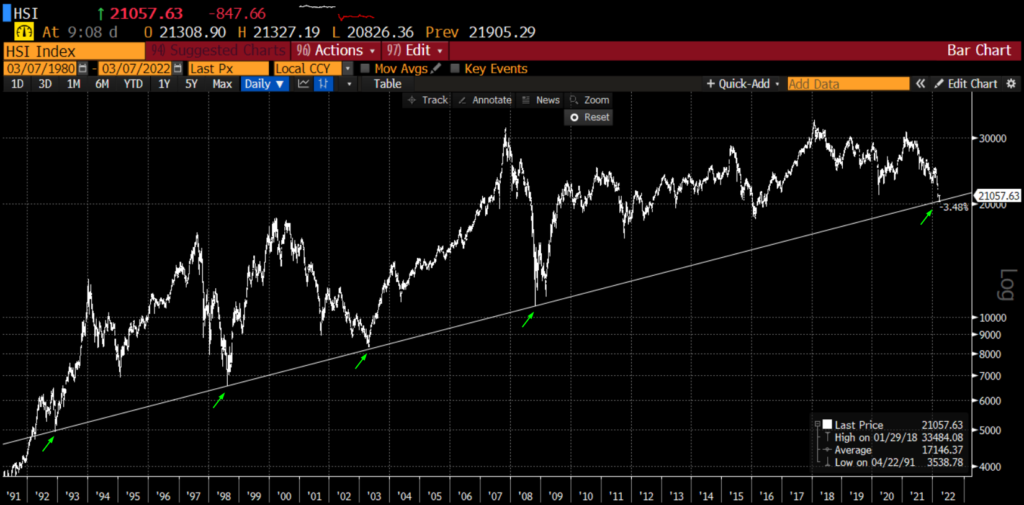
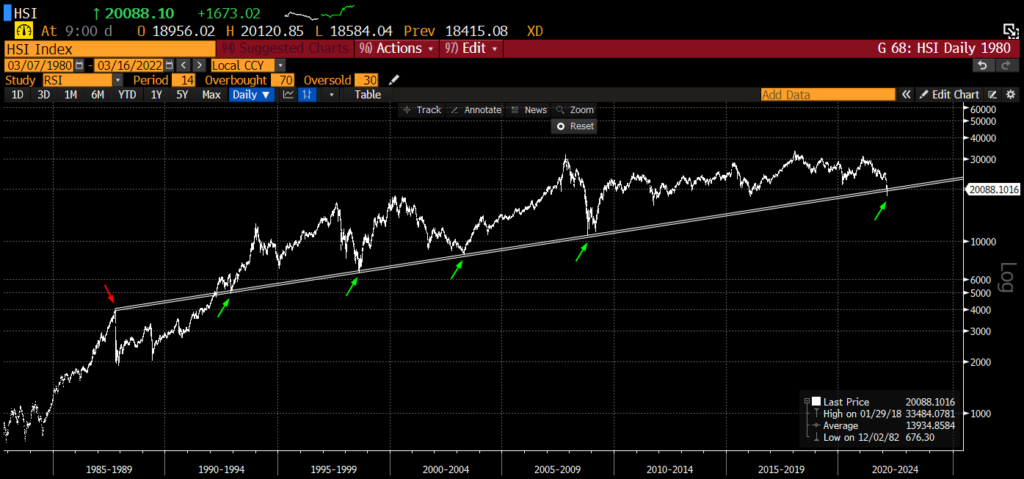
HSI is sitting on key long-term support levels on very oversold momentum. These levels must hold. Difficult to see a floor if we break.
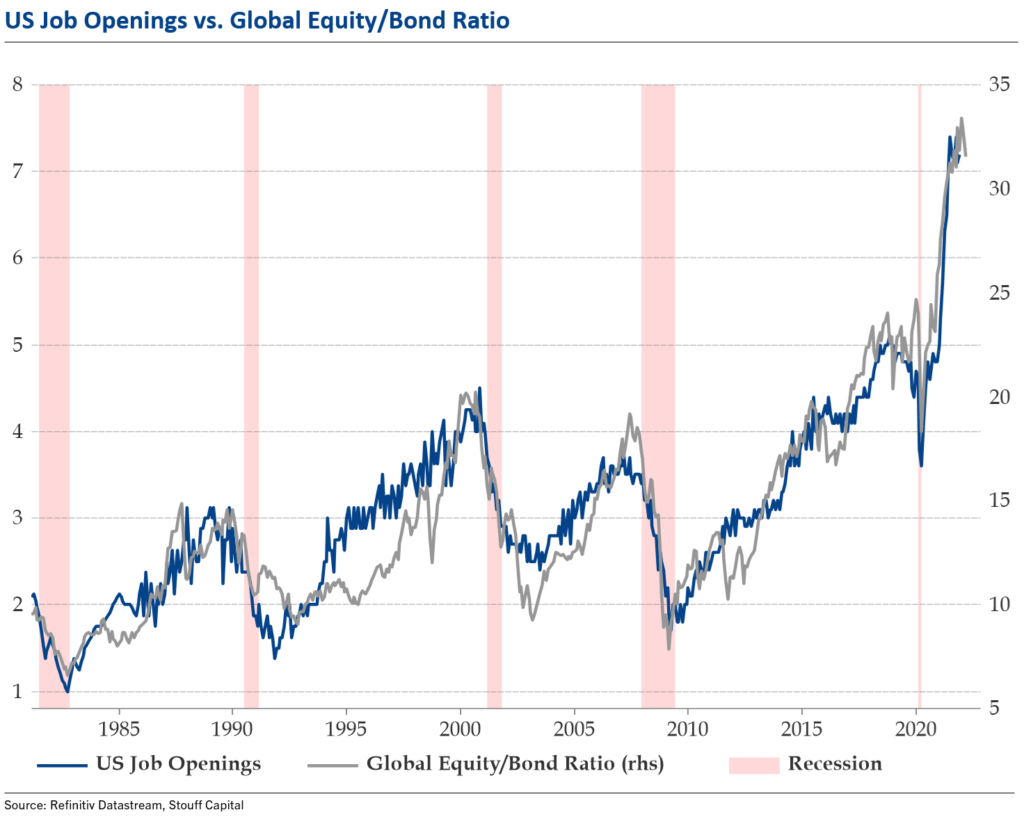
When someone says to me “the stock market is not the economy”…
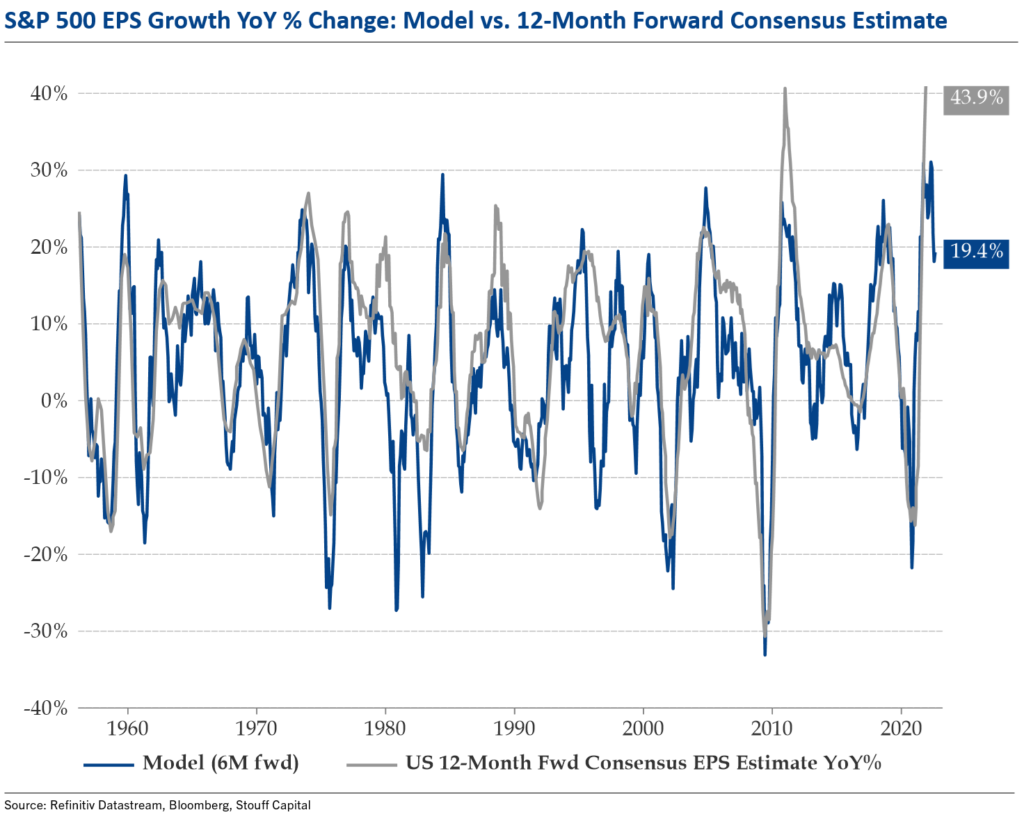
US corporate profits with downside risks over the next 12 months according to my model.
UK equities in relative terms are now very overbought versus global, +2.6 standard deviation from the 6-month moving average.
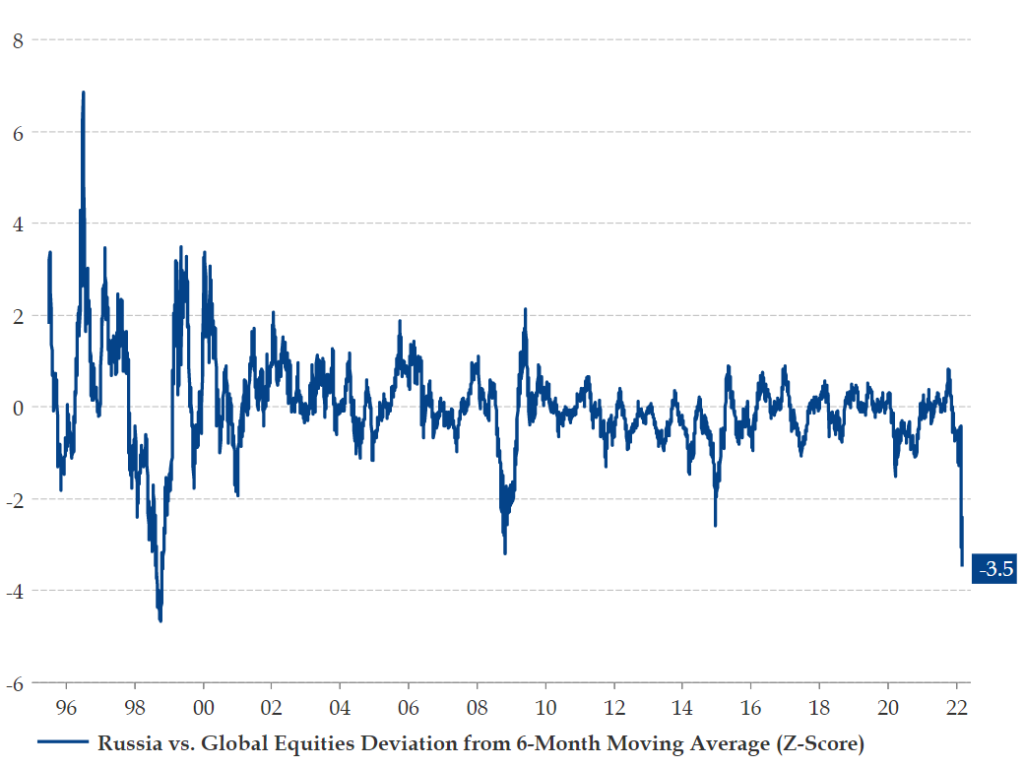
Russia on the other hand, weakest relative sentiment since October 1998 – the 1998 Russian financial crisis. This was the trough in abs and rel. terms.
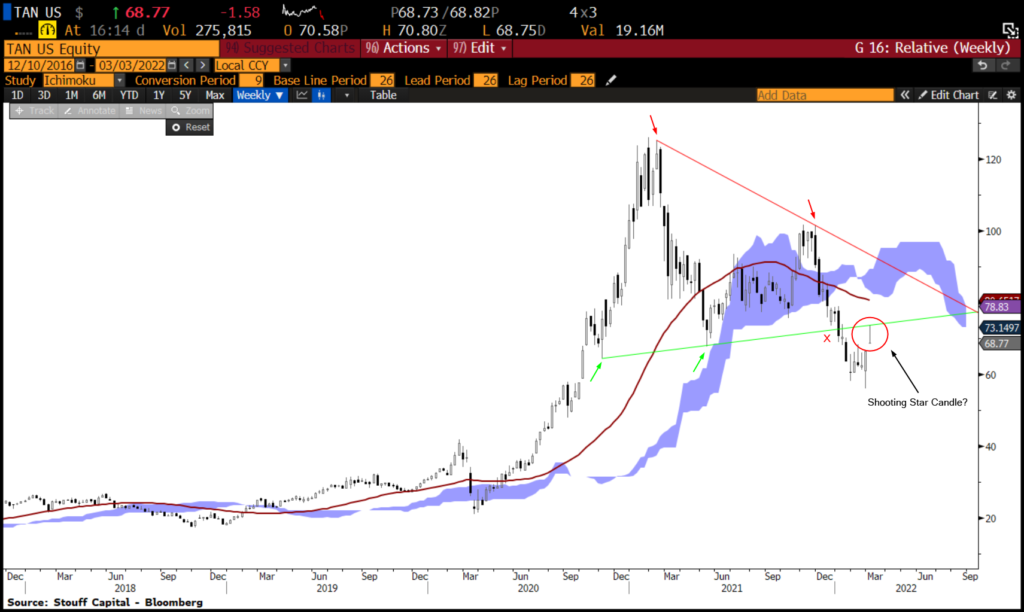
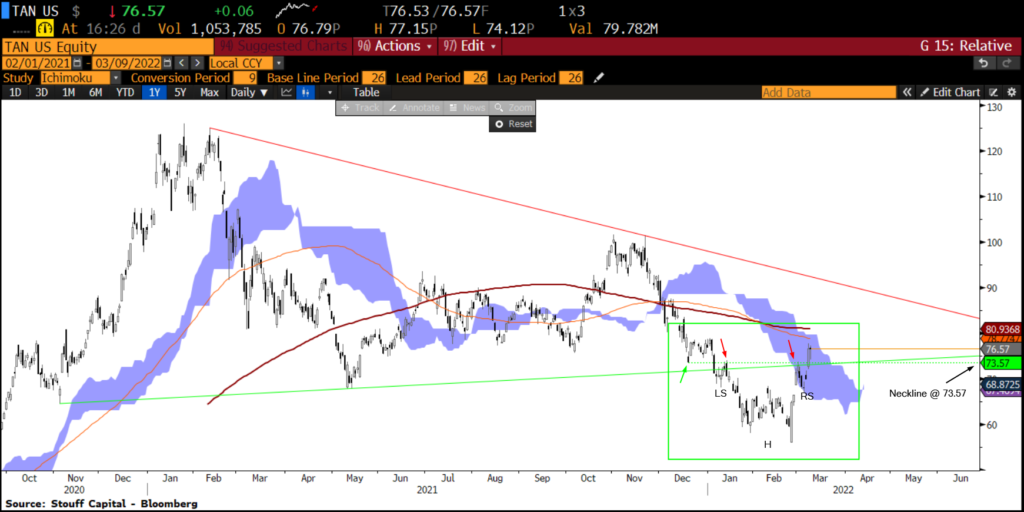
TAN chart to keep an eye on…
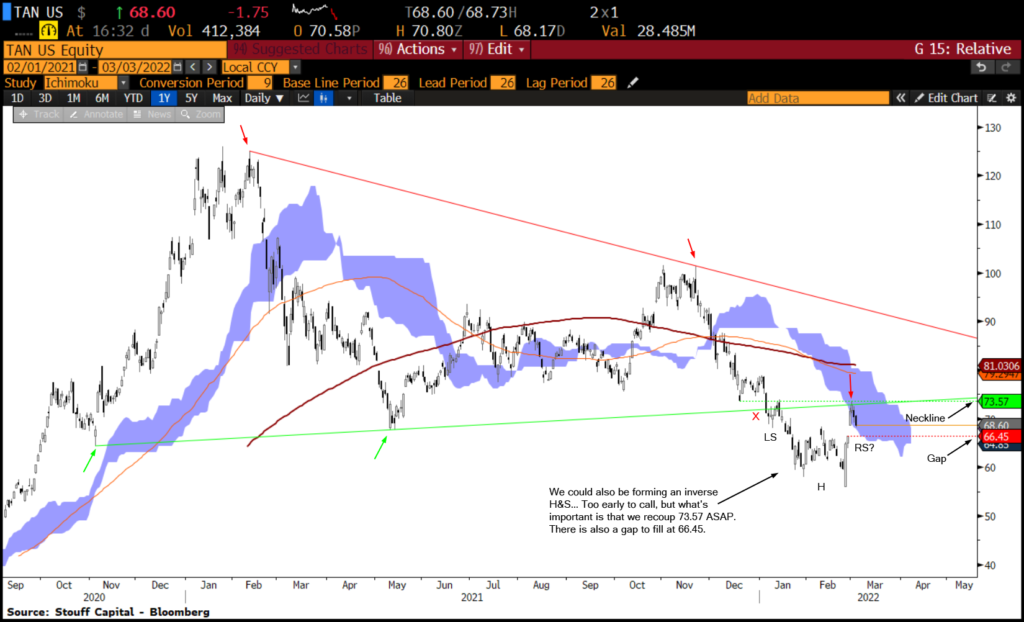
Here is the daily TAN chart with some comments:
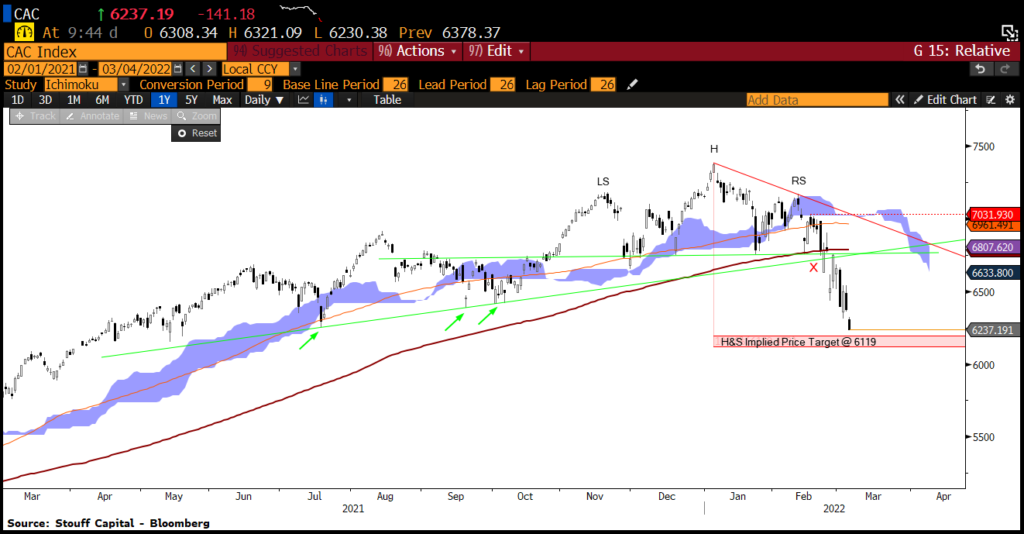
Rapidly approaching CAC H&S top price objective. Might even get there today. Buckle up.
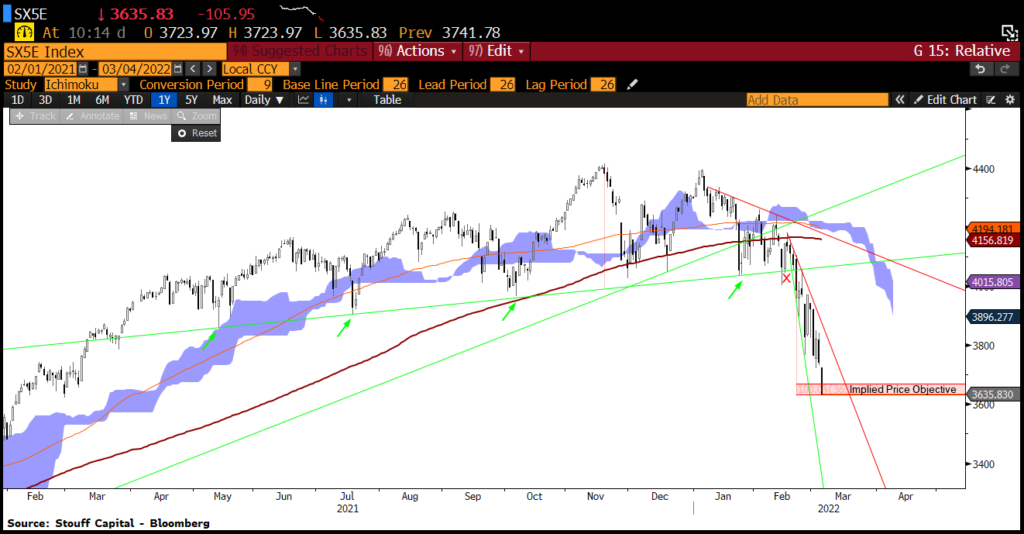
SX5E 1st price objective achieved on very oversold momentum. Time for a bounce? Let’s see. For now Kairos takes profit on short trade.
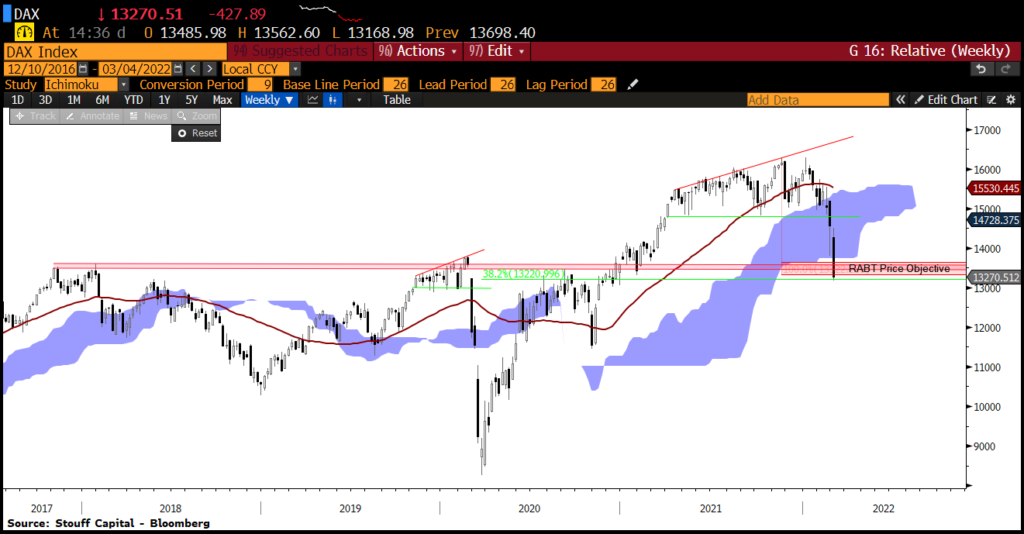
The DAX has also achieved it’s implied RABT price target of 13322. We’ve moved slightly below touching the 38.2% Fib. So far holding.
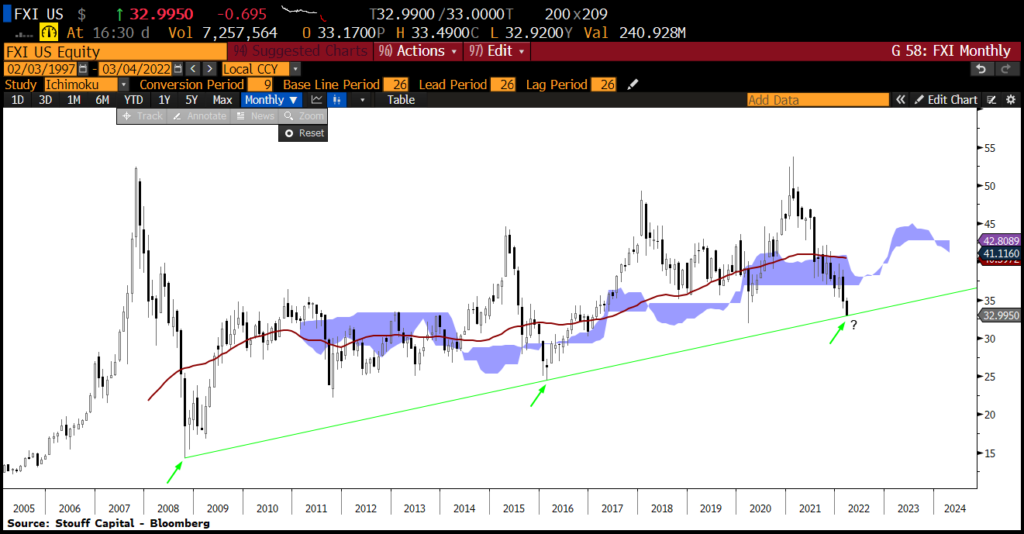
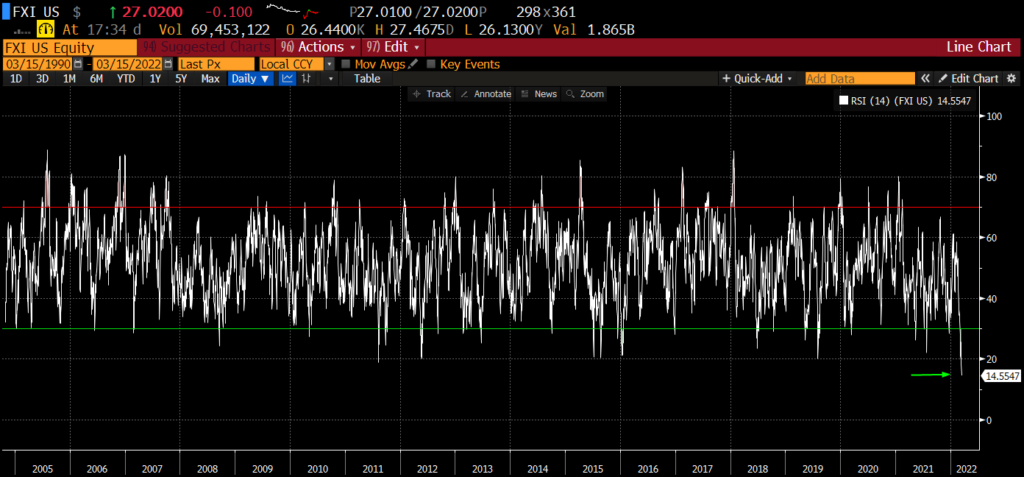
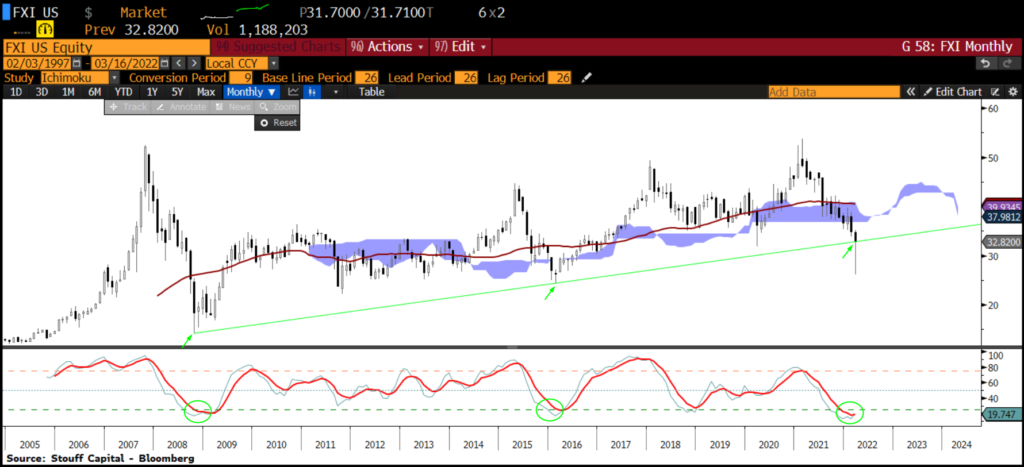
This IS the line in the sand for FXI. Very simple support line drawn through the prior lows and we’re sitting exactly on it. Watching this very closely.
Huston… we have lift off.
XLV/SPY triangles have resolved to the upside, confirming the breakout. XLRE and XLU charts look similar. See Global Utes charts higher up.
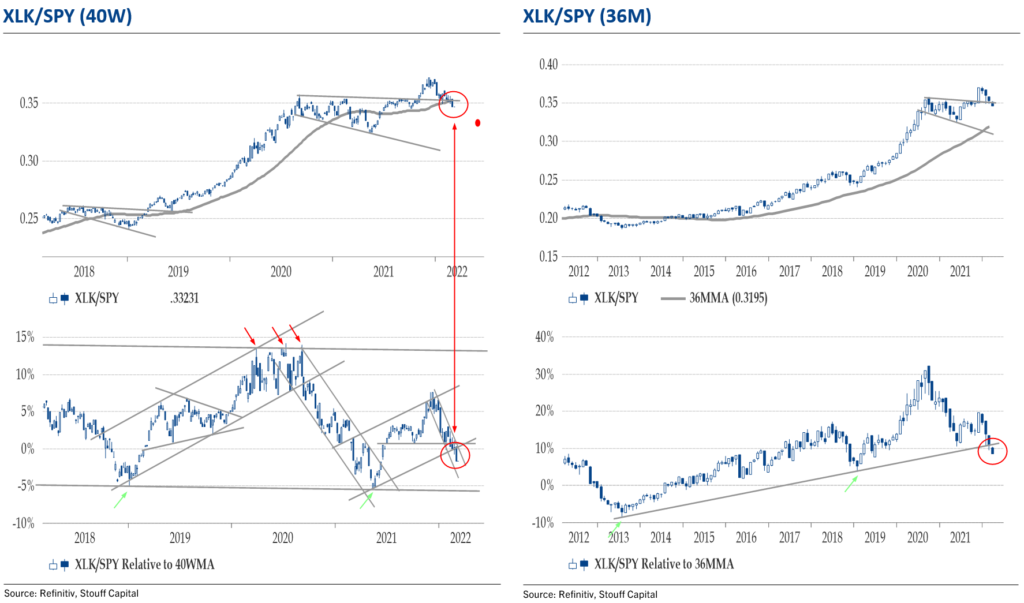
XLK/SPY: Technology in relative terms closed last week below key support levels, and below the 40-week moving average for the first time since June 2021. This is not a good look for XLK vs. the S&P 500. On 36-month momentum the relative uptrend off the 2013 lows looks broken too.
HSI: 3.4% lower to key support levels. If we break this line, I don’t see a floor. This week is likely to be very important. Line has held since 1991.
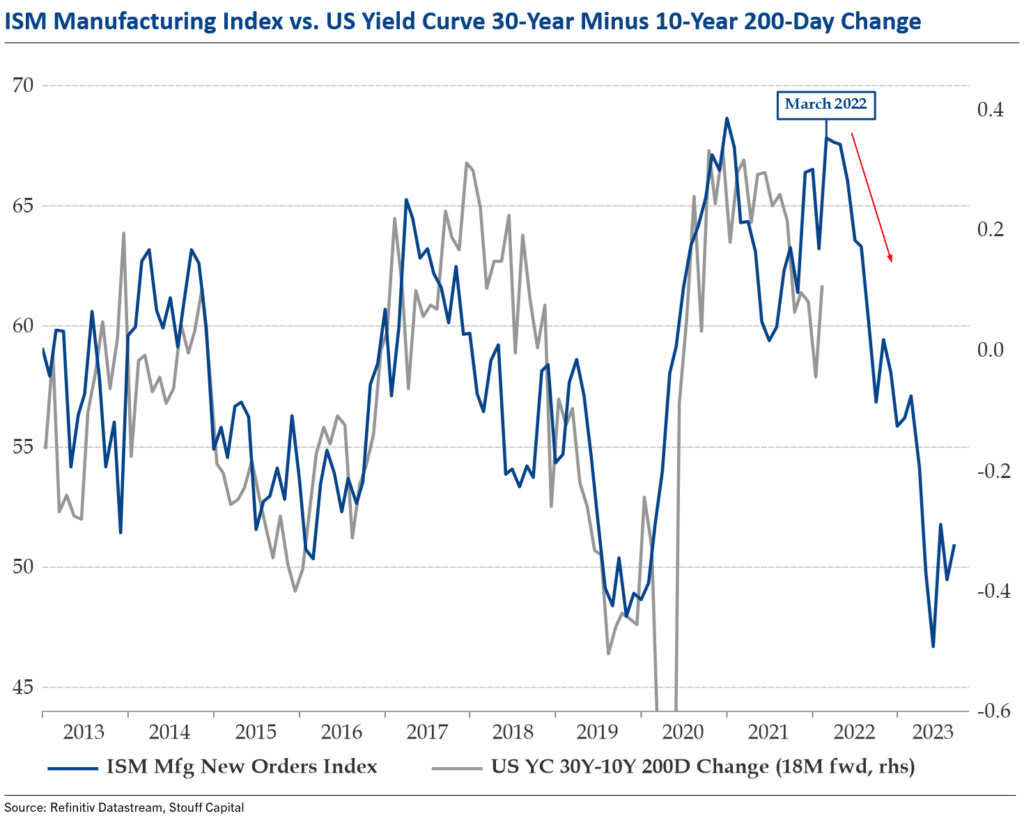
Here is the yield curve implied ISM trajectory with an 18-month lead. Basically suggests one-way traffic for US economic momentum in 2022…
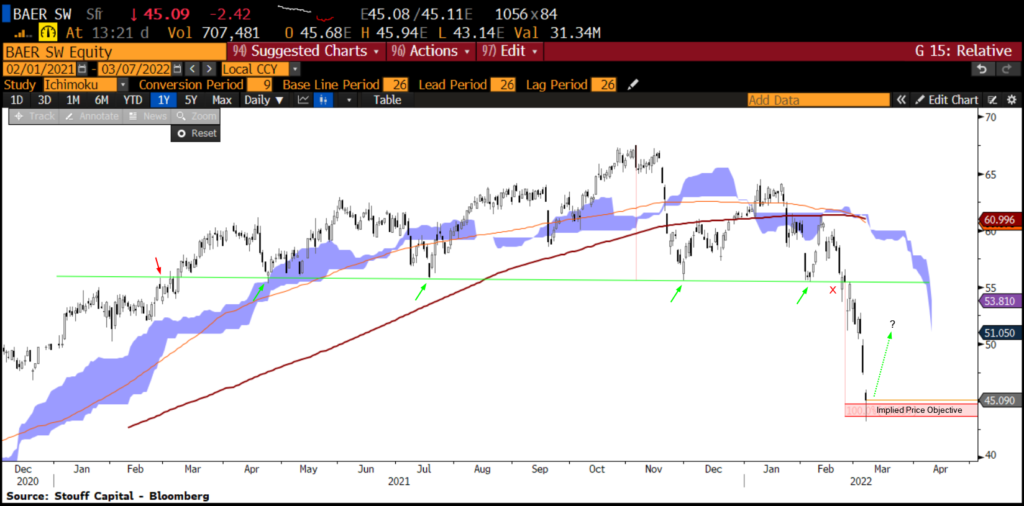
Julius Baer is rallying hard off of broadening top target price objective with an RSI of 23. If these levels hold we could finally get a ST relief rally…
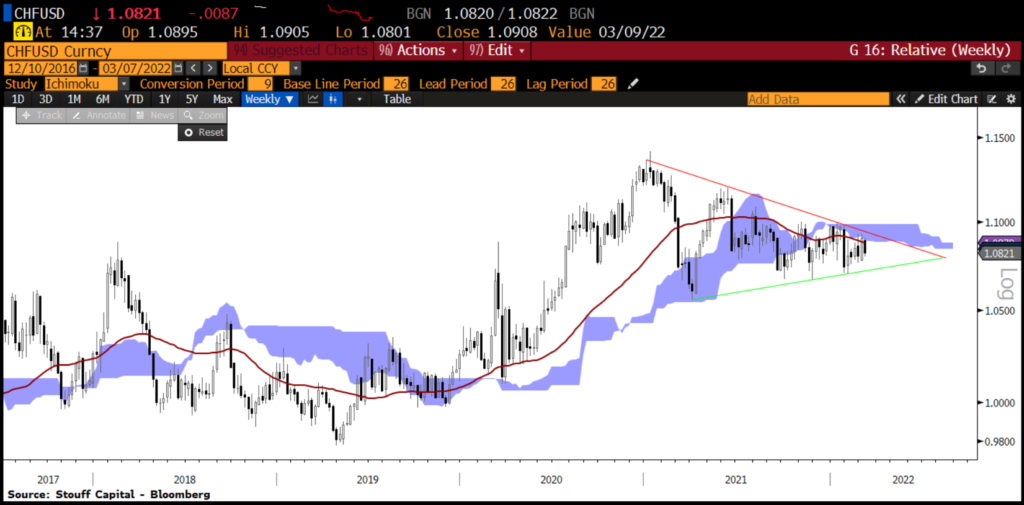
This is the chart to watch for CHF/USD. A huge symmetrical triangle. We could be close to a big move soon. Something to keep a close eye on.
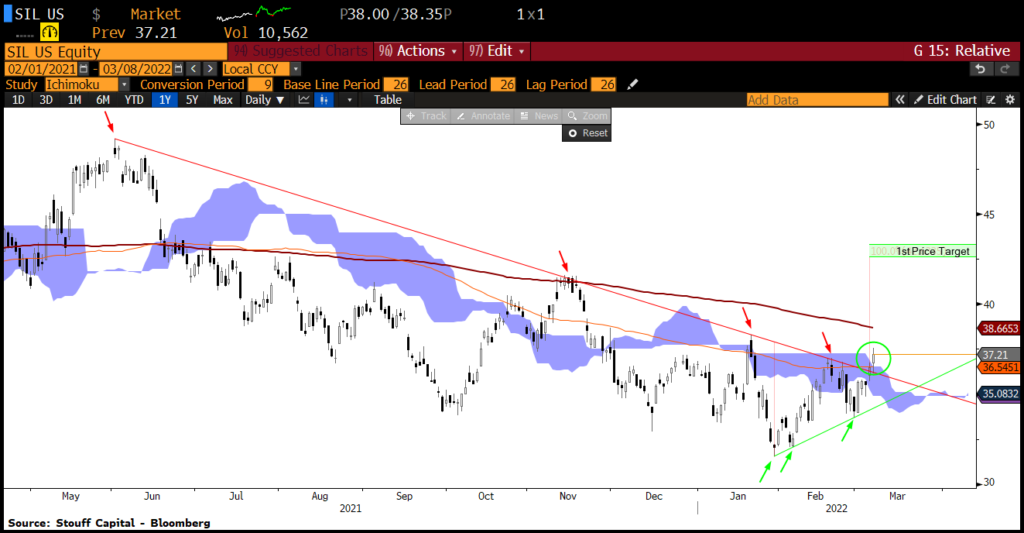
Much like gold miners (GDX US), silver miners are breaking out from a 9-month downtrend (SIL US). My first price objective is 42.6.
As of 08.03.2022, crude oil is a whopping 90% above trend, highest since November 1990!
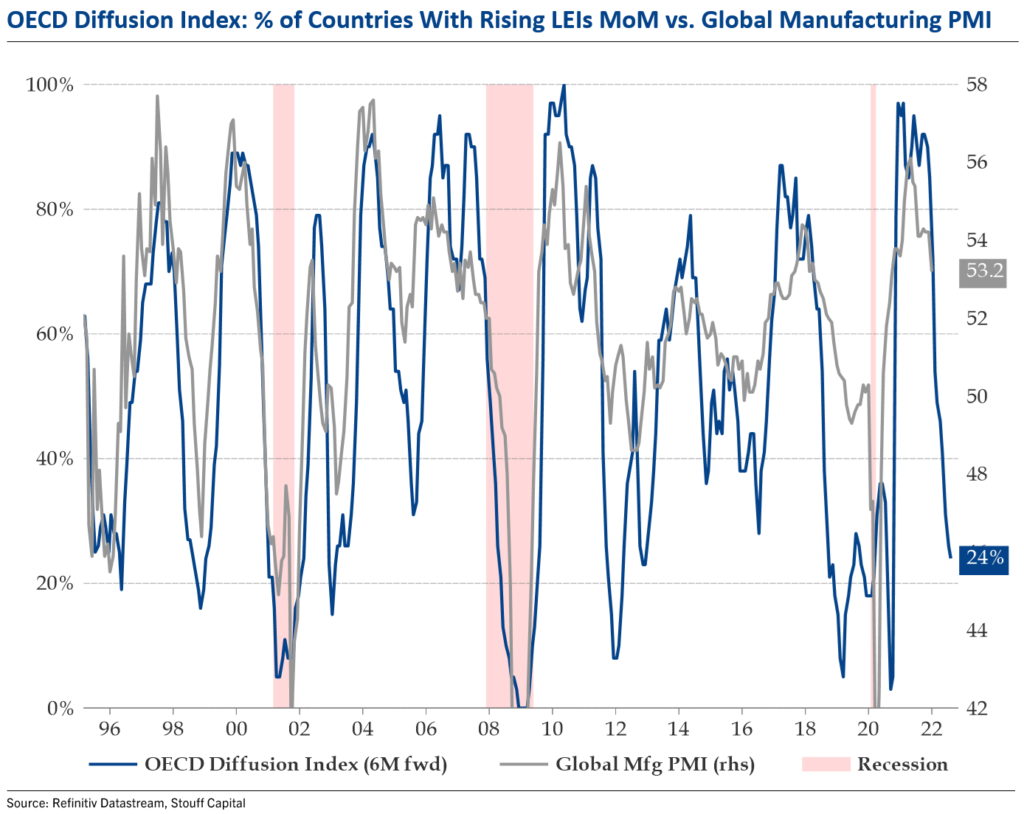
The % of OECD countries with rising lead indicators month-on-month has fallen to 24% in February, lowest reading since April 2020. This continues to suggest headwinds for global economic momentum during H1 2022. Here shown versus the Markit Global Manufacturing PMI.
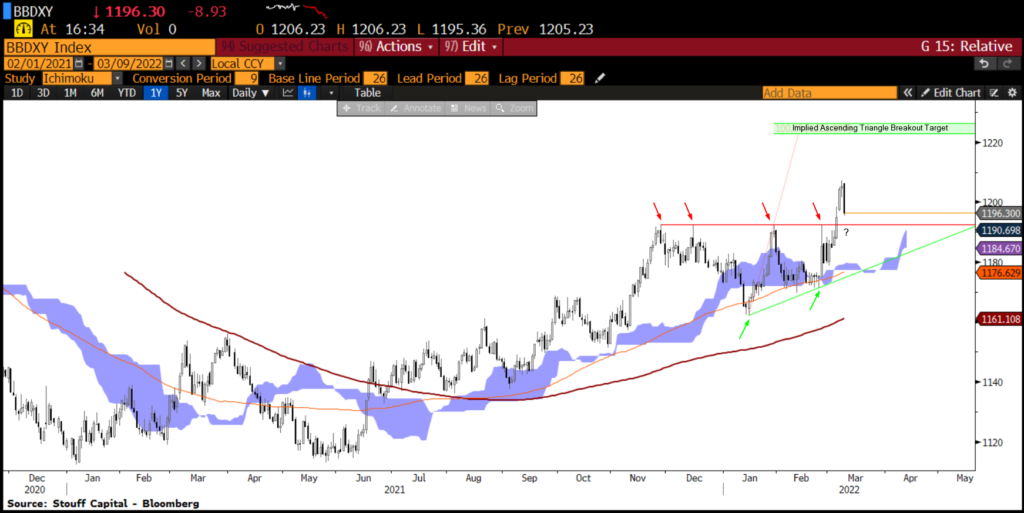
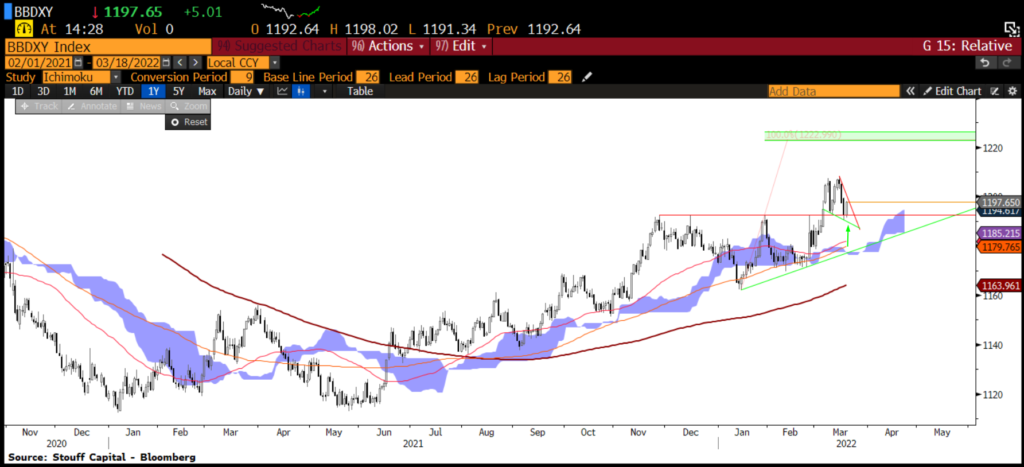
This is THE key dollar chart to keep an eye on. Technically speaking, it looks like we broke out from a 3-month ascending triangle (bullish) on 03.04.2022. A re-test of previous resistance will be a key hold for bulls. IF we hold this re-test, then the implied price target is around 2.5% higher.
TAN update: TAN looks to have put in the small inverse H&S bottom I discussed last week after filling the gap at 66.45. Implied price target is 85.5.
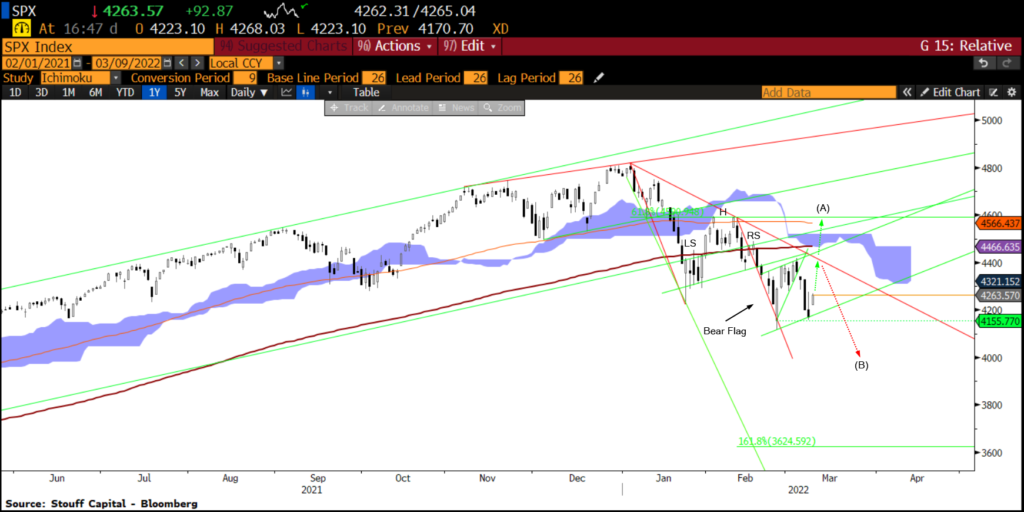
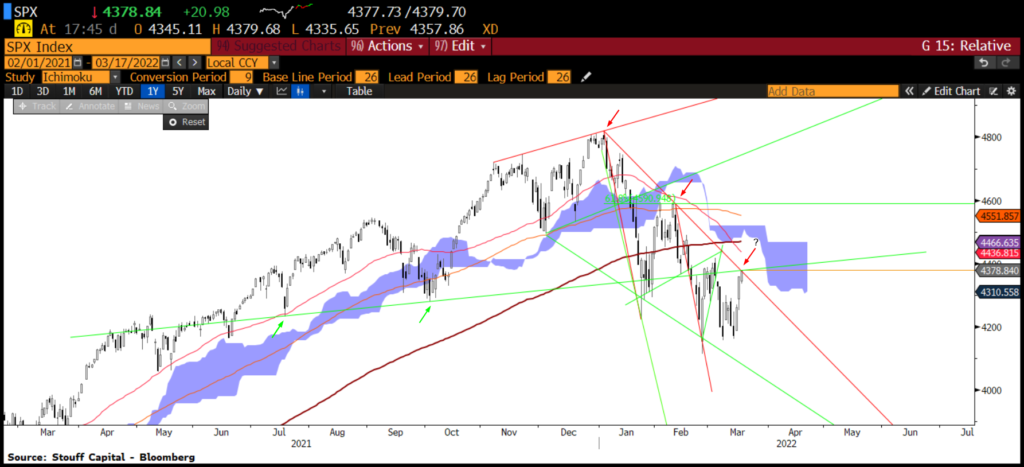
Here is the latest S&P 500 Bear Flag to keep an eye on… Key level to hold is 4155; <4155 and next stop targets ~4000. CPI tomorrow is important.
Small uptick in II Bull/Bear spread this week, but still lowest since March 2020. A good contrarian buy signal outside of major bear markets.
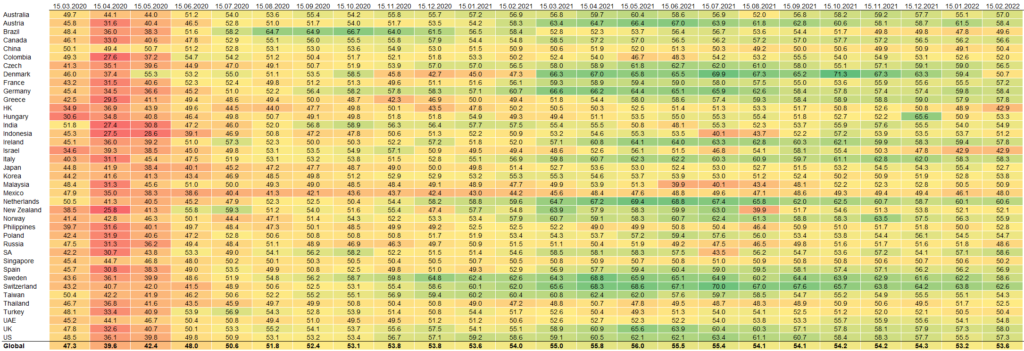
Global Markit PMI Heatmap for February:
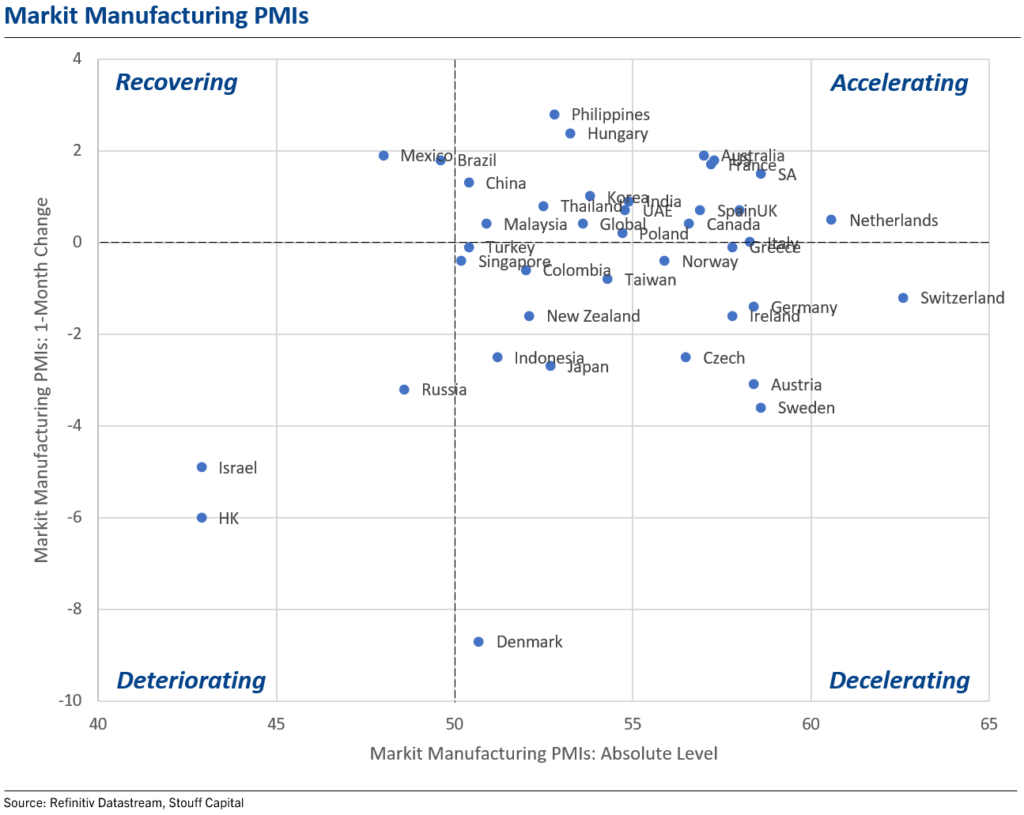
Global Markit PMI Scatter for February: 88% of countries still in expansion territory (>50) with 50% of countries down month-on-month.
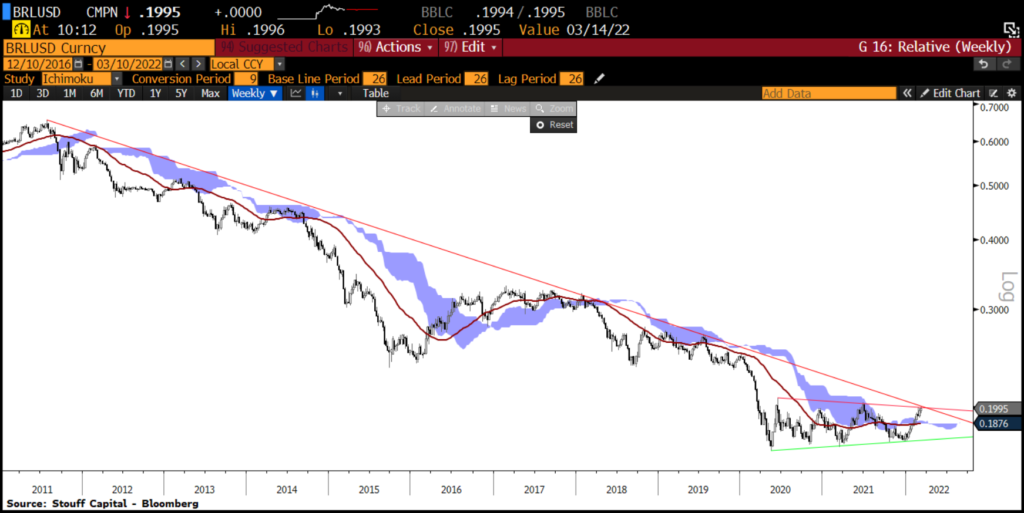
BIG level for BRL/USD. Watching this very closely.
Bitcoin price targets with a resolution of symmetrical triangle.
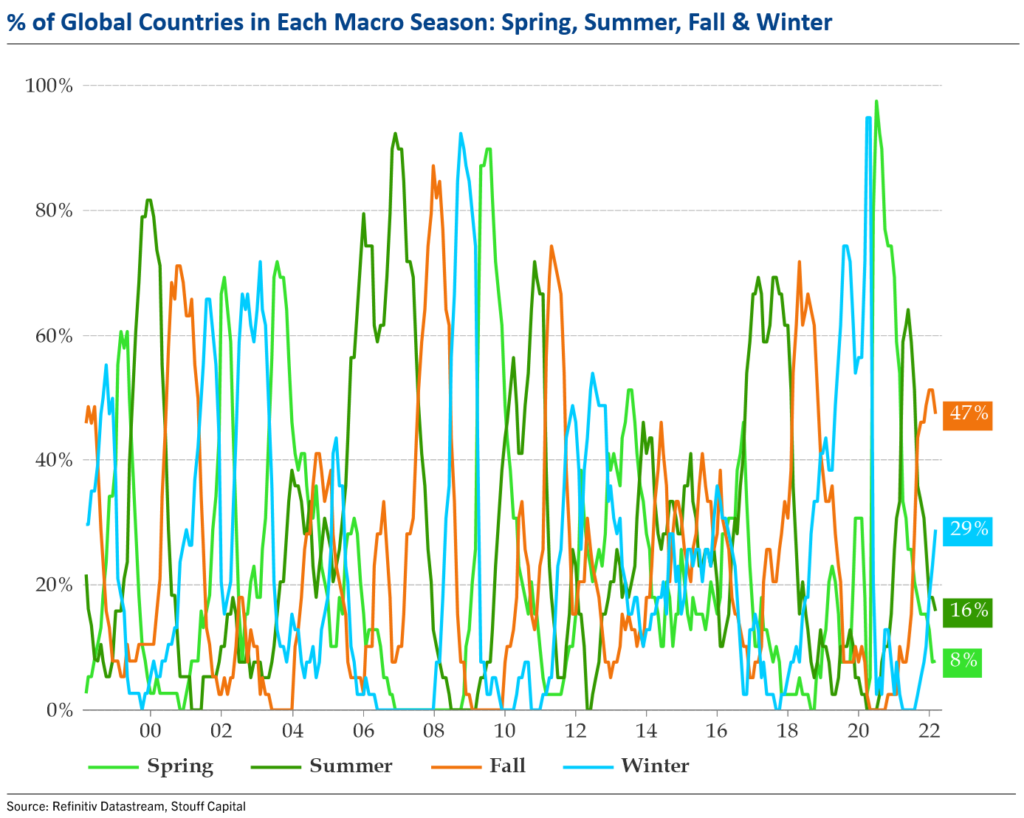
February Macro Seasons update: 47% of global countries in Fall, 29% in Winter, 16% in Summer, and 8% in Spring.
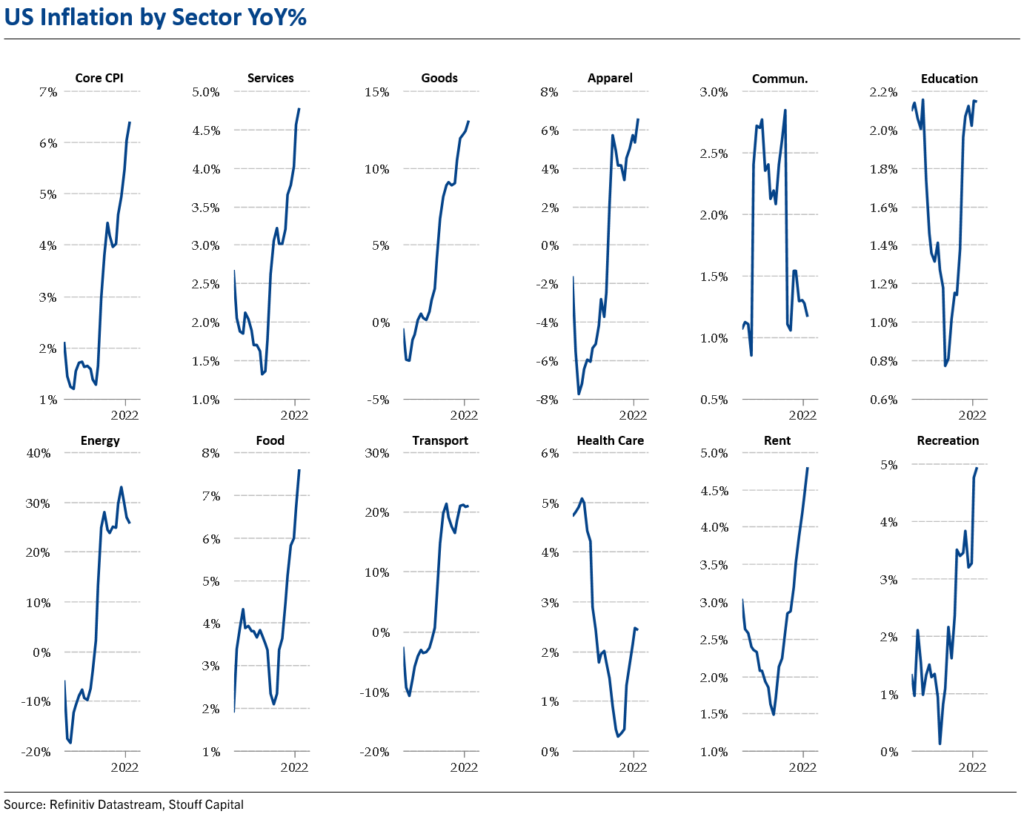
A look at US inflation by sector in February: The headline CPI number was boosted by a 6.6% jump in gasoline prices and a 1.0% increase in food prices, mostly a broad-based surge in prices for food at home, up 1.4%. Note that utility energy costs fell 0.4%; all the increase in the overall energy component is clearly due to higher oil prices. The core gain was led by rents, as usual. More favorably, medical care costs came down after their overshoot in January and vehicle prices were unchanged. Used auto prices dipped 0.2% after four straight increases. To the upside, I would say the 5.2% jump in airline fares is surprising given the plunge in passenger numbers during the Omicron wave. Prices rose further for apparel, household furnishings, and recreation; but at a slightly slower pace than in January. My best guess is that headline will peak in March at 8.2-8.4% and then come down meaningfully for the rest of 2022. Let’s see.
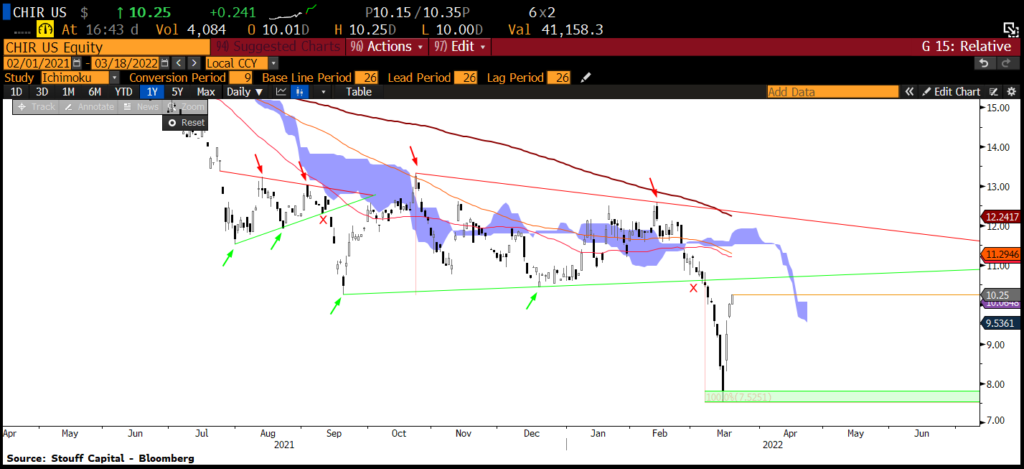
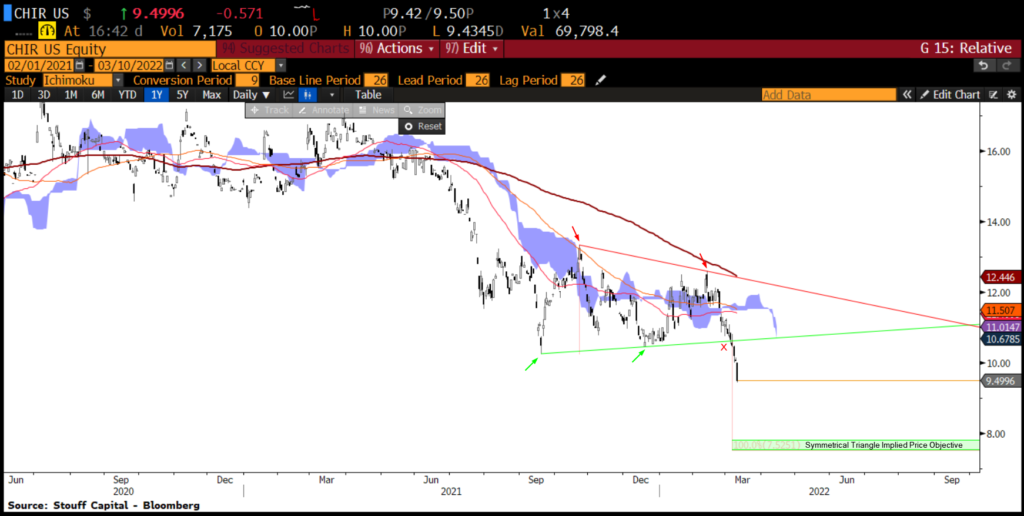
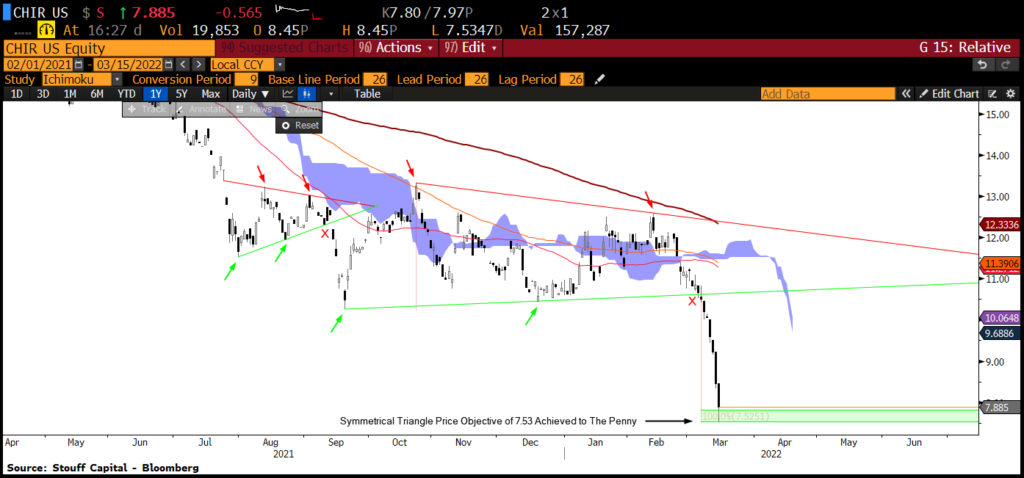
CHIR US is in total puke mode with an implied price objective 20% lower following the breakdown of the symmetrical triangle on 07.03. I had been bullish on Chinese RE on the back of Xi pushing state-owned banks to lend to distressed real estate developers… Totally wrong. We’re headed lower.
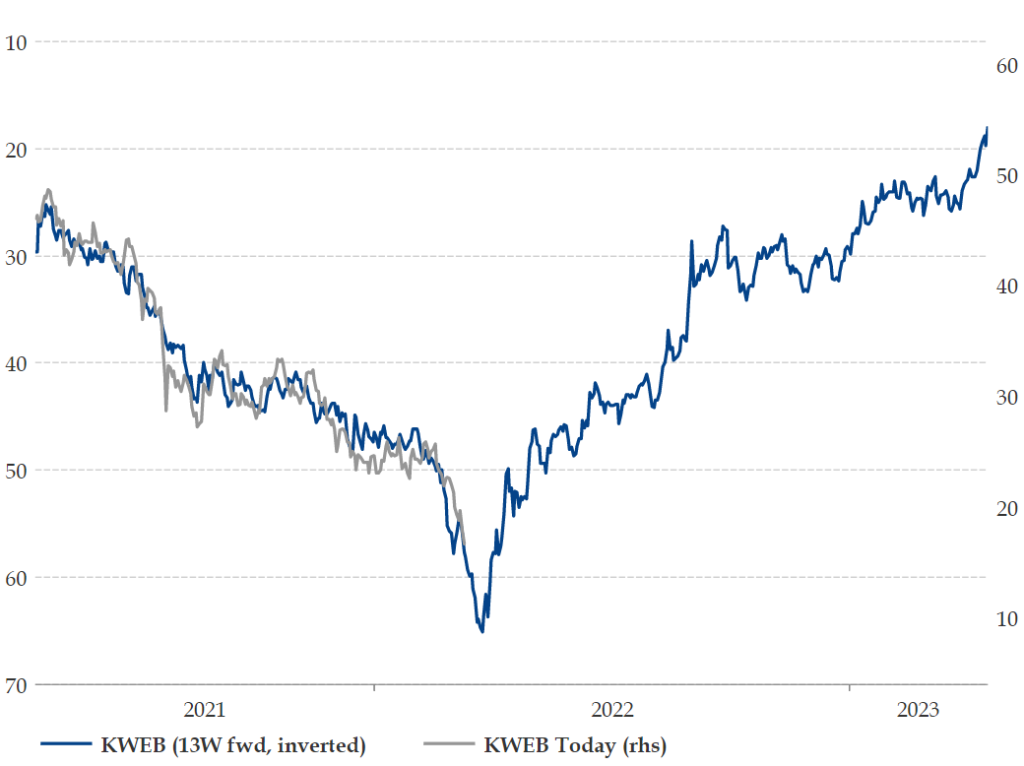
KWEB melt-down looks a lot like the March 2020 to Feb 2021 melt-up… If this correlation holds, we could be approaching a major inflection point.
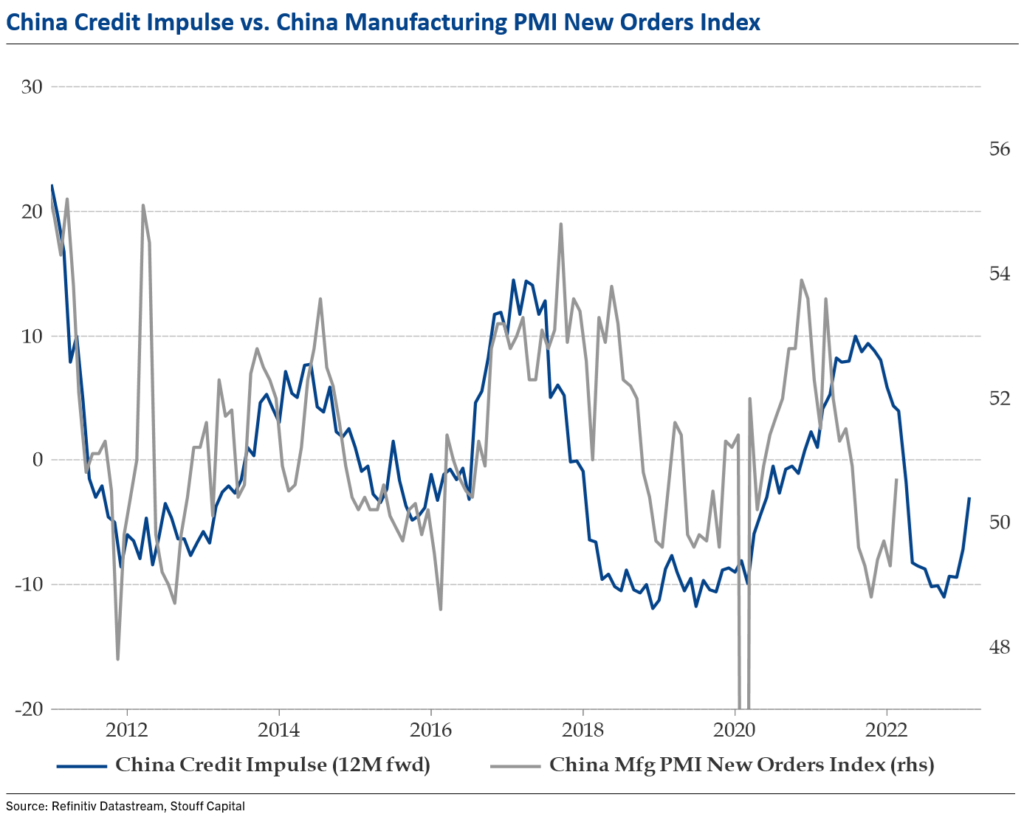
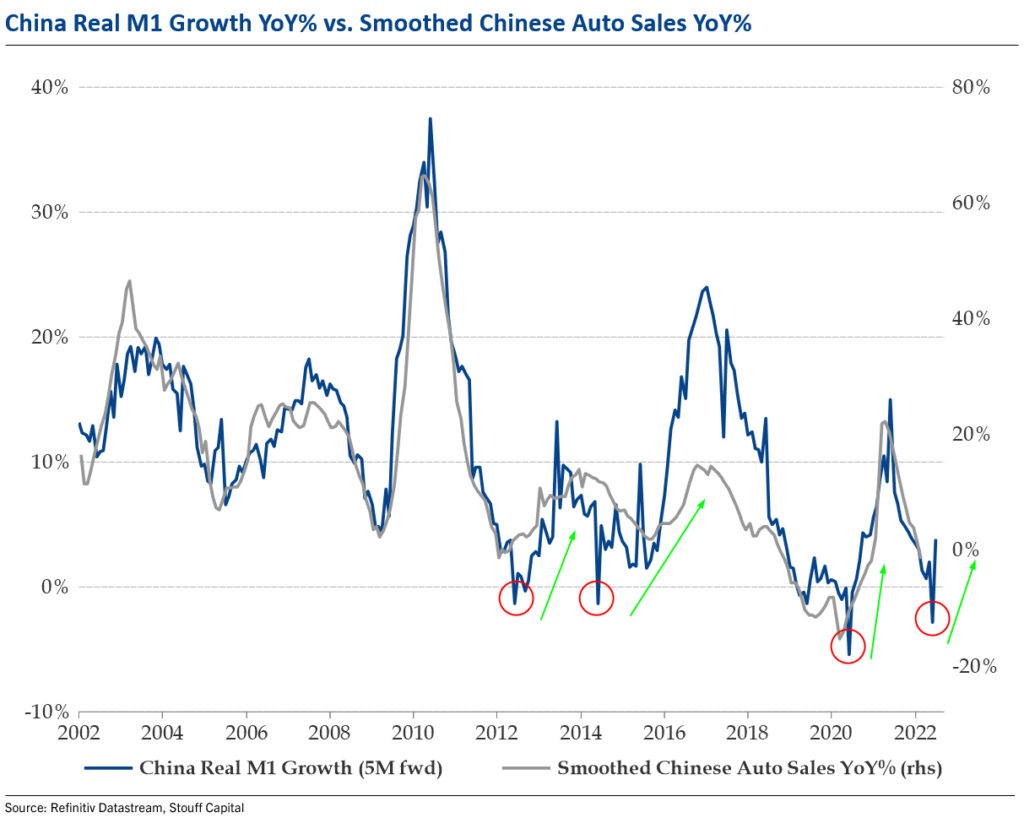
China Real M1 growth rose to 3.8% YoY in February. This bodes well for US & Euro Zone new export orders already in H2 2022. Also, don’t be fooled by large drops in January China M1 numbers… It’s seasonal and generally marks the low.
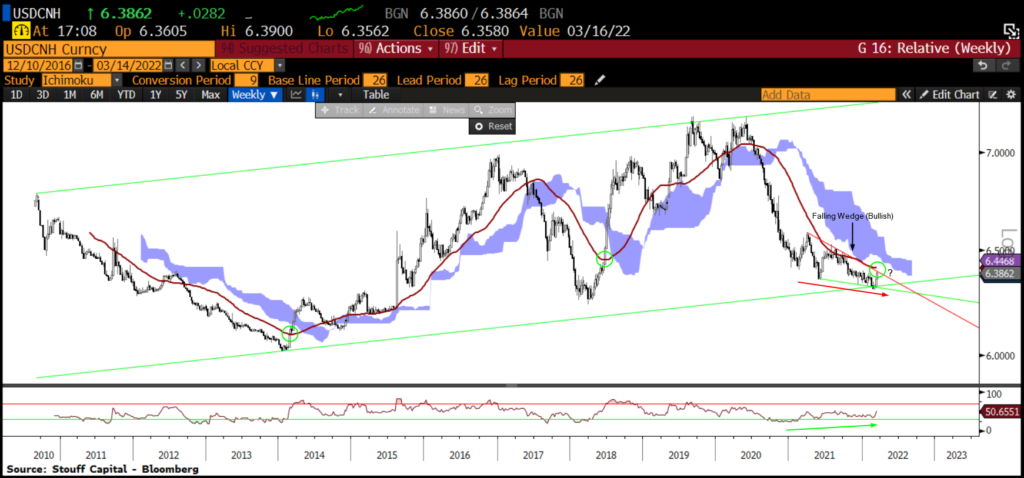
USD/CNH looks like it’s on the verge of breaking out with a positive RSI divergence. This is a pure macro play on weaker global economic activity. Kairos is watching closely for a confirmed break above the 200DMA.
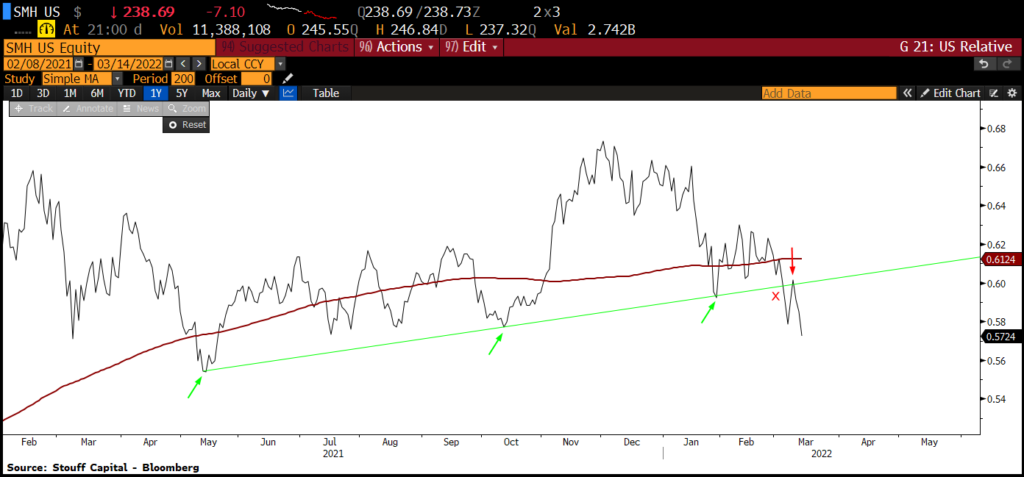
Semis breaking down in relative terms…
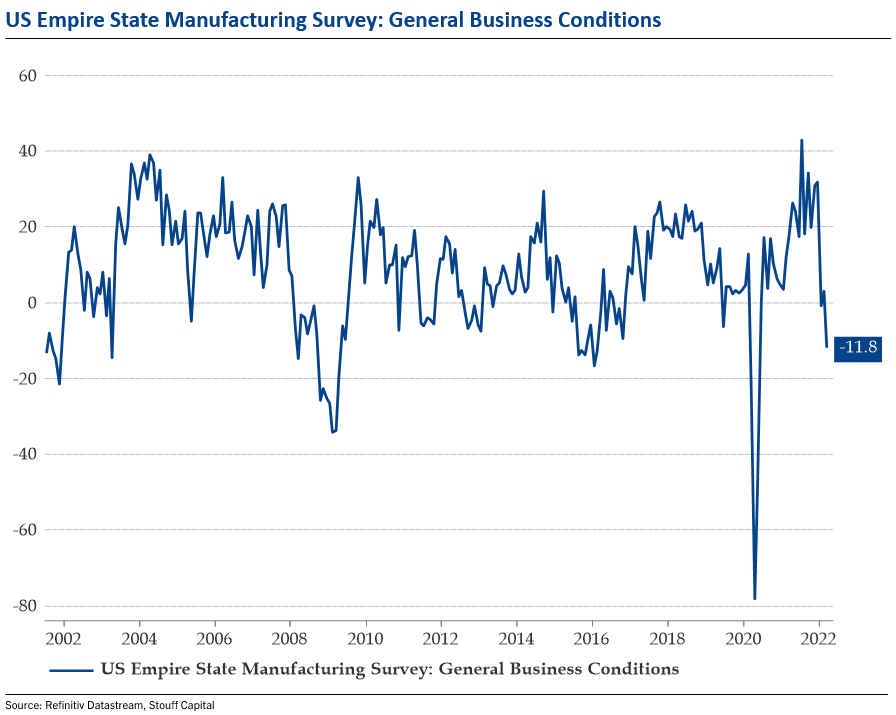
Empire Manufacturing Survey: -11.8 vs. Exp. 6.4 (Prior 3.1)
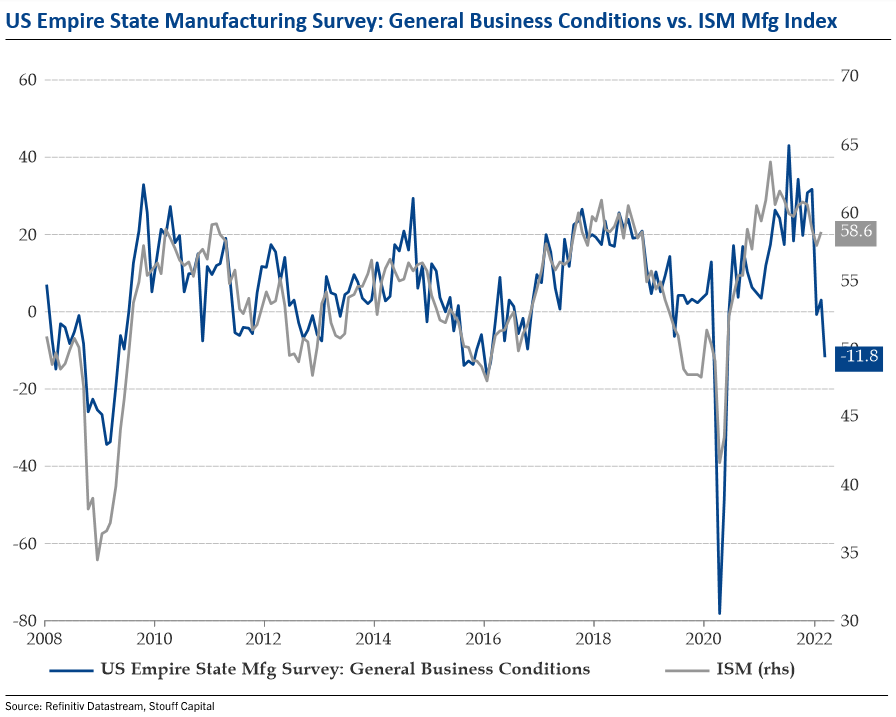
Here is the Empire Survey versus the ISM Manufacturing Index, 80% correlated since 2008.
March BofA Fund Manager Survey is out:
- Global Growth Optimism lowest since July 2008 (Ahead of Lehman)
- 60% expect a stagflationary environment
- Allocation to global equities lowest since May 2020
- Expectations for growth and profits is recessionary
- Inflation remains elevated so rate hikes still expected
- Investors expect 4.4 rate hikes compared to 4.0 in February
- Liquidity conditions worst since April 2020
- Hedge Fund equity exposure lowest since April 2020
CHIR symmetrical triangle price objective achieved to the penny.
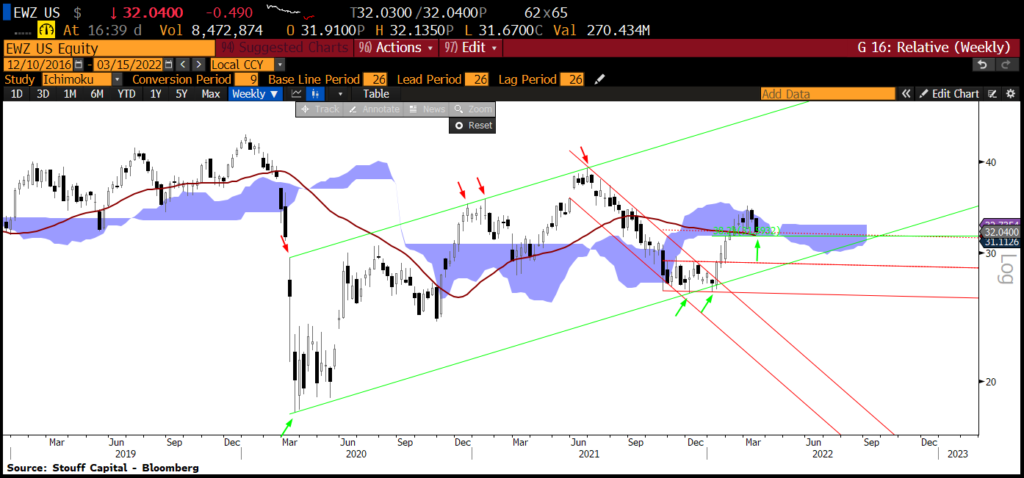
EWZ is still clinging to key support levels resting on the 200DMA which corresponds exactly with the 31.8% Fib. retracement.
FXI with an RSI of 15 is now the most oversold level in the index’s history… Amazing.
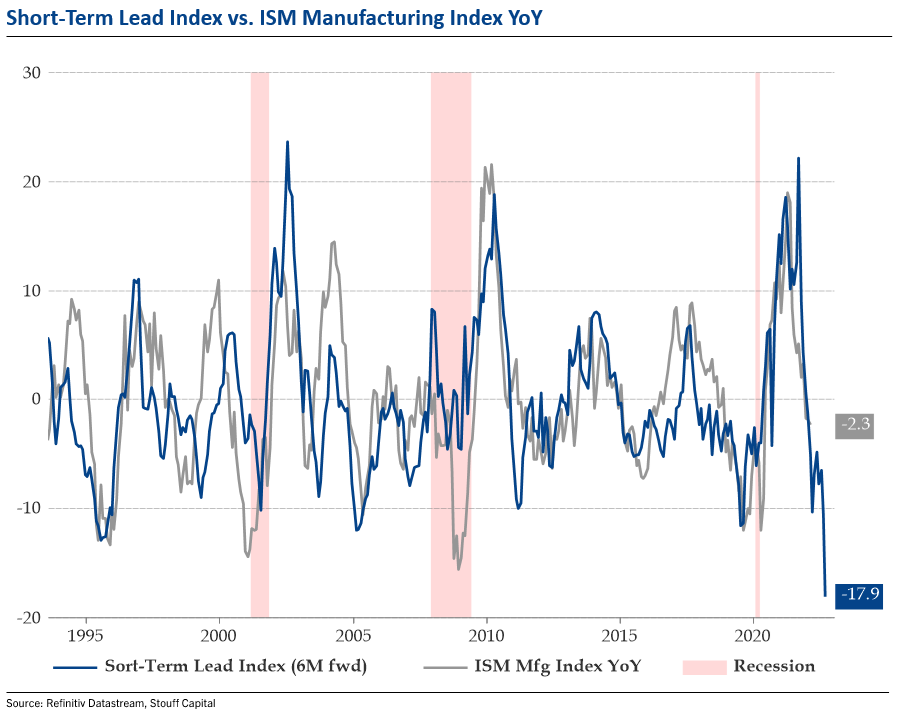
Some of my short-term lead indicators (6 months) are consistent with an 18.8 point drop in the ISM by September 2022… This would target an ISM of 42.6. IF right, that would imply a 100% chance of US recession in 2022. Only 11 times since 1948 has the ISM been lower than 42.6, all but one (May 1952) ending in recession. Lets revisit this next month.
China’s state council has in one move today just:
1) pledged to keep capital markets stable
2) vowed to support overseas stock listings
3) said dialogue with US re ADRs is “good”
4) promised to handle risks for property developers
5) clarified regulation of Big Tech will end soon
Could be a game changer… Unbelievably as well, we managed to recover key long-term support levels… Now needs to hold.
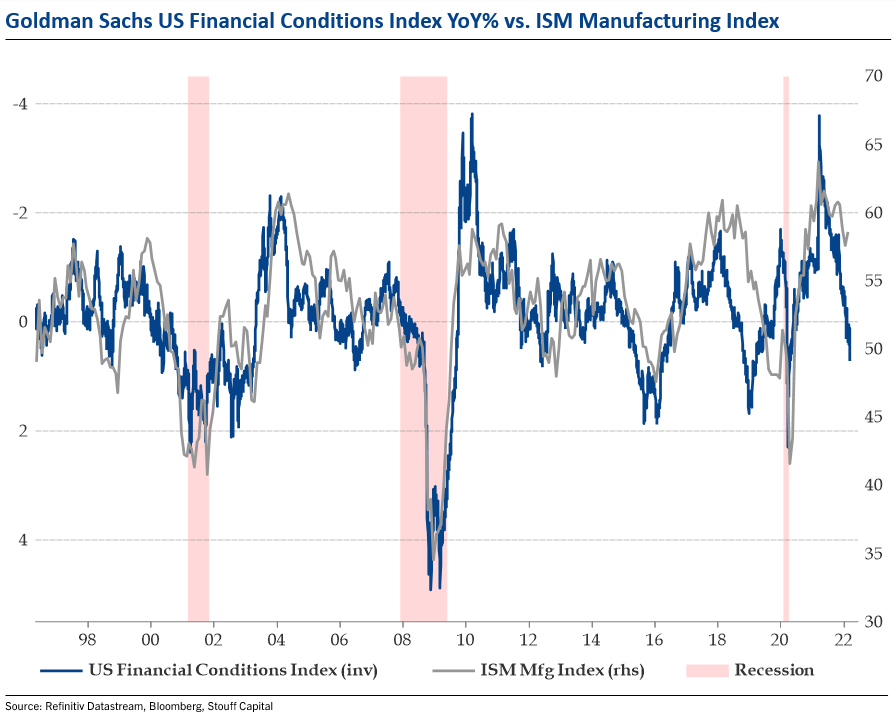
ISM sub-50 reading on the cards? The ISM Manufacturing Index is down 5.1 points off the March 2021 highs… 63.7 then vs. 58.6 in February. Unfortunately, we’re very likely to see more of the same over the next 3-6 months as financial conditions tighten from ultra easy levels last year.
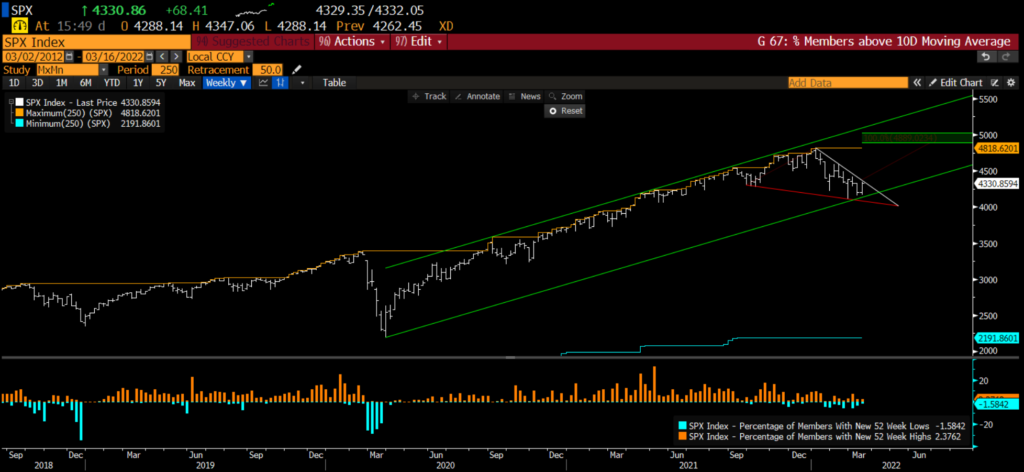
This is the falling wedge that I have my eyes on for SPX within the rising channel off the March 2020 lows. If we breakout it targets a move to 4889.
Technically speaking, FXI made a very impressive recovery of key support over the last 2 days… Let’s see where we close the month.
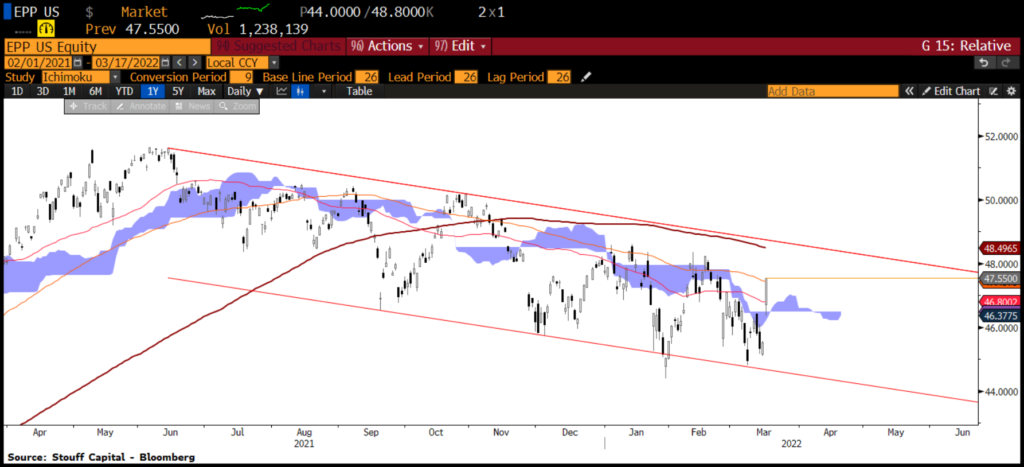
Watching the iShares MSCI Pacific ex-Japan ETF trading within a huge falling channel. Big move took place yesterday. On watch for a breakout.
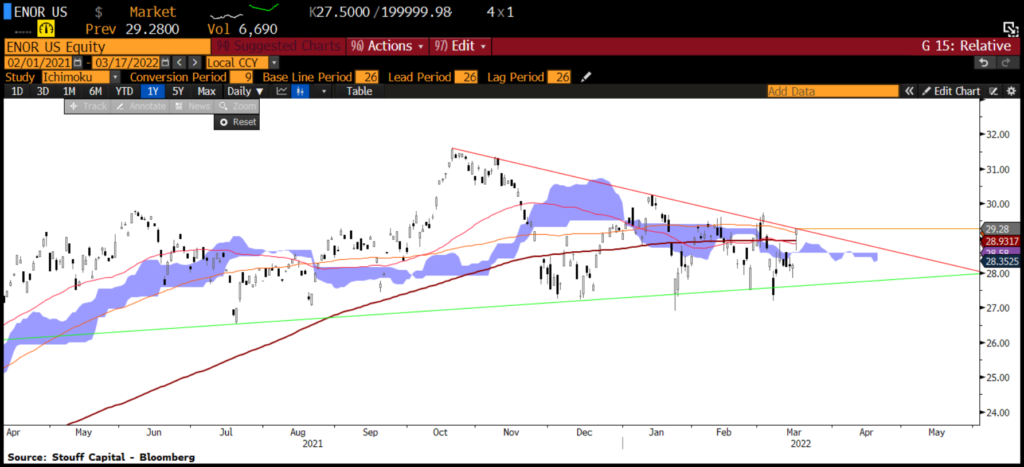
I also have eyes on the iShares MSCI Norway ETF. We could be on the verge of a big breakout. Something to keep an eye on.
Ethereum has been very strong over the last few days versus Bitcoin after having tested the bottom end of the channel range. It looks like we could be in the early stages of a breakout. Let’s see.
Key, key, key levels for the S&P 500 here. Just below the big H&S top neckline and simultaneously tapping falling wedge resistance. Make or break.
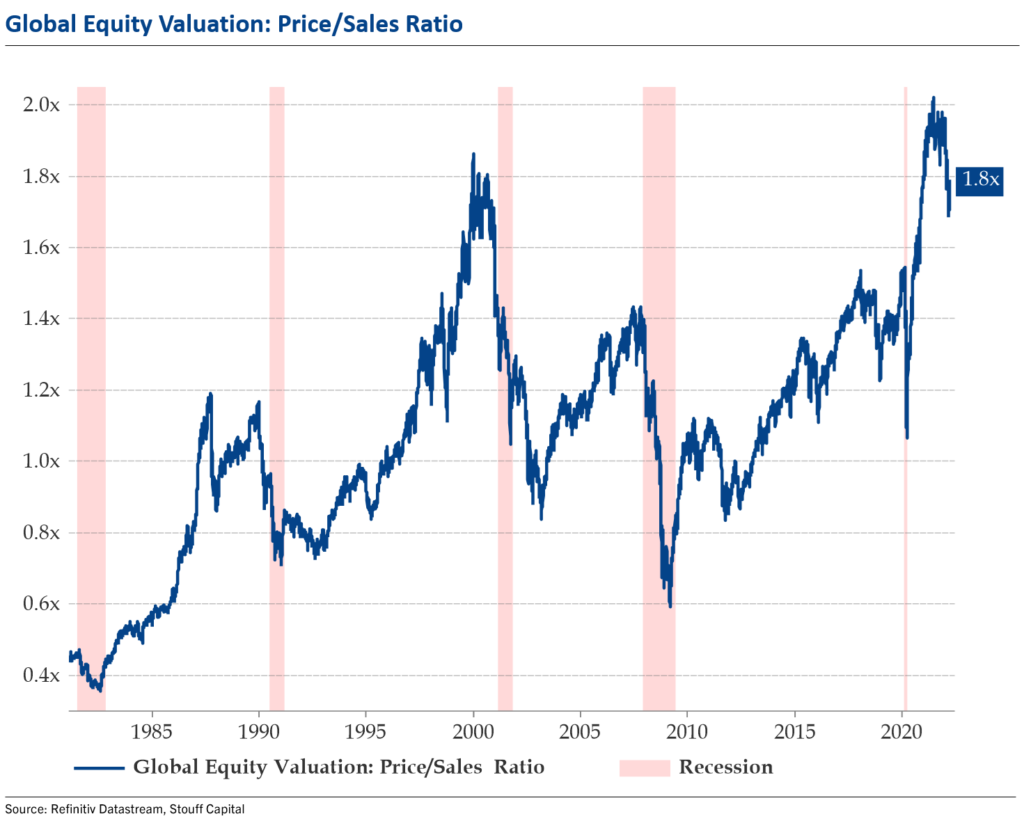
Pretty incredible when you think that globally speaking, we’re trading on a 1.8X P/S ratio which is still the same level as September 2000.
Key support for the dollar is still holding. Sharply higher this morning. Here I am looking at the Bloomberg Dollar Index (BBDXY Index).
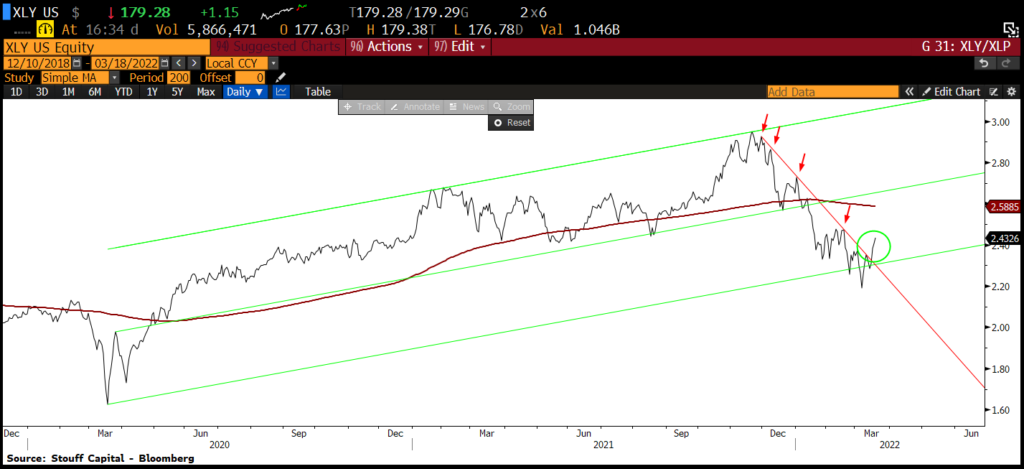
XLY/XLP ratio has broken out from it’s 3 month downtrend which started early December 2021. Good progress being made so far again today.
CHIR up 36% from it’s to the penny implied symmetrical triangle price objective. Incredible… And people say technical analysis doesn’t work…