Stouff letter October 28th – Buy the dips replaced by a sell the rally approach
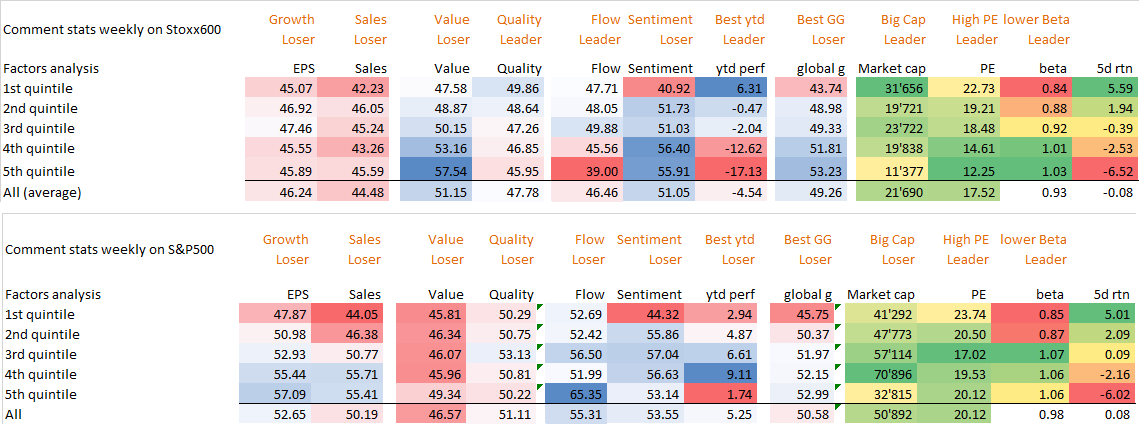
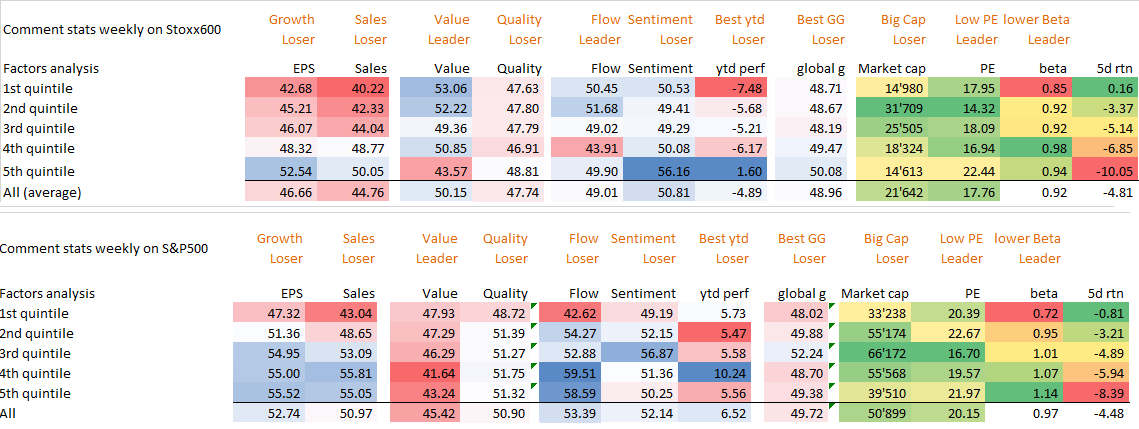
This week again, the stocks with the lowest betas were positive in EU and US. In Europe, others factors like EPS momentum, value, quality were not giving any edge while Smart entiment was wrong. In US, the best ytd performers were winning (certainly the best ytd were not the ones 1 month ago), and Value, eps, sales, sentiment were all losers. A third week in a row shows that only low beta, low vol are the only factors to overweigh. This new trend has been very painful for investors and will not disappear fast.
We believe the environment is shifting from one where dips should be bought to one where rallies should be sold. 2018 could be the year when the market regime has changed and justifying our decision to launch our own hedge fund. This shift in is driven by: 1) QE has ended and global central banks are withdrawing liquidity (as shown in our fixed chart at the top), 2) earnings growth is set to slow from recent tax-cut fueled highs and 3) poor performance and volatility is limiting risk appetite.
Most of our sentiment indicators say that equities should bounce sharply on short covering from current oversold conditions – but going forward these rebounds should be dead-cat bounces. They should be fast, short-lived and should be sold into rather than chased. This is exactly the contrary of the bull market we had from 2013 to 2017 (slow rising market with a few fast sell-off, after which you shloud have bought every dip). Last week, we started to buy a few names to play that bounce (see our alert here). But this is a low conviction call, and we have persistently increased our convexity exposure (rolling our december strangle on the S&P500 to June, buying calls instead of long trades etc…).
Our regional matrix is giving new signals. US is neutral and only Japan stays bullish. EM has improved from bearish to neutral, which justifies the close of our short hedge in EEM.
Stouff letter October 20th – Style is favouring low volatility as market regimes changes
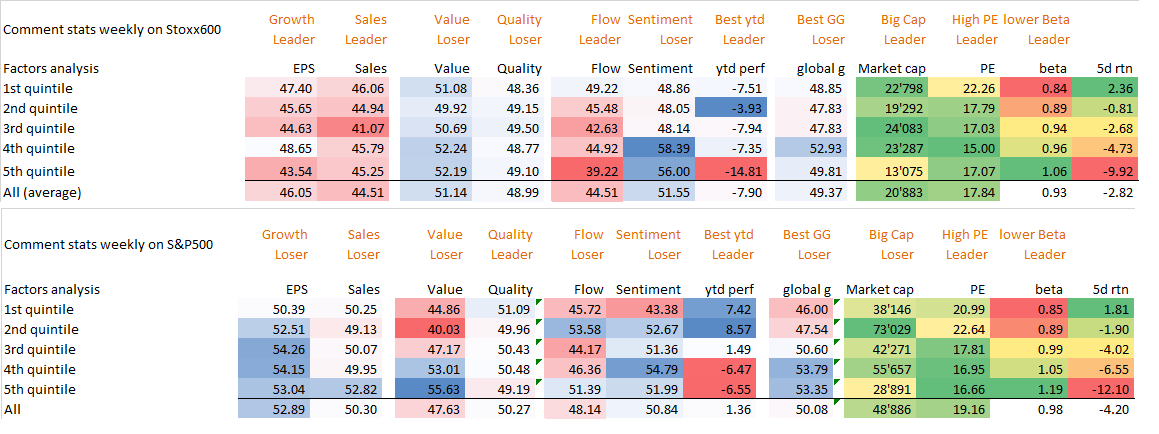
We are adding every week the above tables describing which factors performed. For the second week in a row, In Europe, Quality is leading (justifying that our European quantamental list has added quality names like novartis or Norvo Nordisk) with low beta stocks, while high EPS momentum and Value have under-performed.
In US, low beta, big caps have outperformed High EPS momentum.
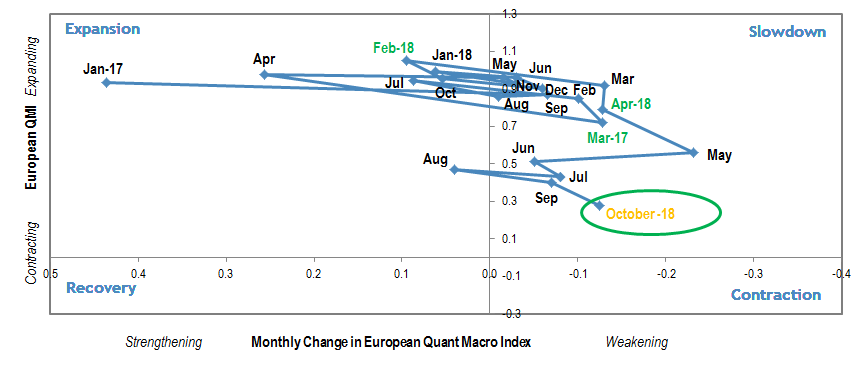
This characterization of factors is in line with our Economics grade which is slowing in most regions. A macro and profit cycle in its last innings makes the regime change from expansion (still US ?, Japan) to slowdown (Europe) or even contraction (Em). In a Slowdown regime, our quantamental lists increase their weight in quality and low vol factor.
We add below a tableau of the best quality names with the lowest realized volatilities that are outperforming the market in the last month:
Then we add this chart which is striking:
The above chart visualizes the 3% decline days in SPX in the past decade. There have been three instances of a 3% move in SPX this year, this is considered to be quite rare. In the past 62 years there have been only 18 years where the market saw three or more days of >3% moves. In terms of 2% or larger moves, this year there have now been 10 days total of 3% or larger moves (in either direction). This is a fact that confirms our conviction that we have entered a new regime and that an absolute return approach is the one to have now.
Stouff letter October 12th – beware of the most bearish month of the year
Before the mini-crash, there are lot of bad signals:
1- Rate-sensitive divergence warning. As yields rise, the Financial sector is badly underperforming Utilities, which is atypical. Historically, there has been a strong positive correlation between rates and the ratio of Financials to Utilities. When a divergence like we’re seeing now has happened before, it was a bad sign for stocks in general
2- • Not yet so bad that it’s good. So many securities on the NYSE are hitting 52-week lows that it’s nearing an extreme, the most since February. But when stocks haven’t sold off much, a rise in new lows like this isn’t a good contrary sign, and forward returns were mostly weak
What’s more, October is technically the month when the world’s major central banks together start running down their bond holdings, the withdrawal of liquidity is being blamed in part for the summer sell-off in emerging markets, the highest 10-year U.S. Treasury yield in seven years and now the biggest drop in stocks since February. Then, The current expansion is now the second oldest in U.S. history and within a year will be the longest, reason enough to question its longevity. Many conditions that preceded previous recessions are present: Unemployment is below 5%, a sign the economy has little unused slack; oil prices are rising; the Fed is tightening; and interest-sensitive home sales have softened. In its semiannual outlook released this week, the I M F said the U.S. economy is already operating above its normal capacity, and the fiscal boost coming from lower taxes and increased spending “could lead to an inflation surprise,” triggering rapid rate increases, global financial turmoil, and a stronger dollar, all bad for global growth. It says Mr. Trump’s higher tariffs, in particular on Chinese imports, and resulting retaliation, could further hurt growth. J.P. Morgan estimates tariffs could tem-porarily boost inflation 0.2 to 0.3 percentage points next year.
But, may be it is not the end of the world yet. Even as they stop, slow or reverse their buying of bonds, the combined balance sheet of the Fed, European Central Bank, Bank of Japan and Bank of England will be just 4 percent smaller by the end of 2020. That means plenty of liquidity left sloshing around the global financial system and supporting the world
So all that leaves us now after a 5 to 10 % sell-off depending on markets, with either a great entry level or the repeat of jan-feb 2018 pattern with a 2600 target. Time will tell… Funds analysis gives a hint as Annuities, CTAs and risk parity still need to sell a few billions ESZ8 before a clean rebound is possible (more details here). A few positive catalysts have also emerged. The S&P went from 52-week high to below its 200-day average in only 3 weeks. That ended a streak of more than six months above its 200-day average. Other times it underwent a quick change in character, from a 52-week high to below its 200-day average in fewer than 30 days, led to generally good return. Finally, we respected our regional matrix by adding 5% in US stocks as they have become oversold in price and sentiment. We have increased our net exposure from 5 to 10% during the sell-off to a range of 15 to 25% by adding 5 % in low vol stocks in US, by adding 3 % in Japan, and closing some of our short exposures in europe. We are also hedging our long volatilty which has been very useful in this mini-crash with Vix back above 22 (3 highest spike of vix this year) with the purchase of put on Vix: this strategy creates a convex outcome: we still benefit from an explosion of the vol through our long put on index and stocks but are hedged in case of a rebound of stocks and resulting crashing vols.
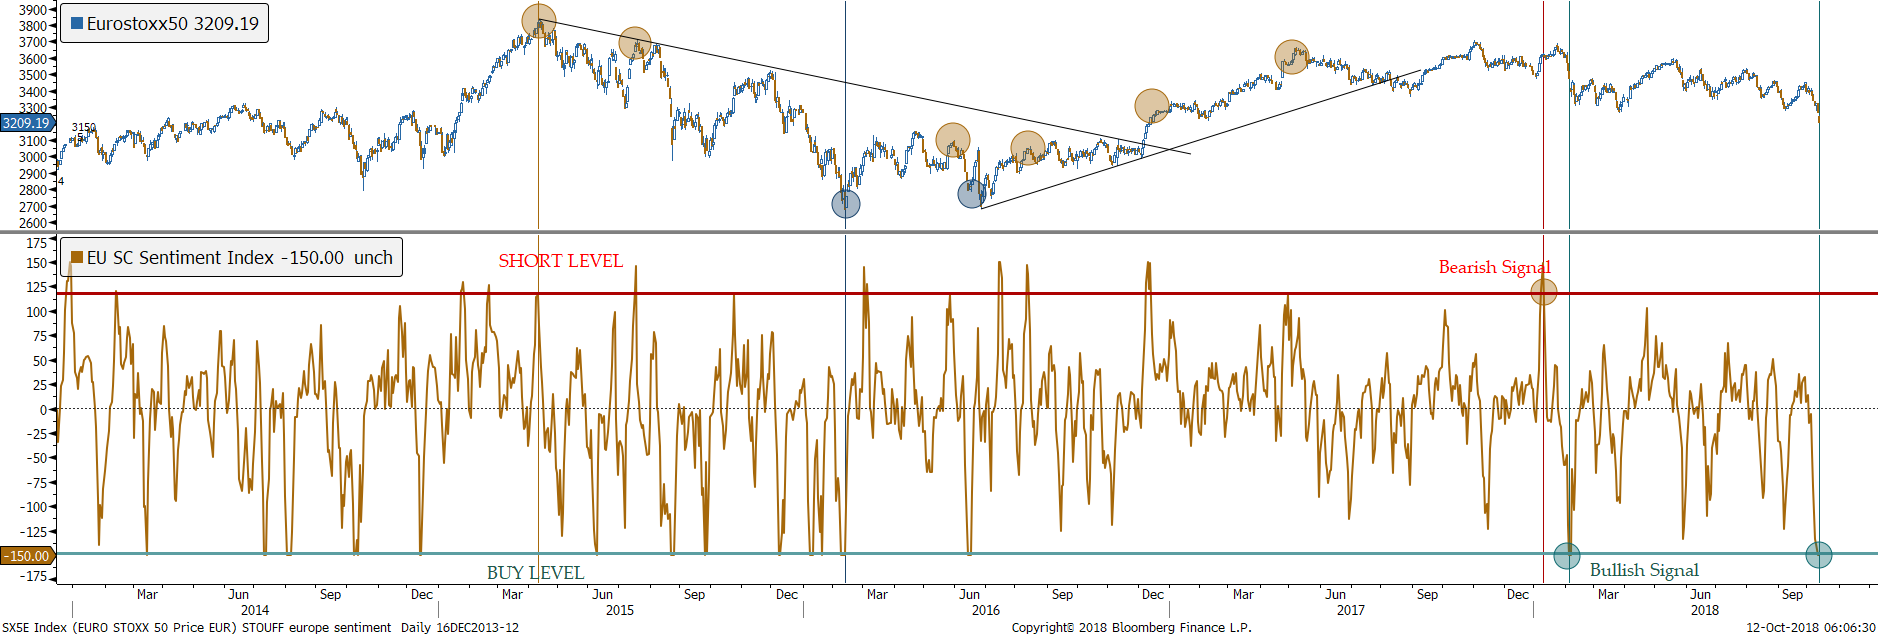
On the sentiment front, our SC European sentiment indicator has given a clear buy contrarian buy signal, the first one since February (chart below). In the US, our smart-dumb money made a u-turn and is near a contrarian buying signal.
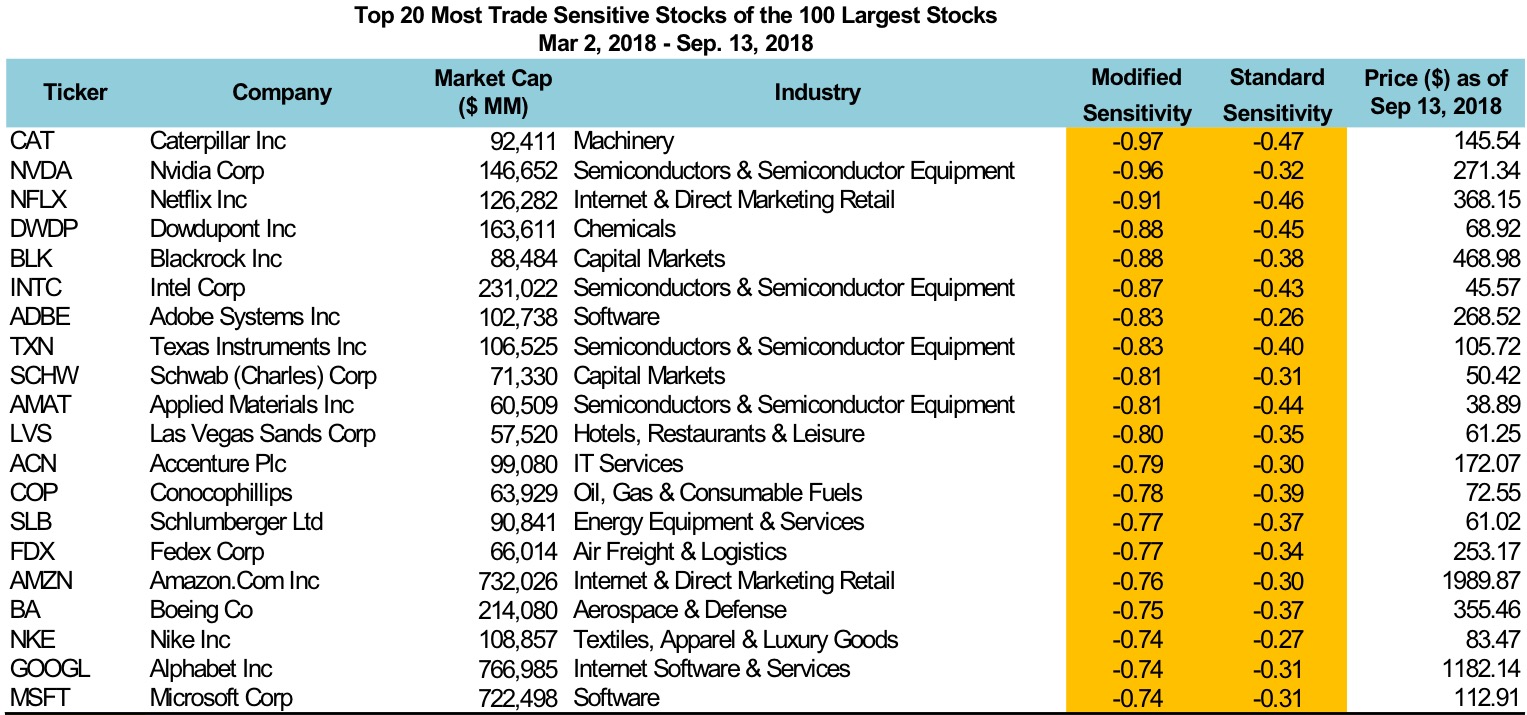
We believe there is a buying opportunity here, but this mini-crashes tend to respect a regular pattern – strong down leg 1 (we could be ending this one) – dead cat rebound to 2825-2860 – then retest of just a higher low like 2775. In this second leg sell-off, we will know if february 2018 pattern is respected with a lower target at 2600. Thus, we would initiate some new shorts if the dead cat rebound materialzes. On the short side, we consider the following US names specifically hurt by trade wars and with the worst earnings momentum. We are using our machine learning tool to scrutinize companies mentionning trade wars as a threat in their earnings transcripts.