Stouff letter 13 – November 30 – Two out of Three
The positive divergence we mentioned last week between the S&P at its 6-month low, and fewer & fewer of its individual stocks at their lows, was at posteriori predictive of the reversal. From a fundamental point of view, two out of the three headwinds for the market weakened: the Fed did finally listen to the market with a more dovish stance. We think this is the most important factor going forward: so that is definitely a strong positive news : finally. Then, this week-end, China and the U.S. agreed to a cease-fire in their trade war, with the U.S. postponing plans to increase tariffs on $200 billion in Chinese goods.We are now expecting the last headwind – oil bear market – to be addressed this week. These positive developments should enable the usual end of the year rally, fueled by under-invested active managers and hedge funds.
November has been a complicated month even for many active mangers. Fortunately, it has been a good one for our tactical approach. While the MSCI is up 1%, we double that performance, with a market neutral approach (from -20% (when markets high) to 40% (when markets low … I know most participants prefer to do the contrary). We repeat it: this a trading market, whose moves are amplified by the hord of quants. I cite one of my heroes , Leon Cooperman , whom (for the little story) I met with my boss and partner a few years ago, when I was a strategist at Pictet, without letting me speak , he made a very bullish speech for fifteen minutes , after which my beloved boss humbly interrupted by saying “you know Julien thinks like you”, he abruptly glared at me with his falcon eyes and said ” you know this guy is a genious”. While feeling a bit ridiculous, we all laugh. This fatetious hedge fund legend hero often complains that quants , algos, IA, machine learning have become a headwind for slower human investors, if not an abuse (fake social media posts and headlines). They have nurtured “confusion” in the market micro-structure, by taking advantage of the liquidity and by shorting the reaction time to news. In fact, for more traditional investors, the question is how to protect yourself from these “thugs” ? We see two ways to be insulated from them and even to benefit from. First, become them, by adding a quantamental tilt to your Human, Fundamental, subjective, gut feeling approach; then, set-up articulated long term convexity hedges to benefit from inevitable mini-crashs or apparently unintelligible unravel of correlated assets, triggered by the deleveraging of their complex positions.
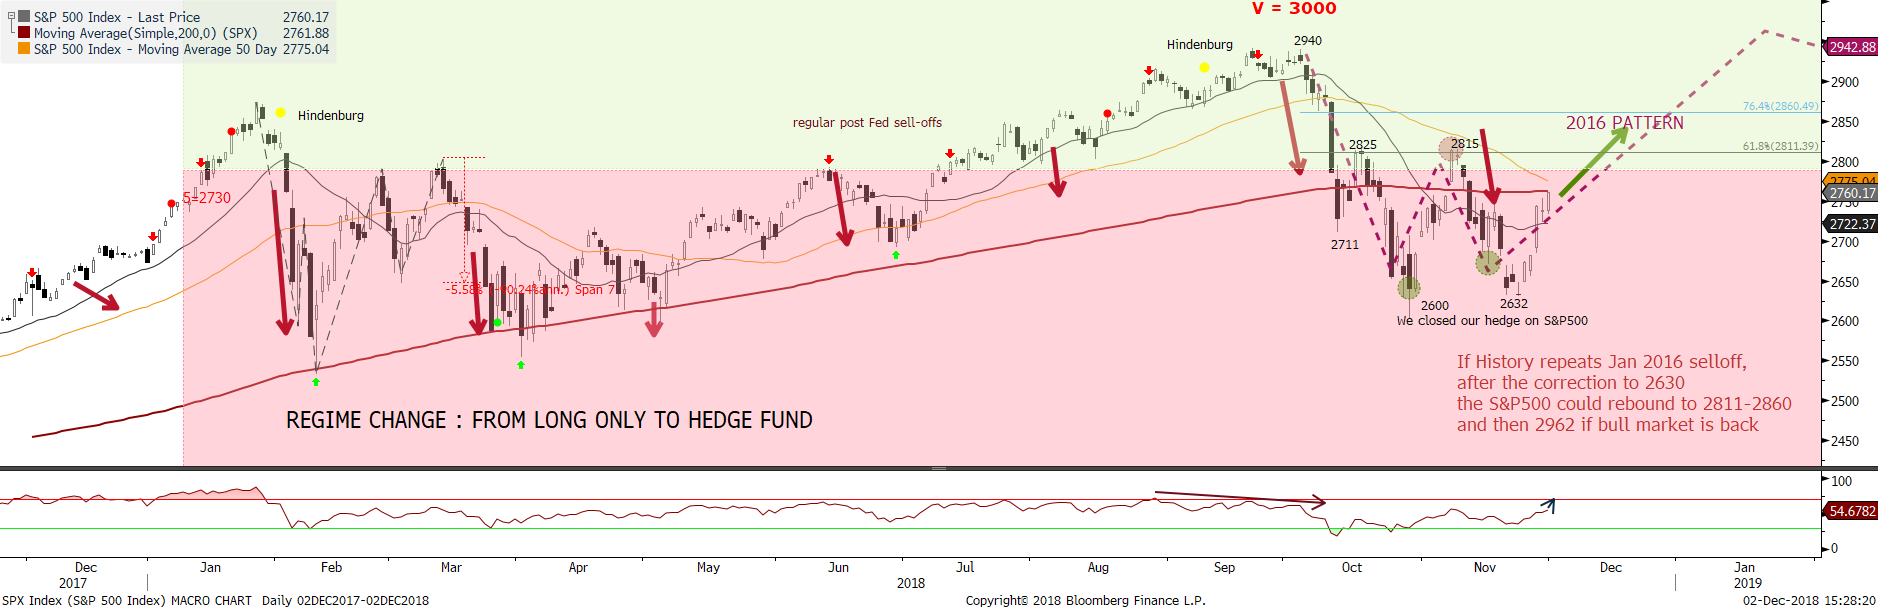
This is what we work on, religiously, through our hedge fund Urizen. Let me give you some examples: while being an option trader, we were identifying for which strikes the market makers’ short & long gamma exposures were the most concentrated: if on expiration time, an index or a stock was near a strike around which actors were long gamma, you knew the stock will end at that price, to the contrary big open interest where market makers were short gamma could be risk zones to be crossed at the speed of the sound. This strategy still works for us and produces all the more alphas that expirations dates have increased from monthly to weekly and even every today for the S&P500. With the cohort of quants, we have srutinized the relationship between price and the structuring of complex positions from quants, risk-parity, hedge funds to anticipate very short term moves. Right now, the 2 goods news (the Fed and the china-US trade war truce) associated with the lowest exposure from hedgies in equities should create a year of the end rally with the possible following scenario shown in the below charts (we will use the S&P500 and DAX for instances):
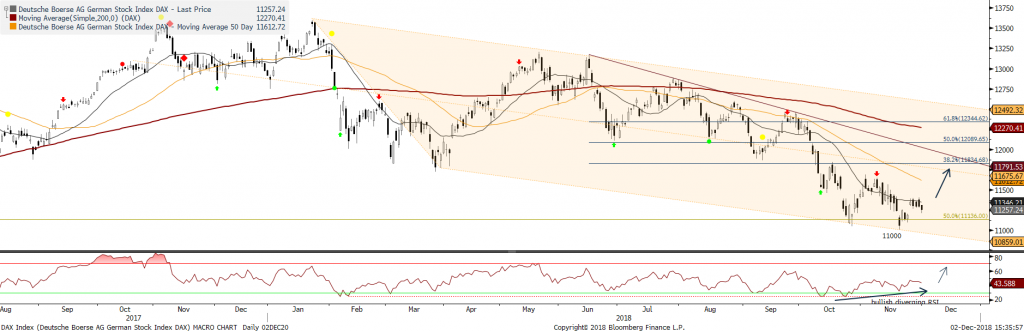
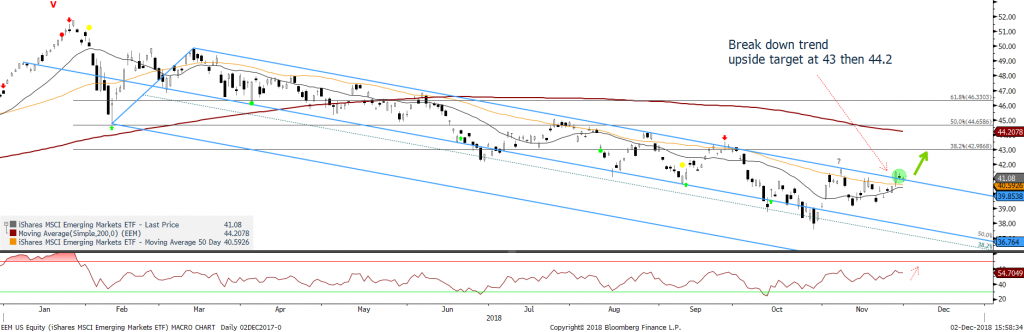
In terms of regional allocation and Forex anticipations, we favor a lower dollar through our long Euro/dollar, and in line with our regional matrix (see here … we added a short term grade to adjust to a fast market), we are overweight Emerging Equities (down trend broken see below right hand chart) with a first target at 43. Europe stays structurally bearish (below left-hand chart for the DAX), this is why we prefer a long convexity exposure on Eurostoxx50 instead of direct equity exposure. In US, we have recently added long exposures in technology (Panw, Box, Biotech) to bet on a tactical bounce. In our US SC quantamental portfolio, our algos have reduced the weight of low vol from 40% to 20% in favour of EPS momentum and sales momentum (both at 25%). Indeed market corrections in February and October favoured low vol and bets in terms of style, but it resulted in extreme valuation between defensive (Low Vol / Quality) and cyclical (Value / Growth) stocks. Better news on the Fed and trade wars should deflate that spread and justifies a tactical switch towards growth, cyclical, high beta & small caps for a year-end rally.
But do not believe we have become perma-bulls again. Once this Dead Tiger cat bounce slows down (we take start of January as Time target), our bearish mind will come back, all fresh for 2019.
Stouff letter 12 – November 26 – 2016 or 2011?
A little word on the week: a 2% drop in global equities, with one of the worst single-session losses since 2015 and the S&P 500 erasing its gain for 2018, Oil’s 11% plunge, the worst streak of declines since 2014 of junk bonds.
The fact that we haven’t seen a sticking bounce comes from the fact that Hedgies & active managers have performed so badly that they are not ready to chase any year of the end rally (their net exposure is back to 5 years low). For the last 8 weeks, we have argued that rallies should be sold into and that ‘buy the dip’ is a dead proposal, as fundamentals have deteriorated – lower earnings in 2019 imply a de-rating of P/E. This is why, while near-term price action argues for a tactical bounce, it only shows the market is exploring where prices should be. A reversal would only come from a rebound of technology and more specifically Apple. We all know that coca-cola, Philip Morris and Eli Lilly cannot be more than temporary leaders. The breadth is also confirming that the continued blood bath is driven more and more by less names – indeed the breath is diverging – there are less and less names falling more than the index. At least that is a small positive… and we can also hope about the coming G20 ?
Indeed, the current tightening of financial conditions feels a lot like January 2016, with the Fed too tight, a strong dollar, a weak Yuan, hammered stocks, and oil telling us we enter a global recession. But in 2016 the G-20 met and these tightening conditions reversed almost immediately. Could a Trump/Xi deal make history ryhme ? Unfortunately, we doubt it as neither leader wants a deal, and the sub-level negotiations go nowhere. We prefer to compare the current period with 2011 with all its more negative consequences, when Boehner and Reid, made the Supercommittee failed, which by ricochet led to the fiscal cliff and sequestration. On our side, we are ready for another summer 2011 by employing convexity as to benefit on the upside and being able to survive if the downside materializes, with the right calibration of bets adapted to a bear market.
This is also the time of the year when strategists make their nostradamus forecasts for 2019, whose manifest consensuality relies on extrapolating the current year trends, with one or two personal touchs ( the famous “touche personnelle” of the cult French movie “les bronzés font du ski”). In a nutshell, they expect low returns for the coming years, with lower growth and higher inflation. However, one “touche personnelle” strikes me, the one from JPMorgan on a significative DM Bond bear market in 2019. This should create a persistant trend in one factor, leverage or strong/weak balance sheet. Another factor is making a rise on the best performing factors: dividend yield. Dividend stocks are becoming an oasis in this nascent bear market with the S&P 500’s dividend yield just shy of the fed funds above 2%. In the past years, dividend but mostly stock buybacks (currently running at more than $800 billion) were a tailwind as companies, purchasing their own shares, demonstrated confidence in the business going forward. We believe the change of market regime should now favour companies who can hold higher stable growing dividends but not through a leverage of the balance sheet. Beware of what drove the market higher before: cheap debt, share buybacks and dividends may be replaced by deleveraging of debt (coping with rising corporate rates), triggering less buybacks and dividend increase. The companies demonstrating the capacity to rise dividends away from more debt should be rewarded.
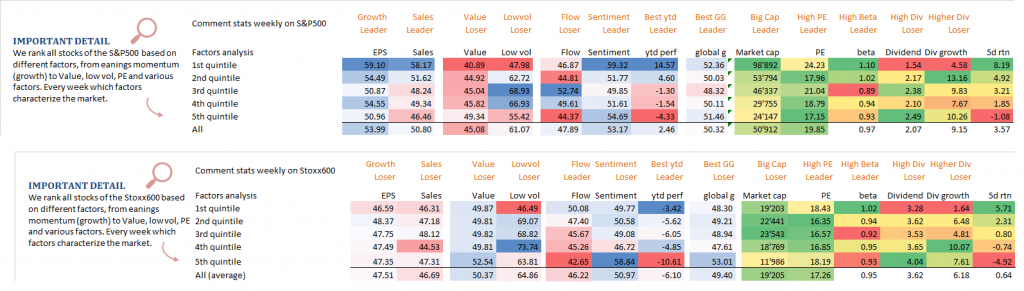
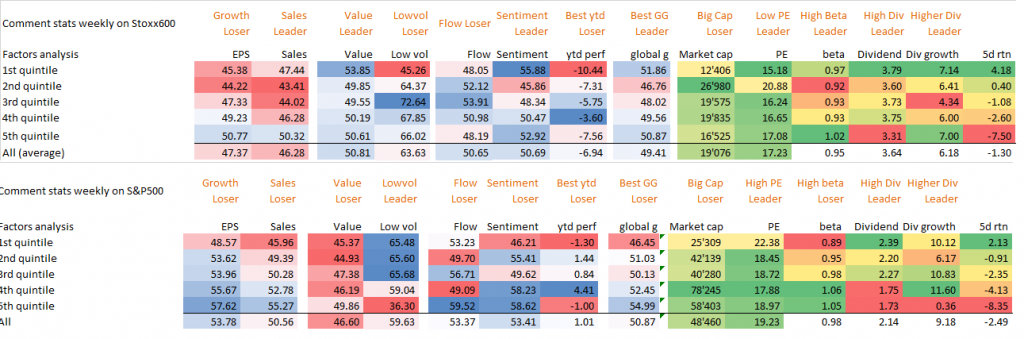
Our quantamental portfolios have been increasing the weight of dividend growth stocks. So, in the coming weeks, we still expect a leadership from Dividend growth stocks, followed by stocks with strong forecast earnings and sales and companies with the lowest leverages. Our weekly table of aggregate return per factors just confirms this evolving trend: not one factor except dividend and dividend growth has a leadership in Europe and US.
Stouff letter 11 –
november 19th: we love the new normal …
My first mentor used to say that the market follows a path that hurts the maximum number of investors. This narcissistic perverse manipulator (the market not my mentor … though 🧐) has been excelling this past week. Willing to squeeze any consensusual position, Brexit and US-China trade wars’ headlines were the catalysts for all these contrarian incessant contra intraday moves. Sincerely our quantamental contrarian mindset loves it: since the start of the crisis, our strategy has produced 700 trades per day , instead of a mere 25 to 50 during the QE era (fortunately we only communicate our main conviction trades to you), and contributing 250 bps alpha.
Stouff letter 11 – November 17th – sadly to say … we love the new normal …
Thursday was a perfect example of the current market volatility with headlines suggesting that the January tariff hike was on hold and (en même temps) going ahead as planned (Wilbur Ross). You have to be quick and certainly a market nerd like we are to extract a few pennies instead of bleeding . Gregory Chevalley , our Quant responsible has created very fast and efficient algos that benefit from this environment. Without revealing the secret sauce, these algos split into two market categories for intra-day moves (very very intraday … a few seconds sometimes) : mini trend, and mini-reversal or range trading. It creates thousands of ‘bracket’ orders around our core exposures (with inherent stop and target profit, one cancelling the other).
Apart from this new market regime, we must confess that our bearishness has been somehow eased by, FINALLY, a Fed recognizing that it should pause next year. While Powell still remains upbeat on the U.S. economy, he and R. Clarida mentions the ‘slowing growth’ abroad: they are certainly not as fast as the market … still not using IA ? Indeed, there is now a confirmation that 3Q GDP growth turned negative in the Germany and Japan, while the latest credit data out of China was the worst in many years.
Another positive is that valuation has strongly derated (see our regional matrix), and this creates a cushion for coming earnings recession and economic deceleration.
This is why we believe the most important now is to identify which factors to favour. Last week Nvidia sell-off is a reminder of the danger of holding growth cyclicals in this new bear market (we are long only through hedged optionality on all high growth cyclical names). The change of regime has modified the weight of factors in our quantamental SC stocks’ selection. From fast-growing companies, they now prefer stocks with more stable profit growth and higher dividends, the kind of stocks that for years had taken a back seat.
Stouff letter 10 – November 10th –
Good is Bad
The political gridlock is considered as a positive outcome for markets and most expect the usual end of the year rally. We are dubious of that. First, as we analyze in our mid-terms section, there is a deadline on the 7th december for the debt ceiling.
Then, strong growth, more borrowing and less dovish Fed commentary have pushed US real rates higher and triggered the October’s sell-off. The gridlock will not change that. We believe we have entered a period for US where Good is Bad. What’s more, any asset allocator adopting the ‘traditional’ 60/40 equity/bond split is facing one of the highest combined valuation levels (87th percentile) since 1900 … and the mirror opposite of the early 1980s, which marked the start of a long-term bull market in most assets. Oil, China and the Fed are the key macro factors to monitor. A return to a bull market relies on 3 ameliorations 1) a Fed pause in 2019, 2) a U.S./China trade deal & China stimulus, and 3) oil prices remaining stable.
In the U.S., “second-derivative” concerns (slowing growth) have simply not been enough for a Fed pause yet. The Nov FOMC statement was slightly hawkish, given that it did not include reference to additional weakening in recent U.S. housing data. What recent history tells us: The Fed tightened in Dec 2015 and predicted 4 more hikes were possible in 2016. Market volatility (oil falling to $26, China “hard landing” fears) led to just 1 hike later in that year. But it took a lot of equity market pain in early 2016 first. Out of that period, we saw China stimulus (the so-called “Shanghai accord”), OPEC action in 2016, and a slower Fed. That set the stage for a significant equity market rally in 2017/18.
As we do not have these 3 ameliorations, we are very cautious for the end of the year rally for US equities. Our matrix is negative on US stocks, with overweight on defensive like staples or health-care. On one side, there are the positive shares buybacks, very bullish seasonality (the third year under a US republican president is the most bullish), lower valuation but offset by the quantitative tightening, trade wars, debt ceiling, Iran sanctions. We think the S&P500 will find it difficult to break 2850 on the upside and should range between 2700 and 2800 until the end of the year (at best). If 2700-2650 breaks, a fast bad trip to 2400 will be done.
For other regions, Good could be good. as the Economist said, we are looking for a top in US and waiting for a trough in China. Europe could rebound from its recent economic deceleration. As suggested by our regional matrix, emerging equities are less bearish than they were 2 months ago, thanks to attractive valuation and too negative sentiment. as we mentioned in our previous letters, the gap between us and the rest of the world is too big to ignore. We are playing convergence here with a few trades:
- We closed our hedges in Eem
- we initiated a long Dax/ short eurostoxx50 to play an intrinsic rebound of germany and the opinion that auto sell-off is now well in the price. A truce in the US-China trade war should favour specifically global autos, the Dax, Chinese stocks .
- we re-initiated a short in S&P500 and a long in Vix futures believing and we seem to be right that the index should fall from 2825-2850 after a short term sentiment sell signal (click here to visualize the chart of our US SC sentiment indicator flashing red on Thursday 08th November).
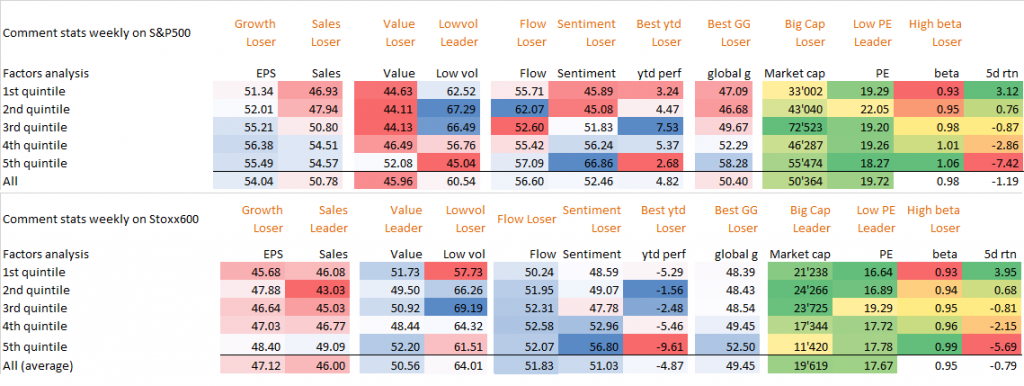
Annex: factors for the week of November 5th to 9th
———————————————————————————————————–
Stouff letter 9 – November 3rd – The trader is back
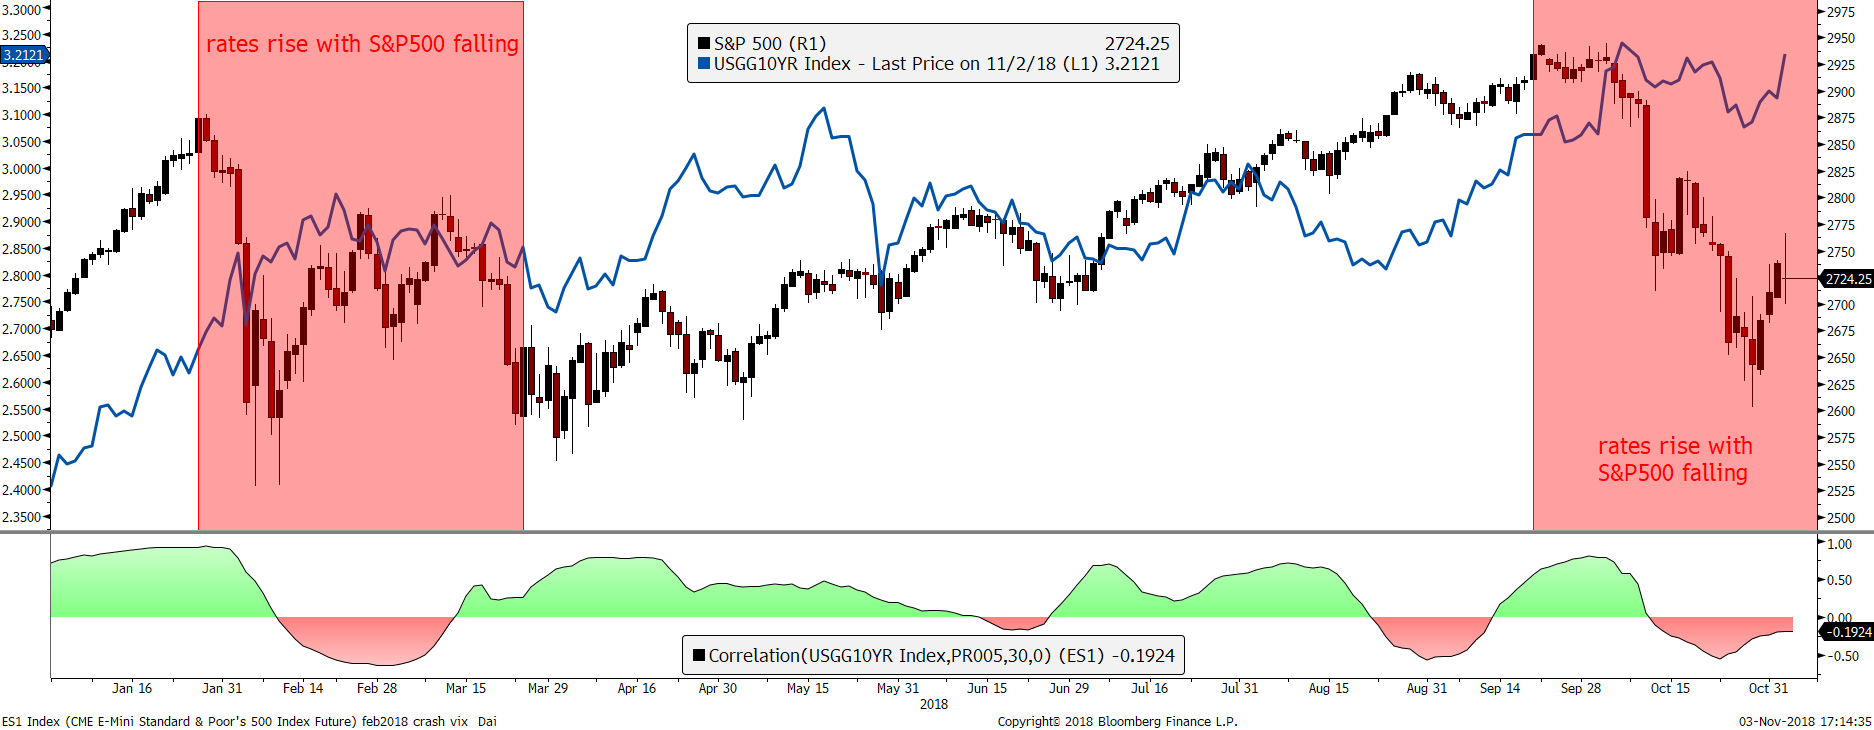
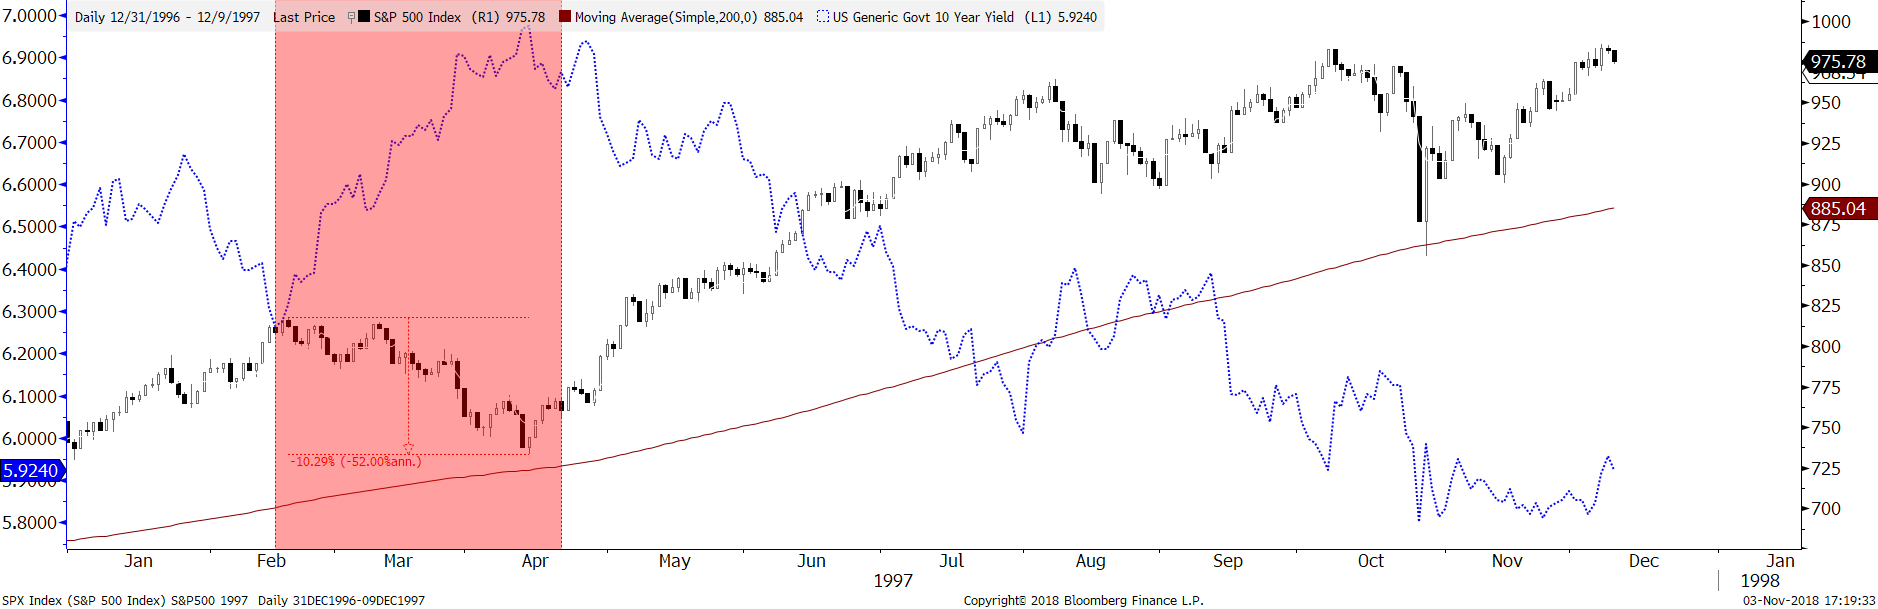
Bonds sold off along with stocks during the last two big pullbacks this year, showing no flight to safety (see chart above with rates in blue). That is unlike 2016 when bonds rose as stocks declined.Why ? The rise in interest rates above the 3.1-3.25 % range put US equities in overvalued territory compared to bonds. While overvaluation itself is a not the sufficient cause for stocks to correct, it adds a new headwind to the cohort of existing headwinds: trade wars, economic and earnings peaks, coming margin compression owing to higher costs (wages increases, higher import & transport costs …), us midterm elections, italexit, brexitremain.
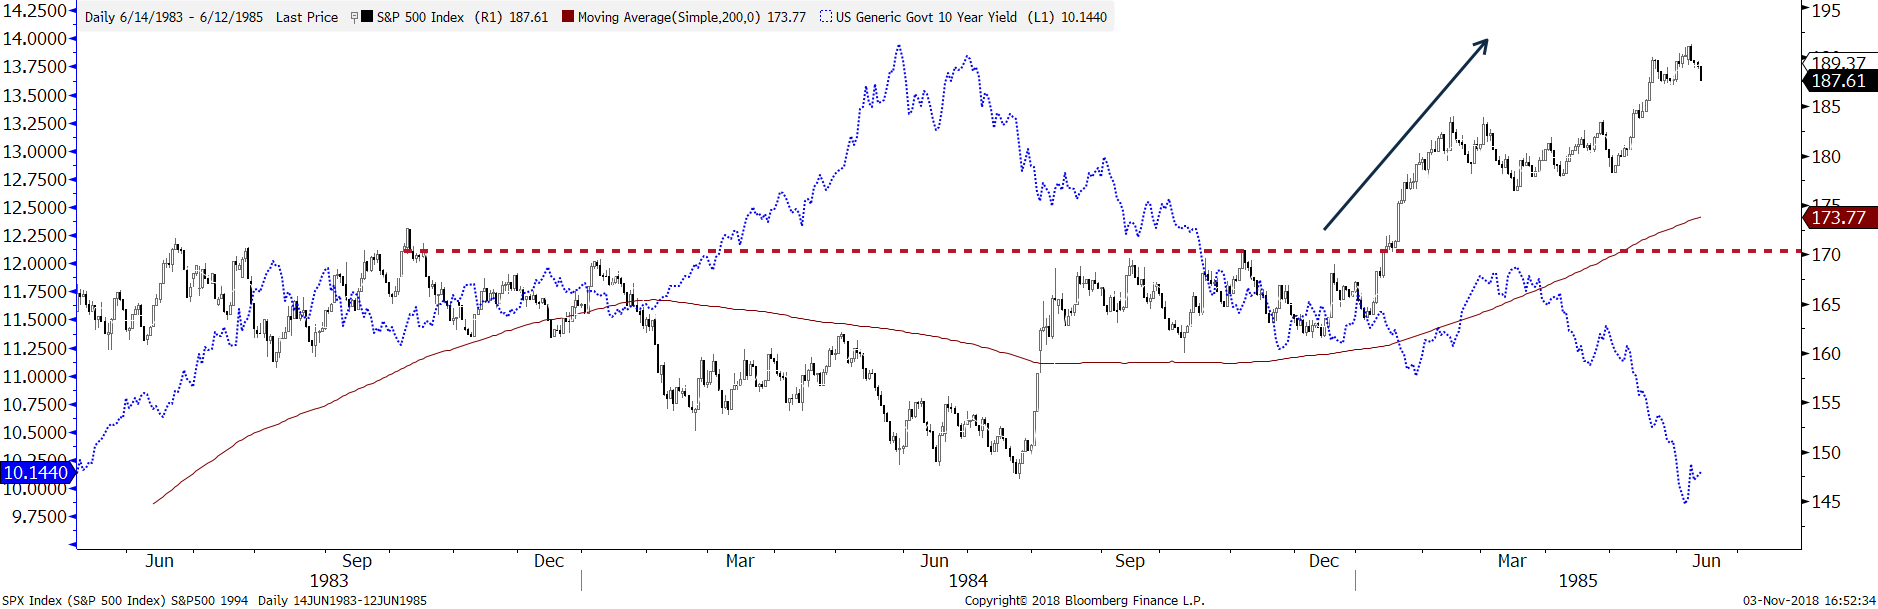
We are looking for past occurrences to get a clue of what could come next: first we found 1984 with the S&P500 losing 15% during a strong rise of us 10 year rates – it took him 16 months to recoup its loss:
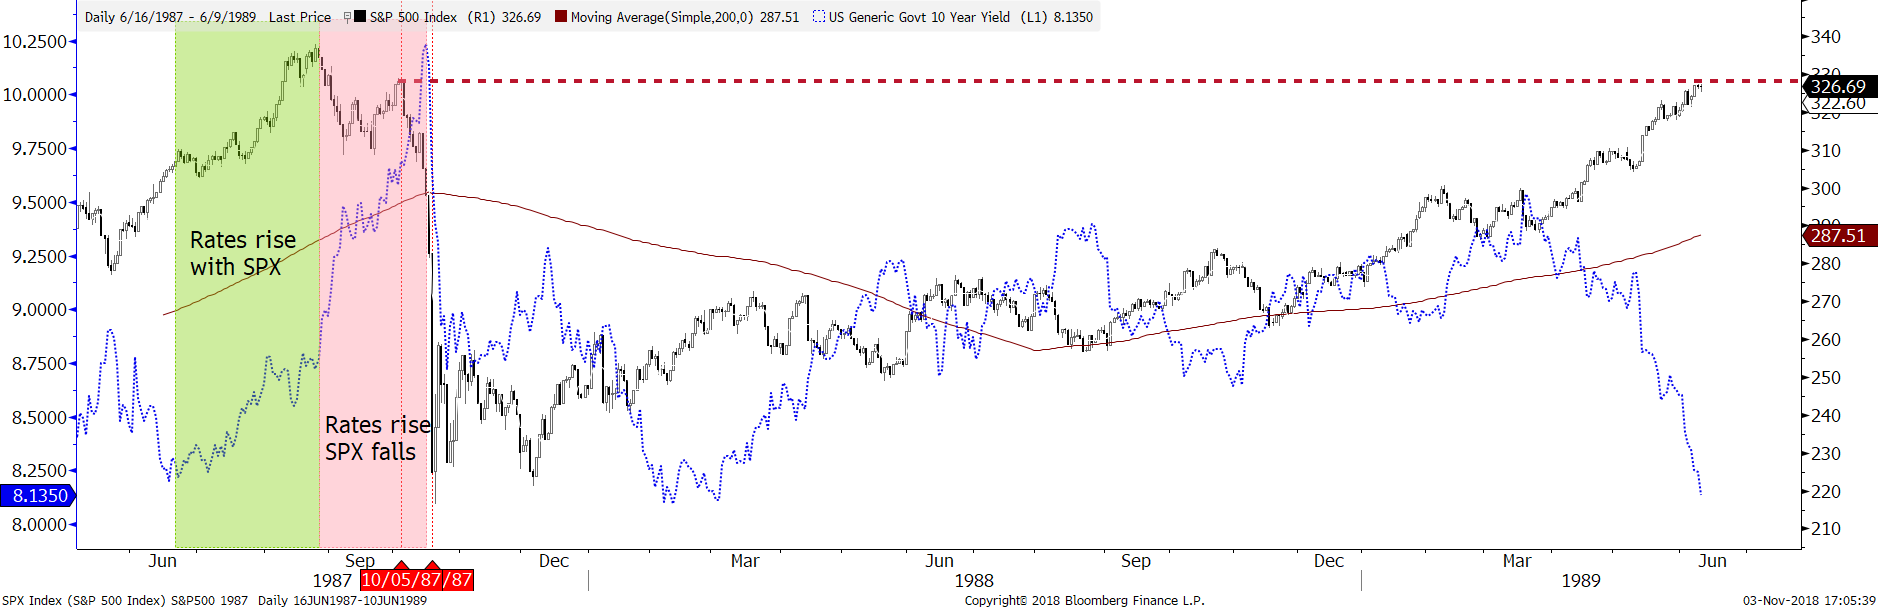
Then, there is unfortunately 1987 with a 36% sell-off in the S&P500. The index recouped its loss 2 years after
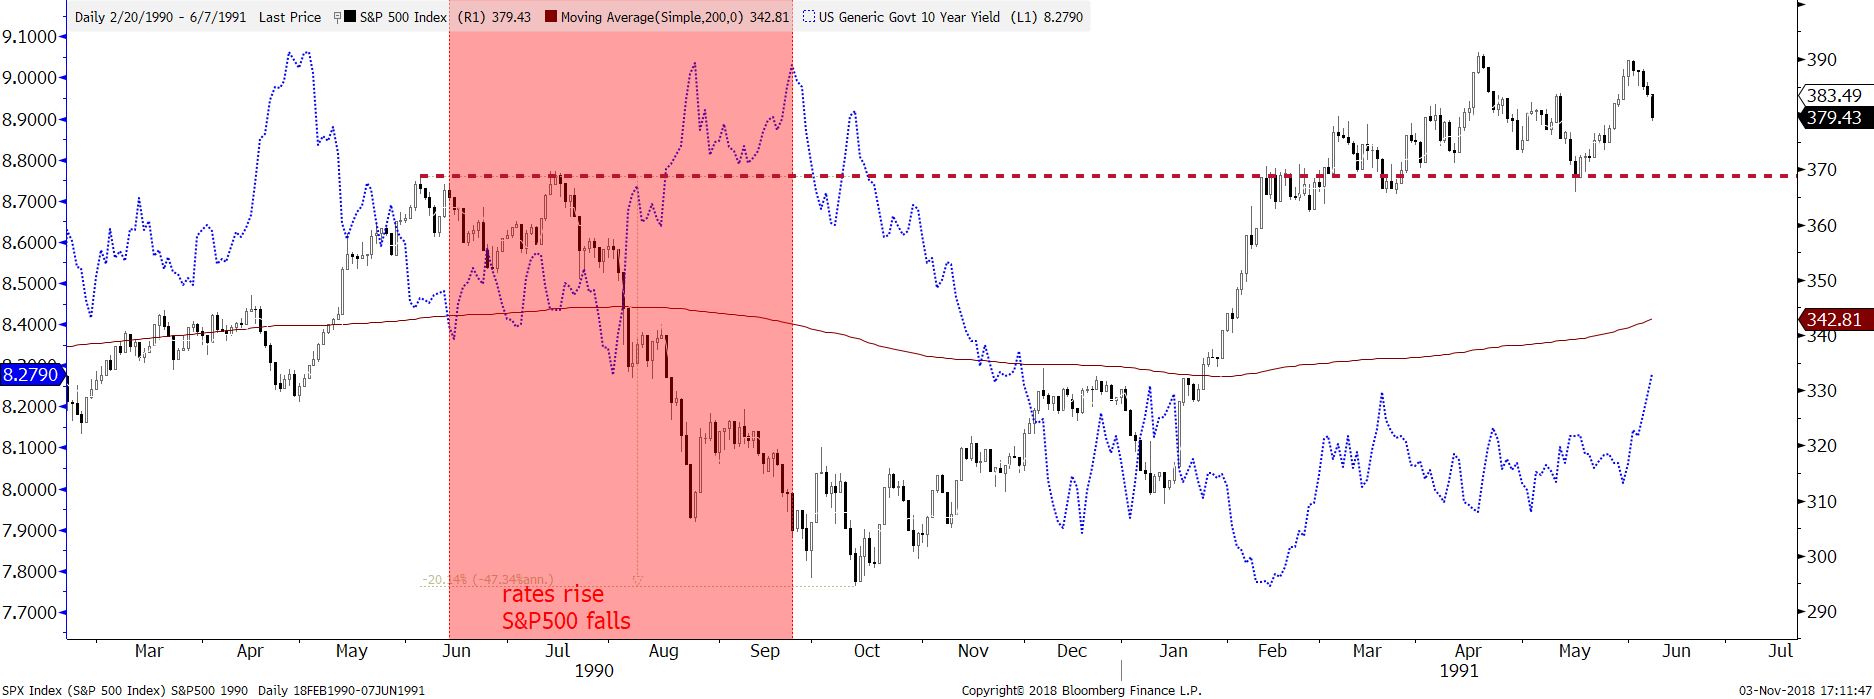
In 1990, the S&P500 lost 20% while rates rising- But it was back to its high watermark 6 months after.
In 1997, the S&P500 lost 10% while rates rose. but immediately rebounded once rates topped at 7%.
So what do we conclude from all these examples: stocks always rebounded when the crash was linked to higher rates, but of course there was 1987 in the statistics and much bigger losses such as 20% for other periods.
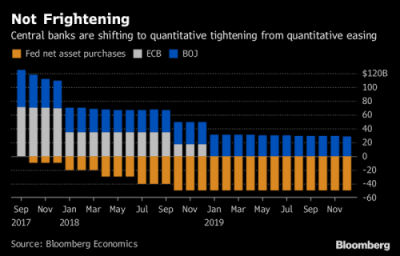
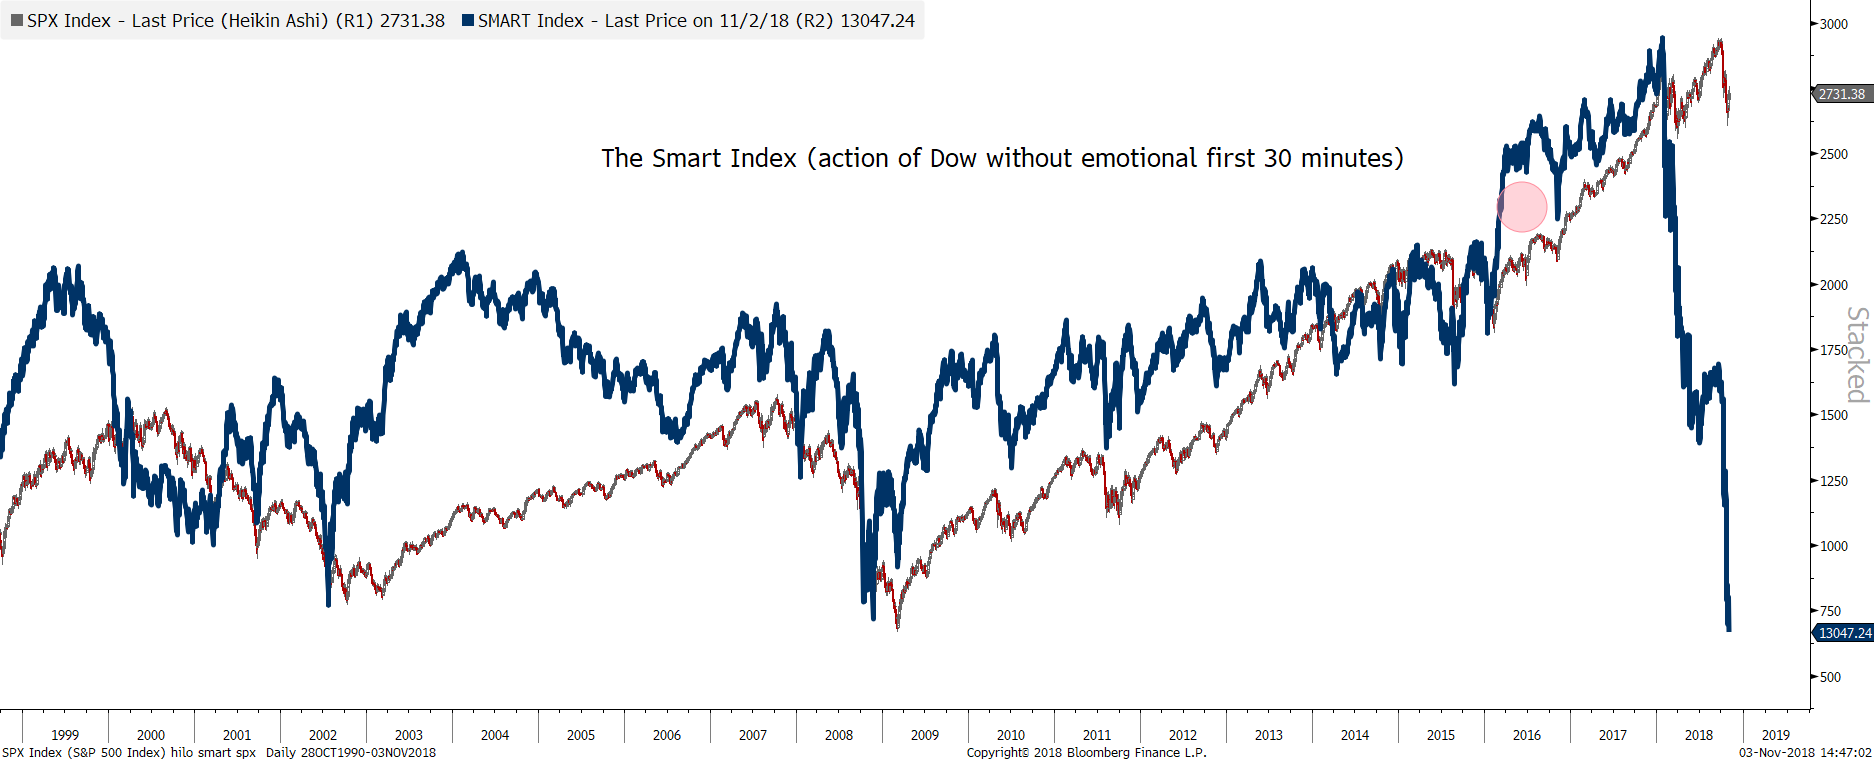
As we wrote last week while closing our short on the S&P500 at 2650, we expect a 2-12 week rebound. But the buying hasn’t been very broad-based and there still hasn’t been a real thrust in breadth. What’s more, as shown on the chart below, our smart indicator (which gets rid of the first thirty minutes when the dumb investors buy at the open) has crashed and gives a very ugly forecast of expected returns for the S&P500, That’s a longer-term issue and helps strengthen the argument that what we’re seeing is a simple dead-cat bounce from panic sellers. Most of our indicators suggested a short- to medium-term rebound, and even during bear markets,that’s usually what we get. Even if we ultimately roll over into a bear market (and We think that’s increasingly likely), we should continue to see prices work higher into the new year. Then, it will be time to re-focus on the growth deceleration in 2019 for GDP and earnings, and the QT (see our major chart which we keep constantly at the top of this page) or the shrinking liquidity from the Fed’s ongoing balance sheet reduction and the ECB’s tapering.
But our motto is that the trader is back: welcome to the decade of the slow death of the QE driven long only investing style in stocks and bonds…
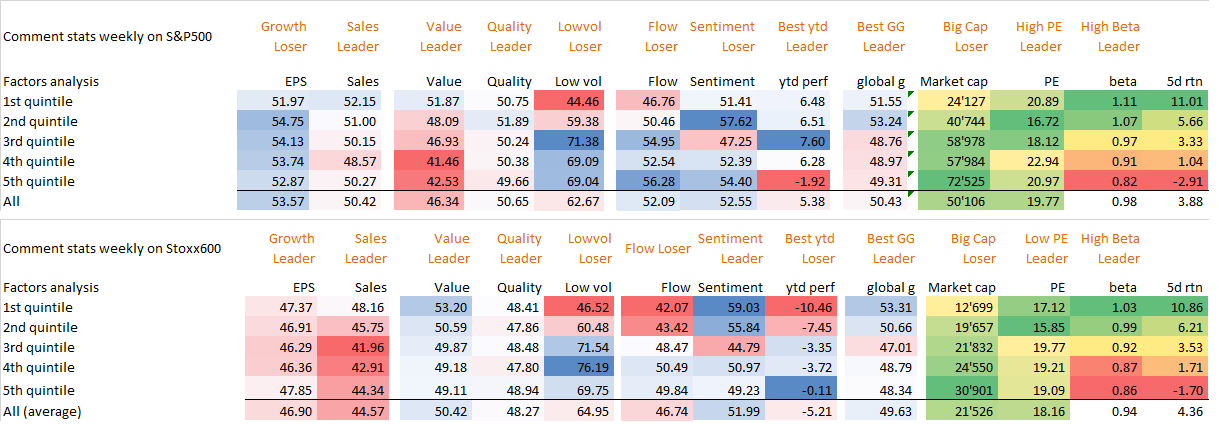
Annex: weekly update of factors
Last week rebound was characterized by the outperformance of value, small caps, high vol, high-short-interest, high beta stocks as shown in our weekly table of factors. What I find new is the outperformance of stocks with best sales momentum, which could be immune to coming margin compression.

Parodos: Markets have changed in 2018 as monetary policy switched from QT to QE and TOPPISH GDP & earnings growth became obvious. We anticipated that change at the end 2017 when we decided to quit Pictet and launched our own absolute return strategy though our new launched hedge fund Urizen. We are strong believers that the buy-the-dip strategy that performed so well in the QE era should be replaced by absolute returns ones in a QT era. Expected returns from traditionnal assets should be weak going forward and only a mix of trading, tactical calls, long volatility strategies, quantitative approach and short exposures could produce the kind of returns the QE era offered.