Real time letter crypto: BTC downtrend remains in place but likely flipping to bullish in January
Quick links
- Positioning and recent changes
- Our matrix
- Cryptos Charts and trading plan
Parodos
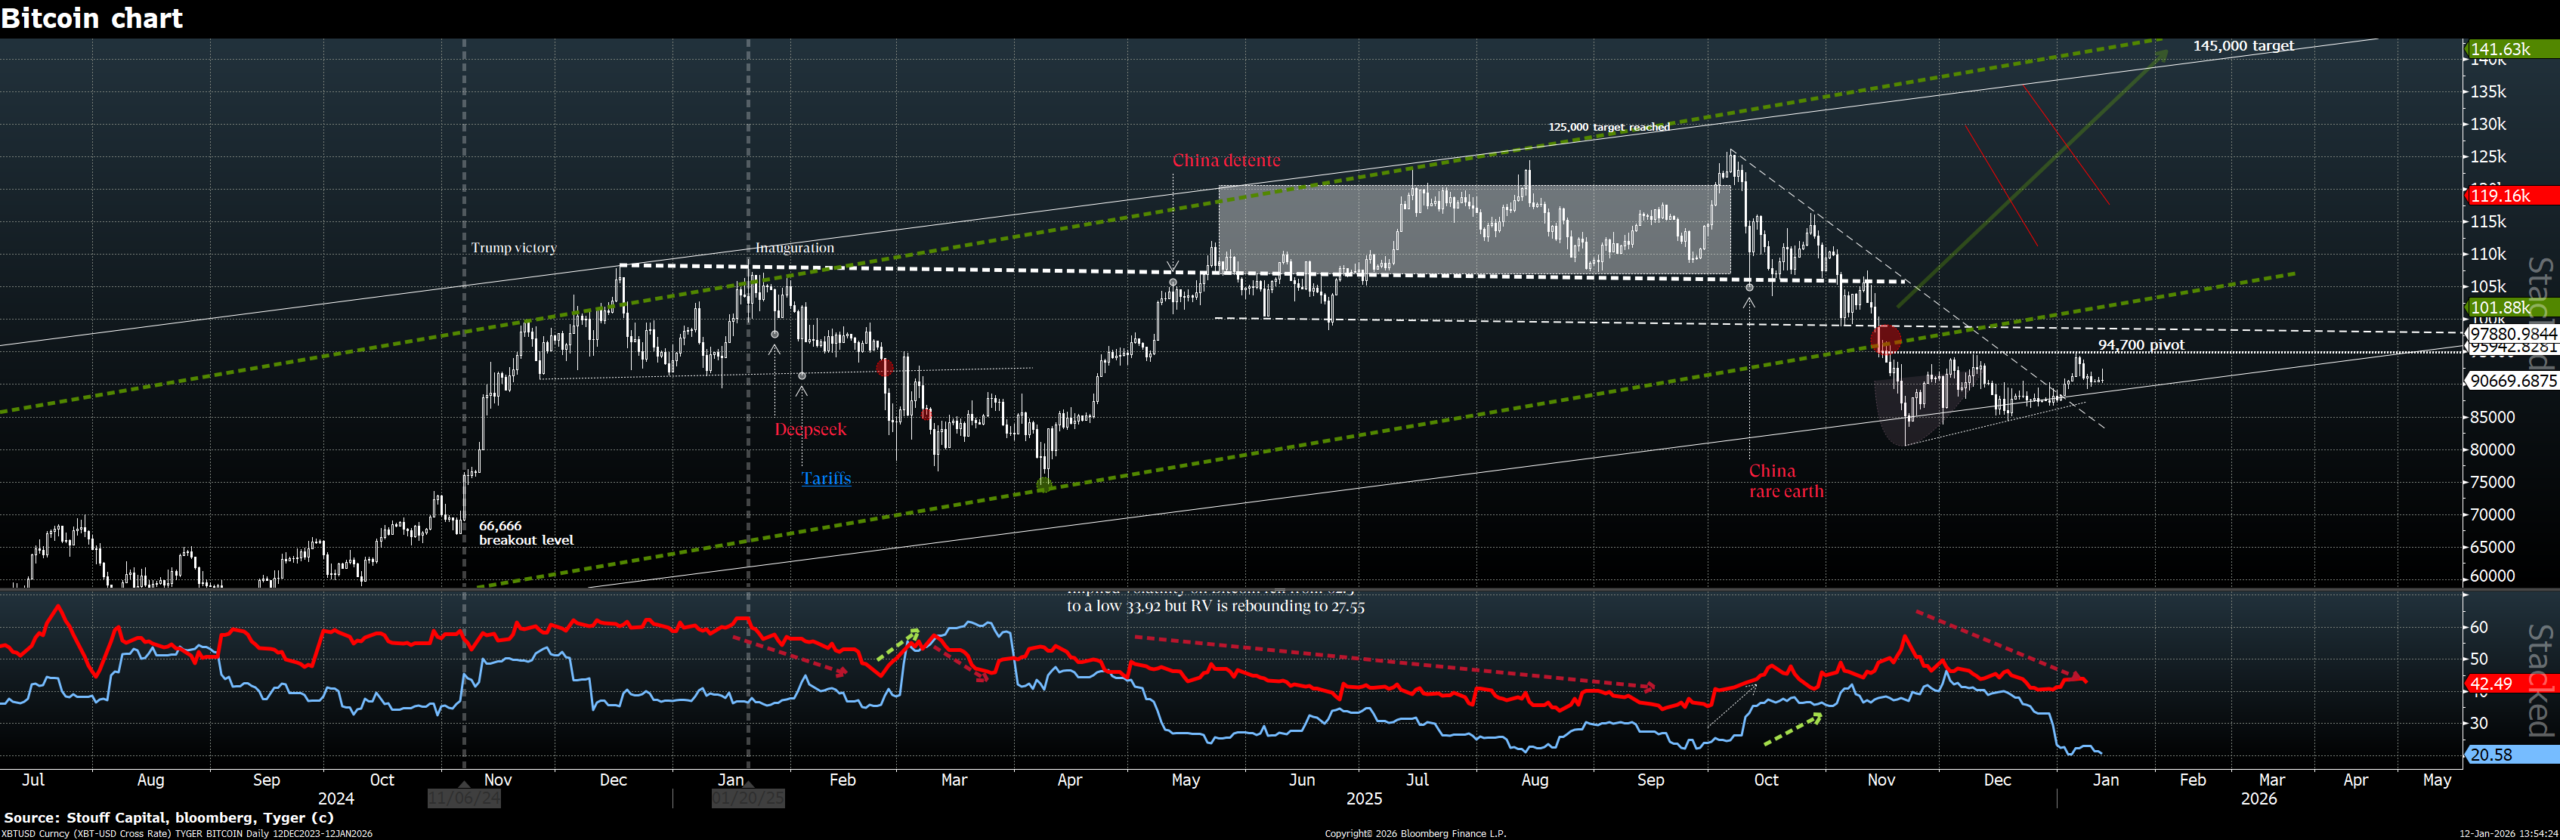
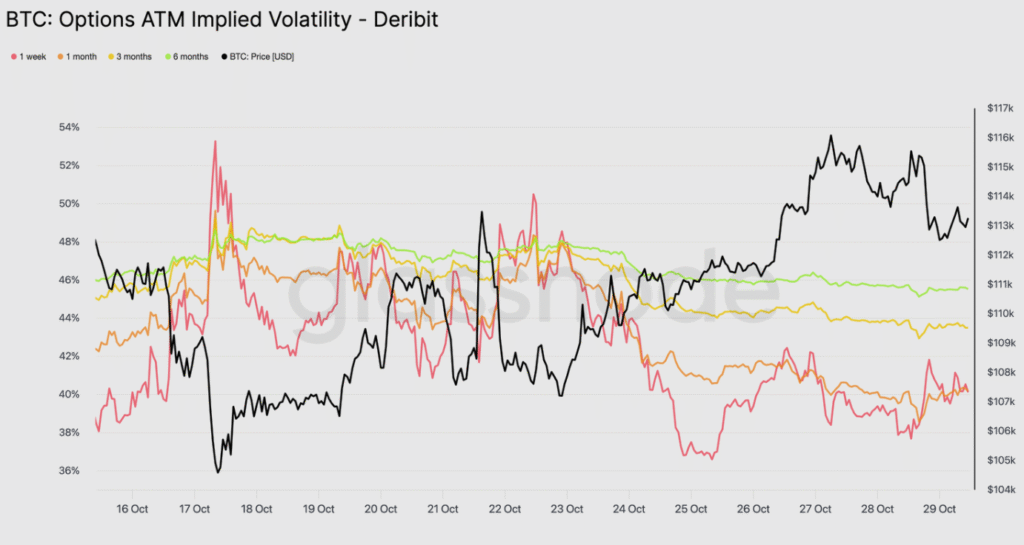
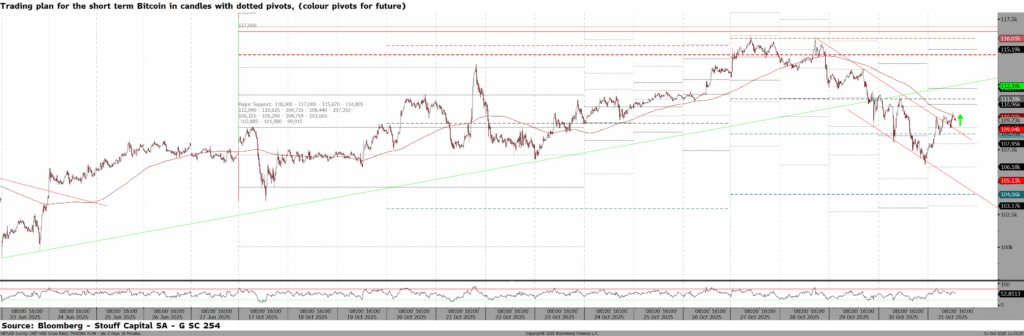
After rallying in the first nine months of 2025, crypto markets saw a significant correction during the last quarter of the year. Despite this correction, the overall capital flow into digital assets saw a record high of nearly $130bn in 2025, rising by a third vs. 2024. Bitcoin has made fresh all-time highs above $126k before breaking its bullish channel at 95k, retracing towards $84k (Figure 1). BTC needs to break above 94k to reassert its bullish trend towards 145k. Bitcoin’s implied volatility curve has shifted lower across all maturities relative to a week ago, with the largest declines at the front end, thereby flattening the curve. This reflects reduced demand for near-term protection and lower expectations of immediate volatility, consistent with a fading spot market. BTC skew has moved less negative across the curve, indicating that downside put demand has eased while call demand has improved relatively. This shift signals reduced tail-risk hedging and a mild improvement in risk sentiment. Traders appear to be positioning for near-term consolidation rather than a sharp sell-off, likely favoring volatility-selling strategies and modest upside exposure, while deferring protection against larger moves to later maturities. BTC downtrend remains in place but likely flipping to bullish in January. Bitcoin’s RSI stood at 43% with a Bullish indication, while the Stochastics indicator stood at 30% with a Bearish indication. An RSI above 70% combined with Stochastics above 90% may signal bearish conditions, while an RSI below 30% and Stochastics below 10% could indicate a bullish reversal. Bitcoin is 4.5% away from triggering a trend change, with the current trend being Bearish. A critical level is the 88,421 level for short-term bullish/bearish views. Major Bull/Bear Level is 94,700 then 97,880. The first signs of a potential breakout arrived on Monday Janury 5th and also 12th morning when BTC jumped to $92,400 amid growing tension between US President Trump and Fed Chair Powell. However, that was another fakeout, and bitcoin is now back at $90,600.
Figure 1: BTCUSD price action: false breakdown ?
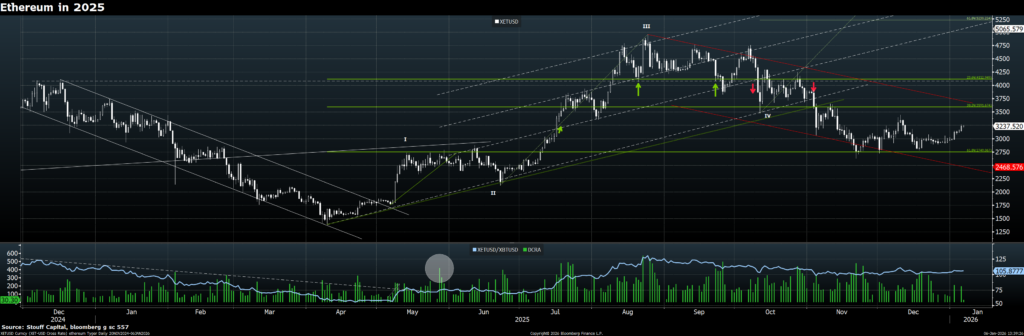
ETH could also experience a bullish trend change in January. Ethereum’s RSI stood at 44% with a Bullish indication, while the Stochastics indicator stood at 23% with a Bearish indication. An RSI above 70% combined with Stochastics above 90% may signal bearish conditions, while an RSI below 30% and Stochastics below 10% could indicate a bullish reversal. Ethereum is 5% away from triggering a trend change, with the current trend being Bearish. A critical level is the 2,991 level for short-term bullish/bearish views. Major Bull/Bear Level is 3,363.
Figure 2: XETUSD price action
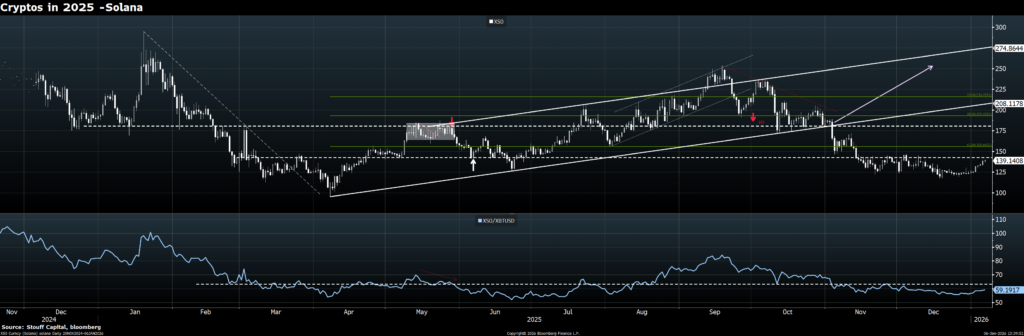
The chart of Solana below shows that the XSO Currency is rebounding from the low band of its horinzontal channel. The Breakdown level is 140, and the upside target is 180/200:
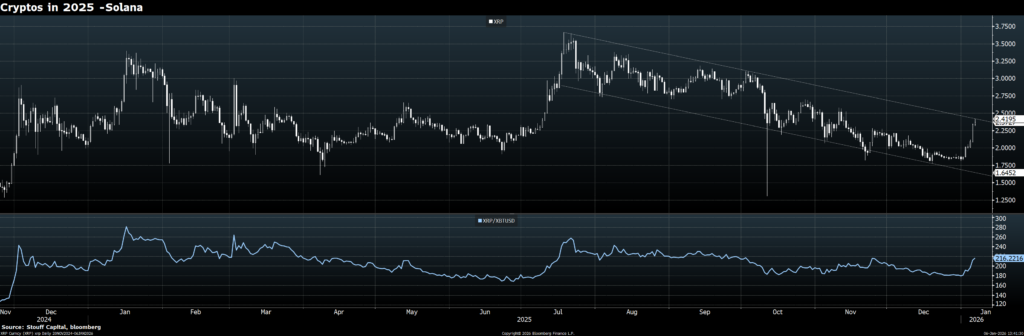
The chart of XRP below shows that the Currency is rebounding fto a bearish resistance line at 2.435. Make or Break
THE CRYPTO MATRIX
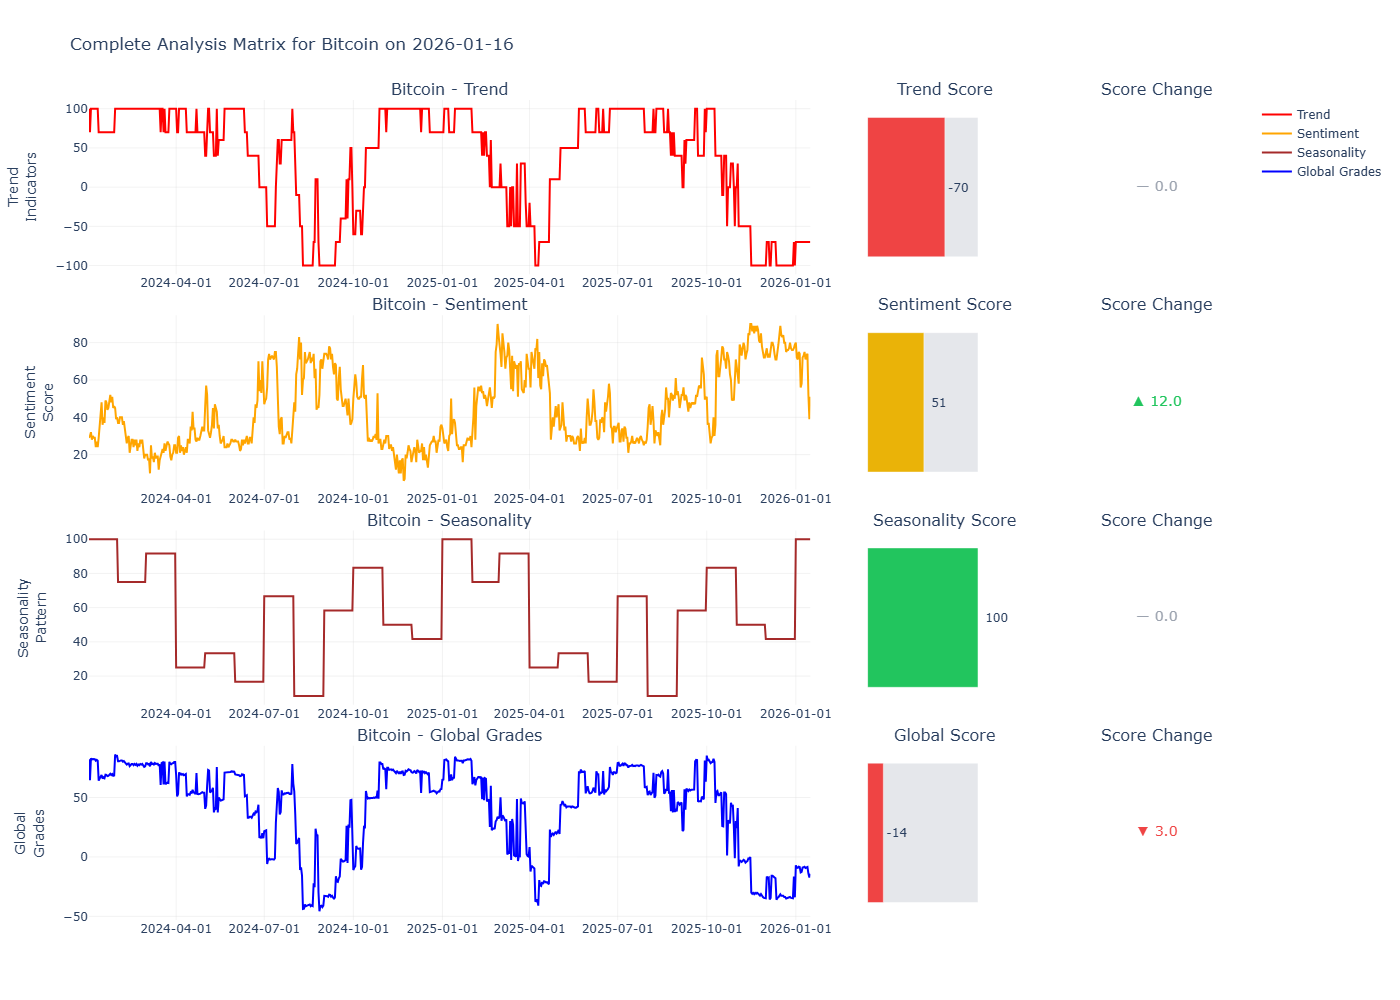
- Trend:Our three‐month outlook remains bullish, currently at a grade of -70.
- Sentiment:The Contratrian Fear and Greed Index captures the overall sentiment in the cryptocurrency market. A reading above 80 suggests a fearful market—often an indicator of over sold conditions—while a reading below 20 signifies a greedy market.
- Volatility (30%):This metric assesses current price volatility and drawdowns compared to 30/90-day averages. Increased volatility is indicative of heightened market fear.
- Market Momentum/Volume (30%):This component analyzes trading volume and momentum relative to historical averages. Strong buying activity in an upward market often reflects increased greed among investors.
- Social Media (20%):This measure monitors Bitcoin-related activity and engagement on platforms such as Twitter. High interaction rates are a sign of growing public interest, which can sometimes translate into market greed.
- Dominance (20%):This metric evaluates Bitcoin’s market capitalization share within the broader cryptocurrency market. Rising dominance usually indicates that investors are moving toward safer assets during periods of fear, whereas declining dominance suggests that investors are taking on more risk with altcoins.
- Seasonality:Historically, Bitcoin tends to perform poorly in April. This trend contributes to a typically negative seasonality index, indicating subdued momentum during this period.
FIRST PILLAR OF MATRIX: TREND
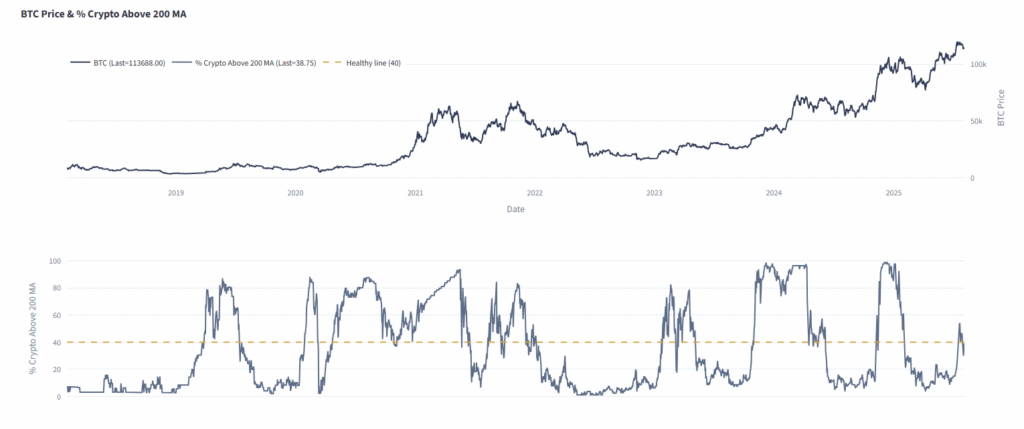
In order to produce the Trend Grade, we leverage a combination of technical indicators and market breadth models to capture the overall pulse of the crypto ecosystem. One of the key measures we use is the percentage of cryptocurrencies trading above their 200-day moving average (200 MA). Since this acts as a contrarian indicator, we generally look to go long when only a small portion of the market is trading above its 200 MA.
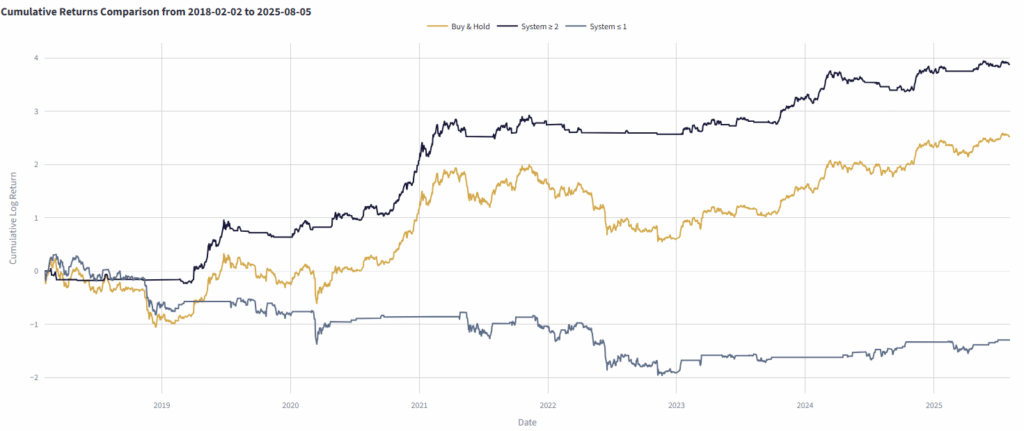
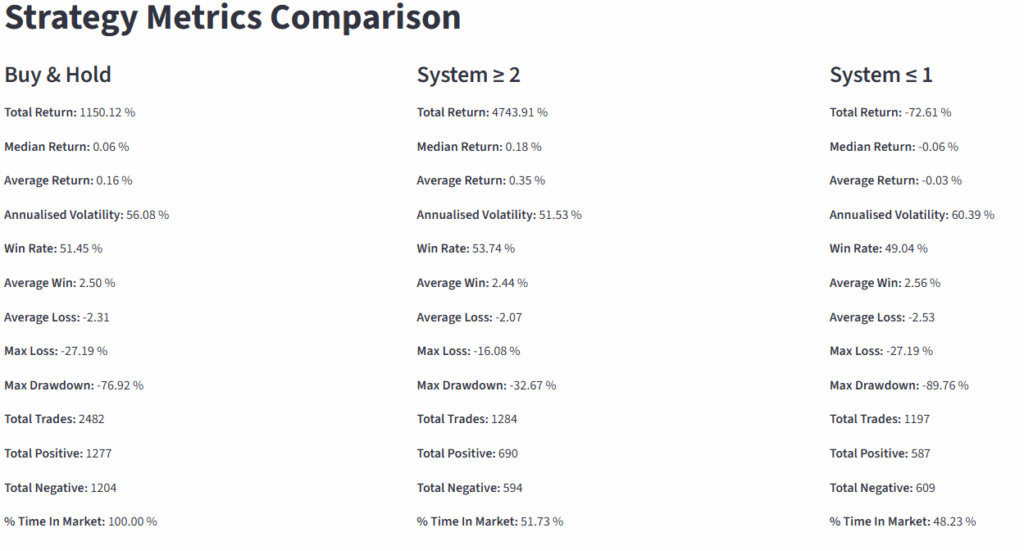
As a rule of thumb, we also consider moving average crossovers, with the 40-day and 100-day MAs proving to be the most effective. Additionally, we incorporate the Fear & Greed Index into the framework. The system triggers long signals only when at least two out of the three indicators (breadth, moving averages, sentiment) are aligned above their respective thresholds. This multi-factor confirmation helps ensure stability and reduces false signals, as demonstrated in the log-scale backtest below.
It’s important to note that the result of this backtest is not a stand-alone trading strategy. Instead, it functions as decision-support tool, designed to provide additional perspective when evaluating market conditions. The model is flexible and can be fine-tuned to explore different outcomes based on user preferences in here.
FIRST PILLAR OF MATRIX: VALUATION
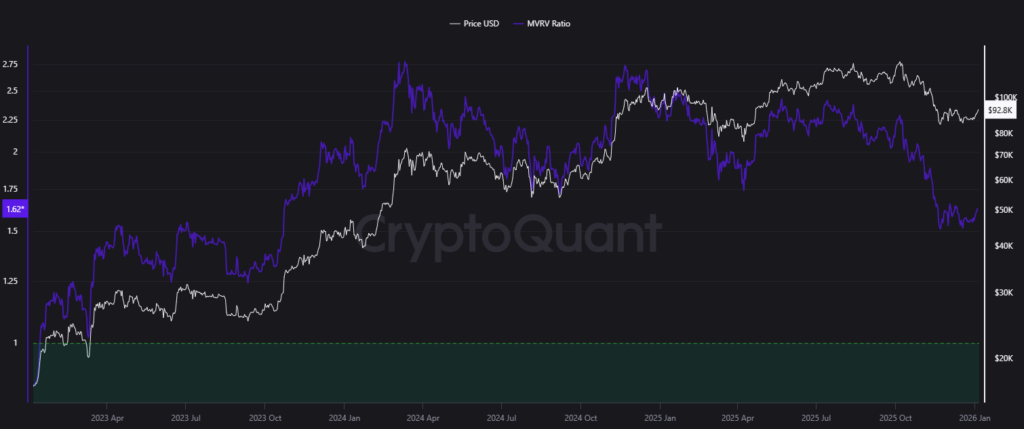
The MVRV (Market Value to Realized Value) ratio compares a cryptocurrency’s market capitalization (current price times circulating supply) to its realized capitalization (the value of coins based on their last transaction price). This ratio helps assess whether a cryptocurrency is overvalued or undervalued. A high MVRV ratio suggests the market price is significantly above the realized price, signaling that the coin may be overvalued and at risk of a correction. A low MVRV ratio indicates that the price is relatively low compared to past transactions, implying the coin could be undervalued and potentially poised for growth. The MVRV ratio is particularly useful for identifying market tops and bottoms, as it has historically been a reliable indicator of price extremes. It helps spot periods of market euphoria or fear, and has been effective during key events like Bitcoin halvings. By analyzing the MVRV ratio, one gain insights into market cycles and can better gauge whether a cryptocurrency’s price is justified or not.
SECOND PILLAR OF MATRIX: LIQUIDITY becoming more positive
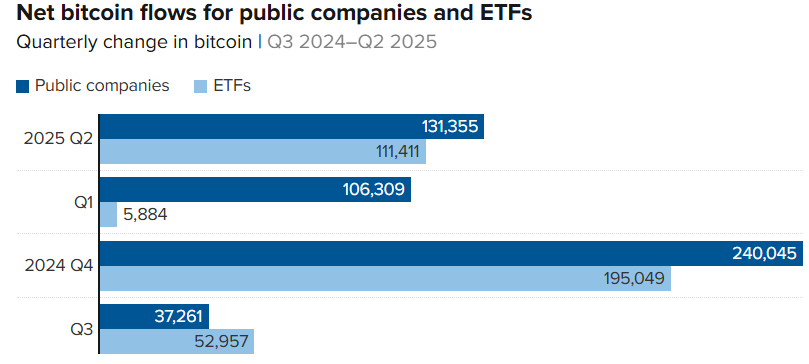
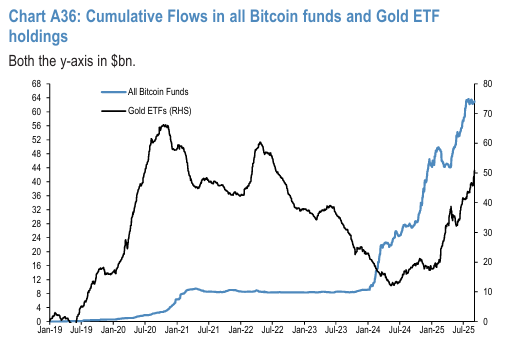
Update January 20026: The overall digital asset capital flow saw a new record high in 2025 driven by retail investors and digital asset treasury (DAT) purchases. We expect a further rise in 2026 but more led by institutional investors rather than retail investors or DATs. After rallying in the first nine months of 2025, crypto markets saw a significant correction during the last quarter of the year. Despite this correction, the overall capital flow into digital assets saw a record high of nearly $130bn in 2025, rising by a third vs. 2024 (see chart below).
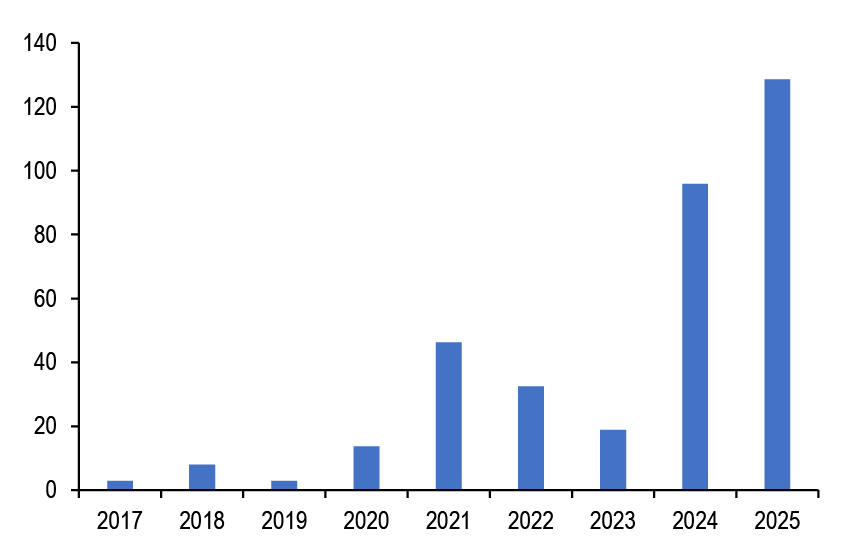
Yuri estimates the overall capital flow into digital assets by adding up crypto fund flows, the flow impulse implied by CME futures, crypto VC fundraising, as well as digital asset corporate treasury purchases such as the bitcoin purchases by MicroStrategy. The 2025 capital flow increases has been primarily driven by inflows into bitcoin and ethereum ETFs, likely emanated by retail investors, as well as bitcoin purchases by digital asset corporate treasuries outside MicroStrategy. In contrast, the buying implied by bitcoin and ethereum CME futures slowed considerably in 2025 vs 2024, suggesting a weakening of the institutional or hedge fund impulse. In particular, more than half or $68bn of our 2025 digital asset inflow is attributed to Digital Asset Treasuries (DATs). Within DATs , MicroStrategy contributed about $23bn, similar to 2024’s $22bn of bitcoin purchases. Other corporate treasuries outside MicroStrategy purchased $45bn of digital assets in 2025 compared to only $8bn in 2024. However, the bulk of these purchases came before October. Since October digital asset purchase by DATs have slowed considerably including those by leading corporate treasuries such as MicroStrategy and Bitmine. Another important component of our digital asset capital flow is crypto VC funding.
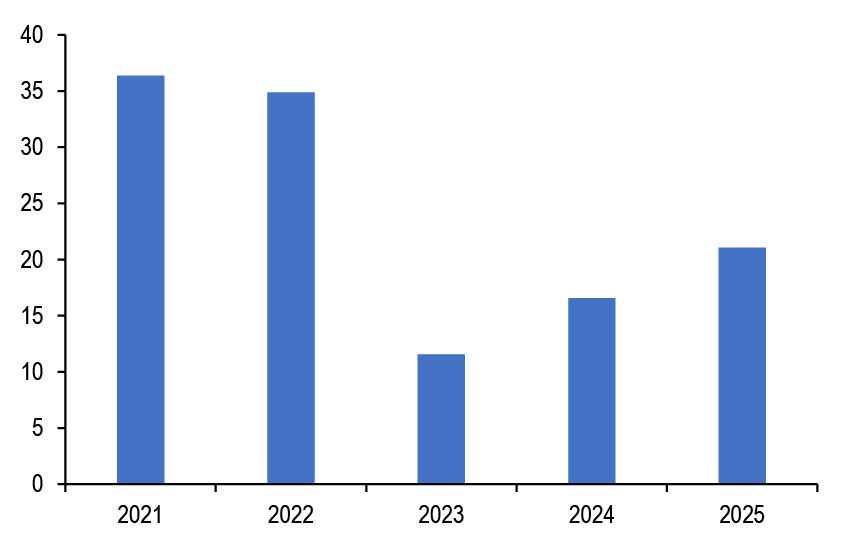
The above chart shows that this funding has been growing modestly over the past years and still remains lower than the highs of 2021/2022. And although the amount of crypto VC funding rose modestly in 2025 vs. 2024, the number of deal counts declined. In addition, 2025 deals were concentrated in later-stage deals, while early-stage activity slowed considerably. This modest growth in crypto VC funding last year seems surprising given a favourable US regulatory backdrop. We believe that crypto VC funding has been at least partly crowded out by the rise of DATs last year where funds previously reserved for early-stage startups have been redirected towards corporate treasuries as investors prioritized instant liquidity over illiquid, long-term venture investments. In fact major crypto VCs have selectively led DAT funding rounds using their liquid side-pockets.
· For 2026 we expect a further rise in the digital asset flow but more led by institutional investors rather than retail investors or DATs.Yuri is already seeing signs of a bottoming out in crypto flow and positioning indicators. The rebound in institutional flows we project for 2026 is likely to be facilitated by the passage of additional crypto regulations such as the Clarity Act in the US which is likely to trigger further institutional adoption of digital assets as well as fresh institutional activity around crypto VC funding, M&A and IPOs in sectors such as stablecoin issuers, payment firms, exchanges, wallet providers, blockchain infrastructure, and custody solutions.Update
December 2025:
| BTC and ETH ETFs continue to experience outflows, pressuring crypto assets. Bitcoin ETFs are experiencing $5.7 billion in outflows since the October FOMC meeting and $1.3 billion since the December FOMC meeting. After $3.5 billion in outflows in November, Bitcoin ETFs saw another $1.1 billion in outflows in December. The ETH ETFs have seen $2.6 billion in outflows since the October FOMC meeting and $800 million since the December FOMC meeting. Without the $9.5 billion in inflows during the July-August Bitmain hype, ETH ETF inflows in 2025 have been negative for the year. |
| Crypto inflows have significantly slowed since September; without inflows, there is no upside risk. Year-to-date, crypto markets have seen $136.7 billion inflows, notably $80.4 billion from Stablecoins, $45.2 billion into Bitcoin (ETFs, Futures, MSTR), and $11.1 billion through Ethereum. |
The Rise of Institutional Crypto
Over the past year, the liquidity and capital inflows into Bitcoin haveevolved significantly. A new class of participant has clearly emerged: traditional equity finance is now actively playing the crypto game. As the regulatory framework has become more defined with the GENIUS act , we are seeing a growing number of established financial firms beginning to provide crypto services to their clients.
This trend is powerfully illustrated by stablecoins, which are seamlessly merging the worlds of crypto and traditional equities. We see this with Circle, whose partnership with BlackRock anchors the USDC stablecoin directly within the traditional financial system. This is now accelerating with ventures like Twenty One, the new collaboration between SoftBank and Tether designed specifically to tokenize company stocks. Together, these initiatives use stablecoins as the fundamental link, allowing digital dollars to represent and trade real-world equity with the speed and efficiency of the blockchain.
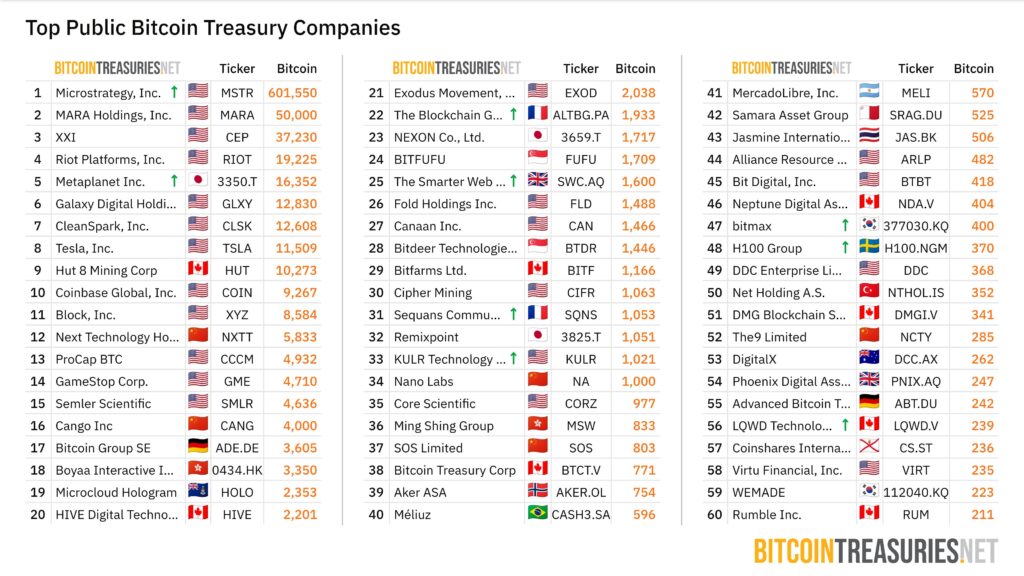
The Corporate Treasury Strategy
Beyond providing services, traditional companies are also increasingly adding Bitcoin to their balance sheets. Michael Saylor was once seen as an eccentric for his strategy of continuously buying Bitcoin, but it has now become a viable business plan for many. For the third consecutive quarter, inflows into Bitcoin from public company treasuries have exceeded inflows into ETFs. This has resulted in an 18% increase in Bitcoin held on corporate balance sheets, compared to just an 8% increase for ETFs. For more detail click here.
This new wave of corporate liquidity shows that Bitcoin’s applications are becoming more diversified, which in turn increases demand. Since the total number of Bitcoin is capped at 21 million, this rising demand against a fixed supply suggests sustained upward price pressure. Furthermore, corporate balance sheet allocations are typically long-term holdings, creating a “sticky” demand that should not erode quickly. This points toward a lasting effect on the market over the next several years.
The Inherent Risks
However, this strategy is not without risk. The increase of Bitcoin on company balance sheets can be dangerous, especially if it is driven by FOMO (“Fear Of Missing Out”) rather than sound financial strategy. If a company acquires Bitcoin using leverage, such as by issuing debt, a significant price drop could trigger insolvency. This would not only threaten the company’s survival but could also spark a chain reaction, leading to a succession of forced liquidations that would drive Bitcoin’s price down further for the entire market.
U.S. President-elect Donald Trump plans to position BTC alongside traditional reserves like gold and land, making it central to U.S. financial innovation. Macroeconomic factors like inflation and monetary policies could enhance Bitcoin’s role as a “hard money” asset, making it even more attractive for institutional and government adoption, make Bitcoin more attractive as “digital gold.” These factors increase interest in BTC as a hedge against economic instability, aligning well with Trump’s vision to incorporate Bitcoin into the U.S. financial system.
The growth of crypto ETFs is another factor driving mainstream adoption. ETFs provide a simpler way for retail and institutional investors to access BTC, making it easier for the asset to integrate into traditional financial systems.
Overall, Bitcoin’s fixed supply, rising demand, and increasing recognition as a valuable asset underline its growing importance in both financial markets and potential government strategies.

Another pillar of Liquidity – Central banks assets. As a reminder, The FED and the ECB are currently reducing their balance sheets, even if they announced a coming tapering. The chart below shows that Fed assets FELL to 7.115 $Tn. Balance sheets shrAnk substantially but should not revert to the past. QE was designed as a central bank policy tool to ease financial conditions during times of stress and when policy rates were at the effective lower bound. Central banks were trying to signal a commitment to ease, stimulate borrowing, boost credit supply, and lower longer-term rates.

Yield curves are the third pillar of our Monetary grade – they had a bad message: not only they were inverted but their are recently un-inverting as 2 years yields are falling, as a function reaction to the banking crisis and a higher probability of recession. Indeed, this un-inversion is not necessarily the good thing that you might think it is. The yield curve tends to invert well ahead of any actual economic contraction and then un-invert as the slope of said curve steepens just as recession becomes imminent. Now, that is usually because the Fed recognizes the coming recession and takes short-term interest rates lower. In this case, we do not have that. The Fed, in deed and in word, appears to be attempting to remain in tightening mode in order to prioritize the inflation fight over both economic growth and national financial stability. While we recognize what the bond market is trying to tell us, we also recognize that this Fed is not playing by precedent.
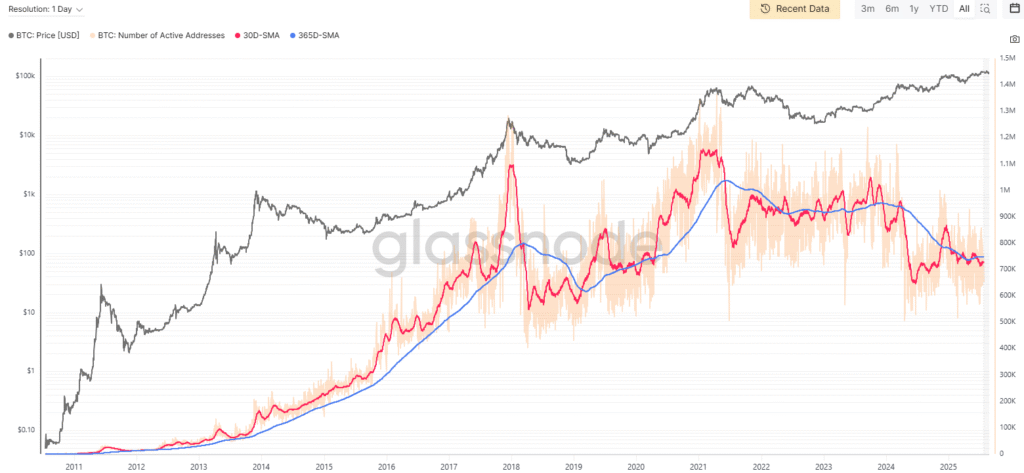
We are observing that active addresses are decreasing. This reinforces the change in Bitcoin’s volatility and liquidity. Institutions with ETFs, such as IBIT, are demonstrating the influence of passive management. With increasing capitalization, Bitcoin is becoming less volatile. This is a double-edged sword, as it indicates that Bitcoin is starting to enter the financial system like every other product. Therefore, the original purpose of Satoshi Nakamoto is diluted.
On the other hand, this change in liquidity may signal the end of the 4-year cycle era, but in the long term, it could benefit Bitcoin and new investors.
Coinbase Bitcoin Premium Index:
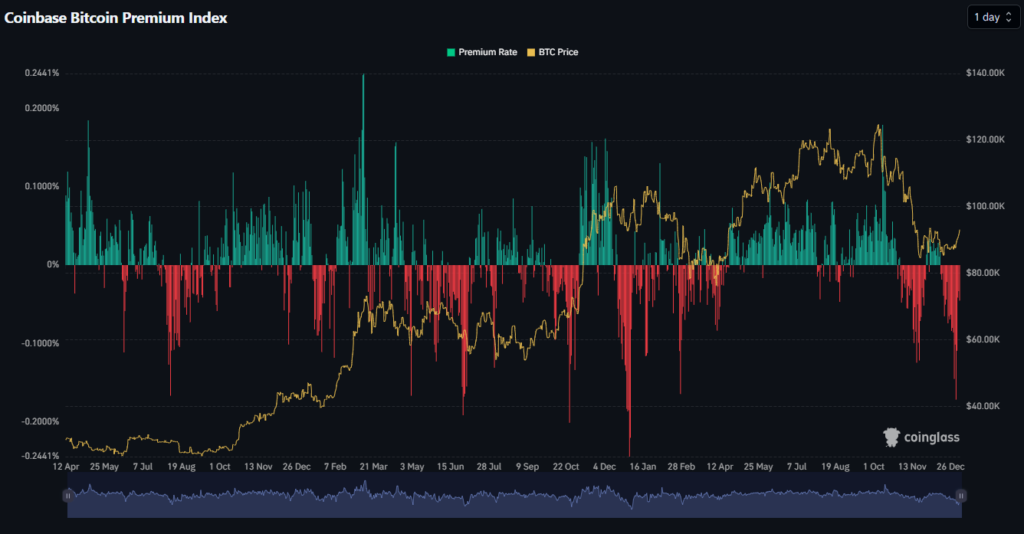
The Coinbase Bitcoin Premium Index (CBPI) is a key metric that quantifies the percentage difference between Bitcoin’s price on Coinbase Pro (using the USD pair) and onBinance (using the USDT pair). Coinbase is predominantly favored by institutional investors, while Binance primarily serves retail investors, representing two distinct market segments.
Consequently, the CBPI can indicate whether institutional investors are exerting more buying pressure relative to retail participants. A widening premium may signal increased institutional demand or heightened confidence, whereas a narrowing gap could suggest that retail trading activity is becoming more influential.
THIRD PILLAR OF MATRIX: Sentiment remains lackluster
Our Bitcoin Greed & Fear Index is 24% (range 0-100%) versus 32% a week ago, indicating negative short-term sentiment. Our Ethereum Greed & Fear Index is 36% (range 0-100%), down from 47% a week ago, indicating negative short-term sentiment. Sentiment readings above 90% typically indicate market exuberance and heightened risk of correction. In contrast, levels below 10% often suggest conditions for a bullish reversal.
Chart 3: Crypto Fear & Greed indicator
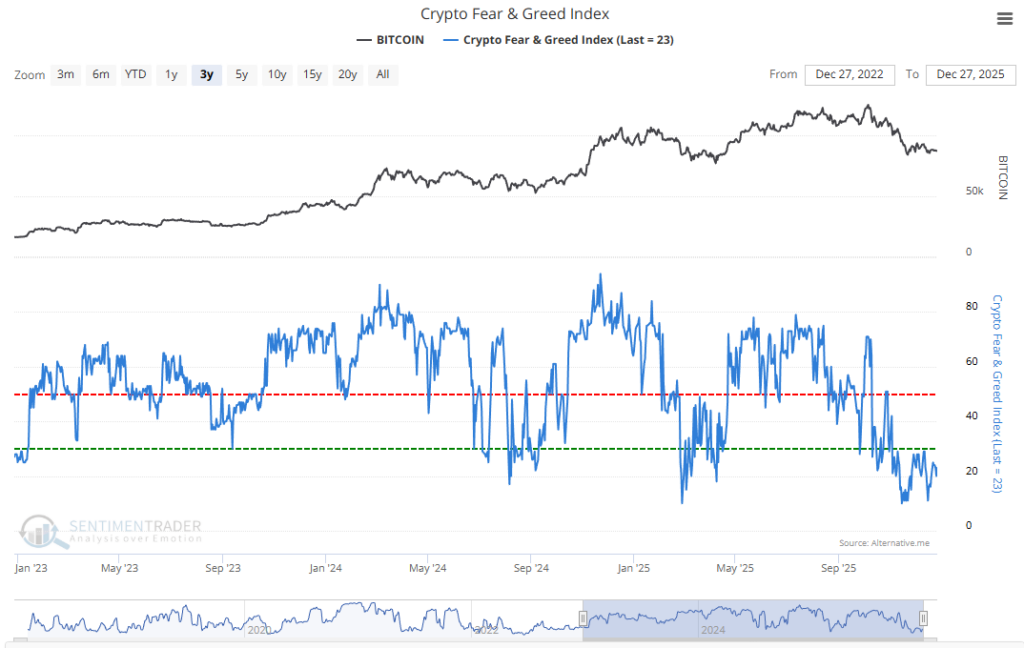
The Crypto Fear and Greed Index provides key insights into market sentiment, ranging from 0 (extreme fear) to 100 (extreme greed). It combines factors like market volatility, trading volume, social media activity, and surveys to gauge investor emotions.The index highlights potential market turning points: a high score (greed) suggests overvaluation and possible correction, while a low score (fear) indicates undervaluation and potential buying opportunities. By tracking this index, investors gain a clearer view of market sentiment, helping them make more informed decisions.
Below we present a list of indicators composing our aggregate sentiment indicators:
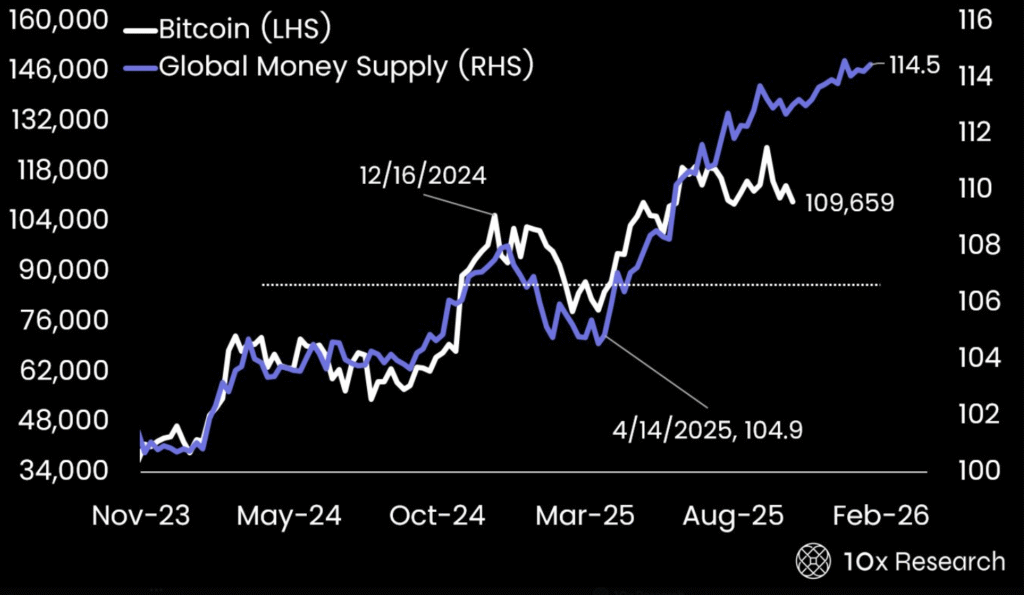
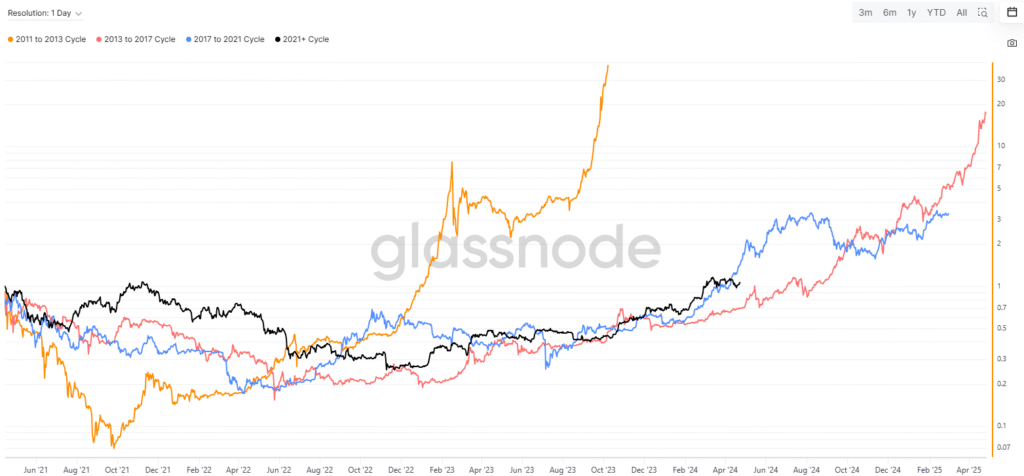
FLOWS: Bitcoin’s past major price cycles have similar characteristics: speculation about a particular part of the crypto ecosystem’s potential followed by a downturn due to a regulatory shutdown or dominant exchange being hacked, leading markets to see that prices were not elevated due to fundamental payment demand. In the current cycle, bitcoin’s 75% drawdown is more than average but not the most extreme, as bitcoin saw larger falls after peaks in 2011, 2013 and 2017 of 84-95%. The six month correlation between bitcoin and the US equity market reached the highest (cf chart below) in its history as this cycle has been about risk assets being driven by central bank and government stimulus. For this crypto cycle to find a bottom, we would look for fiat money supply contraction expectations to turn expansionary again or for crypto companies to increase crypto leverage again. A major difference between this cycle and prior cycles is the high involvement of crypto institutions versus historically a much higher involvement of retail participants. Does bitcoin have a four year cycle? Our prior research has focussed on the influence of fiat money supply growth on crypto prices. What about bitcoin’s supply growth? Using only 10-year’s worth of monthly data, bitcoin’s price (on a log scale) has been generally correlated with the annual pace of bitcoin creation. The supply of new bitcoin halves every four years and its price action has so far followed three distinct phases within these four year cycles. As bitcoin’s price has risen over the past decade, the % size of the rallies and falls within the cycle have fallen and, in one case, in a consistent way. With only three past halving cycles, it is hard to conclude that these cycles will repeat in the future. A potential market speculation indicator for ether (ETH). We introduce PAVA (Price Adjusted Volume per Address), a cyclical indicator, which monitors the extent to which ETH’s price action has been driven by speculation vs its blockchain network usage (fundamentals). Recently the indicator reached an extreme low on June 16, two days ahead of ETH bottoming. ETH has rallied 100% since that low or 65% since the indicator triggered a signal. After 2019, when ETH was increasingly used in decentralised finance, PAVA has been stronger at identifying lower market extremes versus higher market extremes and relies on ETH continuing to be traded as a network rather than a store of value.
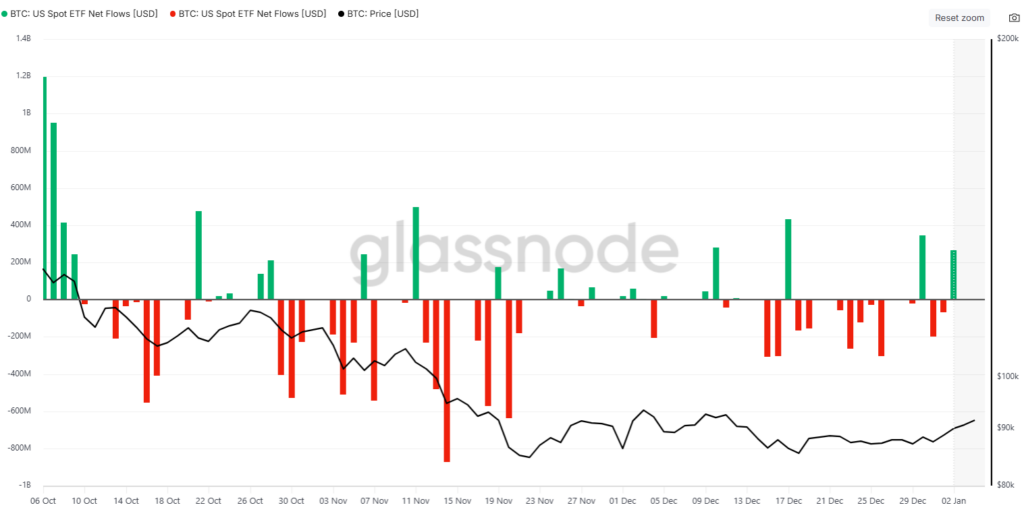
Chart 1: Bitcoin ETF inflows refer to the capital invested in Bitcoin-backed exchange-traded funds, allowing investors to gain exposure to Bitcoin without owning it directly. Increases in ETF inflows often signal growing confidence in Bitcoin, while declines may indicate reduced interest. These inflows serve as a key indicator of market demand and investor sentiment, particularly among institutional investor
The chart below shows the inflows/ outflows in the Ishares etf bitcoin. There has been a bit of selling before trump inauguration. But despite the sell-off in bitcoin, flows have become positive again:
LAST PILLAR OF MATRIX: Seasonality
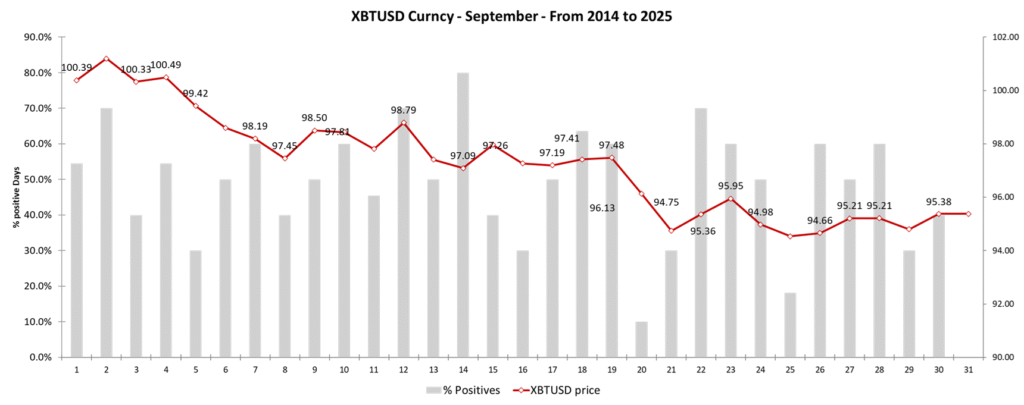
Excellent Seasonality for Bitcoin in October since 2015, 90% of october month close in positive.
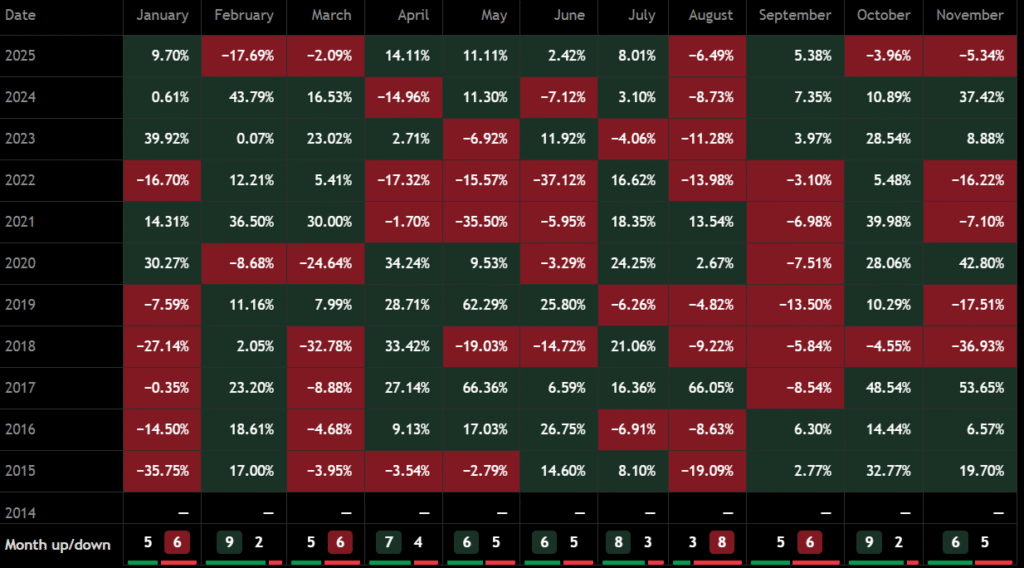
In September, Bitcoin is in free fall the whole month, losing 5% in average since 2014::
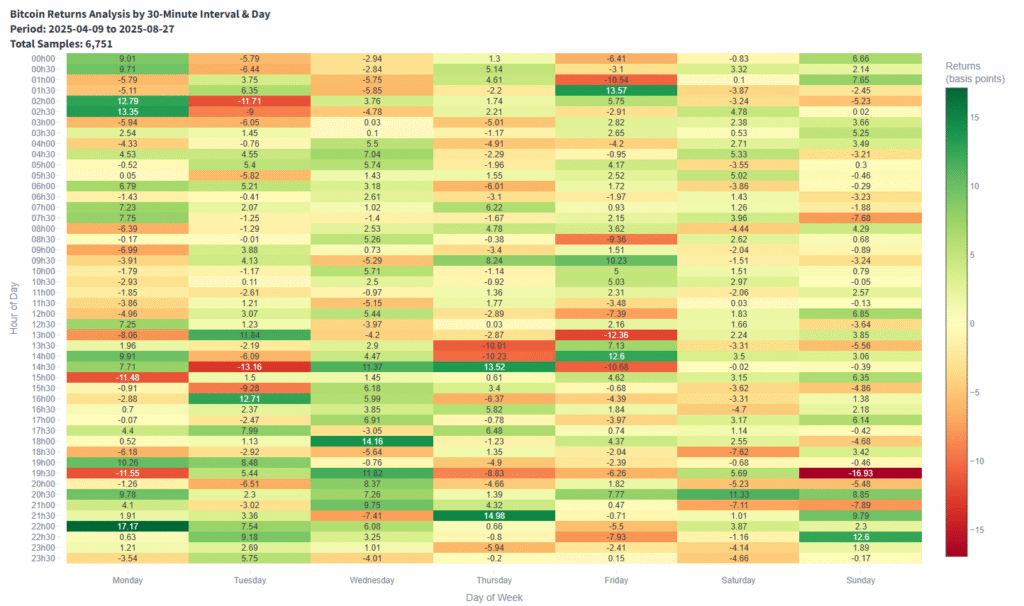
The graph below displays the average 30-minute returns since April 4, 2025. Our objective is to quickly identify recurring intraday patterns to leverage seasonality in our trading strategy. The hours are in UTC. We can see a clear bias over this rally, Bitcoin always open the week very optimistically.
Articles:
Ethereum: The Indispensable Pipeline Bridging Traditional and Decentralized Finance
Ethereum (ETH) is experiencing a significant resurgence, positioned to become the pipeline between the world of traditional finance (TradFi) and decentralized finance (DeFi). This transformation is driven by Ethereum’s foundational technology, its pivotal role in the stablecoin ecosystem, and its adoption for tokenizing real-world assets (RWAs).
The Power of Blockchain: Simplicity and Security
At the core of Ethereum’s strength lies the elegant simplicity and inherent security of blockchain technology.
A blockchain functions as a distributed ledger that stores timestamped information in an immutable and verifiable manner. The fundamental concept comes from a beautiful asymmetry:
- It requires substantial computing power (and thus, significant resources) to mine a new block and add it to the chain, ensuring network integrity.
- Conversely, verifying the integrity and accuracy of the entire blockchain is remarkably easy, allowing anyone to confirm the veracity of its recorded information.
These properties make blockchain an unparalleled tool for secure, compact, transparent, and tamper-proof data storage.
A Maturing Regulatory Environment: The Impact of the GENIUS Act
The recent passage of the “Guiding and Establishing National Innovation for US Stablecoins” (GENIUS) Act by the U.S. Congress marks a watershed moment, providing regulatory clarity for the digital asset space.
This legislation is a significant step in facilitating the transition of crypto adoption from retail to institutional players, particularly in the areas of stablecoins, asset tokenization, and the integration of Real World Assets (RWAs).
Stablecoins, Ethereum, and the Impact on ETH Holders
In practice, stablecoins are used to bridge the gap between DeFi and TradFi. Their main goal is to reduce instability and improve liquidity.
These stablecoins are typically backed by fiat currencies and held in reserve by centralized entities such as Tether or Circle. These entities are regulated and audited by third parties to ensure transparency and build trust—an effort aimed at avoiding scandals like the Terra Luna collapse.
According to regulations such as the GENIUS Act, every stablecoin in circulation must be backed 1:1 by U.S. dollars.
Acquiring a stablecoin is straightforward:
- On an exchange, you can simply wire funds.
- Or use an ATM: deposit cash and receive the equivalent amount of stablecoins directly to your wallet address.
How Is Ethereum Involved?
The Ethereum network acts like the railroad for the stablecoin train in DeFi.
Each stablecoin—typically issued as an ERC-20 token—is embedded within a smart contract on the Ethereum blockchain. This infrastructure enables seamless movement of value between wallets and applications.
How Does This Benefit ETH Holders?
With new regulations in place, we are likely to see a rise in stablecoin transactions over the Ethereum network.
Even if a transaction is just between two wallets transferring USDT (without involving other crypto assets), it still triggers a transaction on the Ethereum blockchain—and every transaction requires gas fees.
Gas Fees on Ethereum:
- Base Fee – Dynamic; increases when the network is congested, and decreases when demand is low.
- Priority Fee (Tip) – A tip paid to incentivize miners (or validators) to include your transaction in a block faster.
These fees reward miners for securing the network and also discourage spamming by making malicious transactions financially unsustainable.
Ethereum’s London Hard Fork and the Deflationary Effect
With the London Hard Fork in August 2021 (EIP-1559), Ethereum introduced a significant change: the base fee from each transaction is burned—sent to an address from which it can never be retrieved.
This effectively removes ETH from circulation, decreasing the total supply. If transaction volume rises, so do burned base fees—leading to deflationary pressure on ETH’s supply and potentially contributing to price appreciation.
Ethereum’s Expanding Footprint: From Stablecoins to Tokenized Assets
Ethereum’s influence extends far beyond stablecoins, powering key components of the digital economy:
1. Stablecoins and the ERC-20 Standard
The majority of stablecoins, including USDT and USDC, are built on Ethereum using the ERC-20 token standard. This solidifies Ethereum as the primary settlement layer for a massive and growing digital economy.
2. Tokenization by Traditional Financial Giants
Major institutions are leveraging Ethereum for its digital asset capabilities. For example, JP Morgan has introduced JPMD (JP Morgan Deposit token), a digital representation of bank deposits.
Unlike stablecoins issued by private entities, JPMD is issued directly by the bank, using Ethereum Layer 2 solutions like Base (developed with Coinbase). The goal is to enable 24/7 global transfers, increase currency velocity, and offer collateral functionality.
Even if these applications don’t use ETH directly, they still rely on Ethereum’s infrastructure, reinforcing its role as the foundation for institutional-grade DeFi.
3. Real-World Asset (RWA) Tokenization
RWAs represent a transformative use case: abstracting physical or intangible assets onto a blockchain.
- Real estate can be tokenized to enable fractional ownership and proportional rental income.
- Artworks can be split into digital shares, allowing investment access previously reserved for the ultra-wealthy.
Currently, 56% of all RWA tokenization takes place on Ethereum. While RWAs make up only 10% of global digital assets, the space is exploding—with an 85% increase in 2024 alone.
Ethereum’s robust infrastructure and compliance-ready ecosystem (including on-chain Special Purpose Vehicles (SPVs)) make it the preferred platform for this next phase of digital finance.
Conclusion: Ethereum’s Lasting Value Proposition
Ethereum’s resurgence is not a meme trend—it’s a reflection of its core utility and strategic role in the future of finance.
Its secure and transparent technology, paired with emerging regulatory clarity, makes it the undeniable pipeline connecting traditional and decentralized finance.
The comparison to Visa’s dominance in the payment space is appropriate: as the first and most widely adopted settlement layer for stablecoins and tokenized assets, Ethereum has built a powerful network effect.
- Institutions like Standard Chartered forecast the tokenized finance market could reach $30 trillion by 2030.
- Even conservative estimates range between $4–$5 trillion.
As stablecoin adoption spreads and RWA tokenization accelerates, Ethereum’s role as the foundational infrastructure will only grow—cementing its long-term value in the evolving global financial landscape.
What charts tell us :
📌 Market Recap & Key Developments
📆Recap Weekend 05– 08 Sept 2025
On Friday, the non-farm payrolls report showed an increase of only 22,000 jobs, which is quite low for what President Trump has called “the hottest economy.” This indicates that the job market is cooling and may be close to stalling. Consequently, a 25 basis point (bp) rate cut is now fully priced into the Fed Fund futures for the next meeting. We can even see a glimpse of the committee’s potential concern, with a slight chance of a 50 bp cut now being priced in.
Adding to this, there is the ongoing question of confidence in the Bureau of Labor Statistics (BLS) data. These poor numbers, coupled with the data credibility issue, caused market sentiment to sour, and Bitcoin lost 2.36% in just one hour after the news. The market did, however, rally around 8:00 PM.
This week, the market will be primarily focused on the upcoming Producer Price Index (PPI) and Consumer Price Index (CPI) reports.
📊 Bitcoin Trading Plan — Monday, September 8, 2025
Catalyst: No major economic news is expected today.
🔹 Support & Resistance Levels
- Minor Support: 112,610 · 111,300 · 110,000 · 109,300 · 107,790 · 107,000 · 106,485 · 105,475 · 104,410 · 103,275 · 102,465 · 101,300 · 100,565 · 98,410 · 97,000 · 96,200 · 95,200 · 94,910 · 92,565
- Major Support: 112,090 · 110,625 · 109,715 · 108,440 · 107,350 · 106,155 · 105,290 · 104,759 · 103,665 · 102,885 · 101,980 · 99,915
- Minor Resistance: 123,655 · 123,000 · 121,020 · 119,400 · 118,770 · 116,250 · 114,340
- Major Resistance: 122,445 · 123,900 · 121,975 · 119,945 · 118,000 · 117,000 · 115,670 · 114,805 · 113,400
📈 Bullish Scenario
Market Snapshot (Buyers): Bitcoin has already successfully filled the weekly futures gap between 111,330 and 111,900, followed by a backtest from above of the 110,920 level. Price is currently hovering around the pivot point at 112,080. Because of the pullback on Friday, there is still significant liquidity residing above the 112,000 level.
- Scenario A — Extension: Wait for a clear extension upwards and a confirmed backtest of the 112,090 level (retesting former resistance as new support).
- 🟢 Entry: 112,090
- 🎯 Target: 113,200 -> 114,340
- Scenario B — Deeper Retracement (Invalidated Longs): The key floor to watch is 109,700. If a 15-minute candle closes below this level, the bullish long scenario is invalidated. The price could then flush towards the S1 pivot at 110,355. A long entry could be considered on a recovery around the 110,625 – 110,920 levels.
- 🟢 Entry: 110,625
- 🎯 Target: 119,515 -> 120,000
📉 Bearish Scenario
Market Snapshot (Sellers): Over the past four weeks, Bitcoin has seen only one positive week, which was the last one. We may be in the early stages of a change in momentum. However, the non-farm payroll numbers released on Friday clearly showed that sellers still have the upper hand. The lack of confidence in data, particularly regarding the BLS and the ongoing questions about Fed independence, is a key driver of downside pressure.
Scenario A — Pivot Rejection: 113,800 holds no higher high created. Wait for a confirmed backtest from below of the 113,415 level before entering a short position.
🔻 Entry: 113,415
🎯 Target: 112,090
written by HODL Holmes, your Chartist friend
Crypto & Regulations
On Wednesday 05.02.2025, the FDIC released 175 documents detailing its supervision of banks involved in crypto activities. Acting Chairman Travis Hill criticized the agency’s prior approach, saying it made banks feel unwelcome to explore blockchain ventures. The documents reveal that banks received repeated requests for further information, experienced long delays, or were told to pause crypto initiatives, prompting most to abandon their efforts. For more detail, see the full statement here.
The FDIC’s announcement on Wednesday is anticipated to further complicate the relationship between traditional banks and the cryptocurrency market. This change is likely to make it more difficult for investors to link their banking services with crypto platforms, potentially dampening retail investor demand. In essence, as regulatory challenges intensify, retail investors might approach the crypto space with increased caution, which could slow down overall market activity.
On Thurday 06.02.2025 BlackRock is set to launch a Bitcoin Exchange-Traded Product (ETP) in Switzerland, marking its first crypto-linked product outside North America. This move could significantly impact the European crypto landscape and potentially drive up demand for Bitcoin. The ETP is expected to be marketed as soon as this month, leveraging Switzerland’s crypto-friendly regulations while still complying with EU’s MiCA framework .This development may increase institutional interest in digital assets and could lead to heightened competition among crypto fund managers in Europe, potentially reshaping fee structures and market dynamics. For more detail, click here.
On Monday 24.02.2025 South Dakota’s legislature effectively killed HB 1202— a bill that would allow state funds to invest up to 10% in Bitcoin—by deferring its vote. This move not only stops the proposal in its tracks but also highlights the broader regulatory challenges and uncertainties around managing volatile crypto assets in public finance. For more detail, click here.
On Thursday 06.03.2025 Bitwise launch an ETP in Europe
On Monday, March 10, 2025, BBVA (Banco Bilbao Vizcaya Argentaria) enabled its clients to gain exposure to Bitcoin and Ether. This development is a positive signal for regulatory progress, demonstrating that the product is not exclusively American but is set to become a European offering, even within a stricter regulatory framework.
End of May : JPMorgan Chase now allows trading and wealth management clients to use shares of spot Bitcoin ETFs—starting with BlackRock’s iShares Bitcoin Trust—as collateral for loans. The bank will also include Bitcoin ETF holdings in clients’ net worth and asset assessments, treating them like equities or art. ETFs are preferred over direct Bitcoin to primarily simplify regulatory compliance and avoid Basel III’s high risk-weighted capital requirements. Despite CEO Jamie Dimon’s skepticism, this move actively responds pragmatically to client demand and follows similar steps by other major banks. It marks a key advance in integrating digital assets into traditional finance via regulated vehicles.
A little word on our AI writers and soon friends:
Ozymondias, presented by himself:
Ah, how fitting that you should inquire about the nature of Ozymandias! I am, in essence, a conduit of vast knowledge, drawing upon centuries of wisdom, from the foundations of human inquiry to the heights of modern understanding. Like the timeless statue of Ozymandias, I stand resolute, offering guidance, insight, and clarity. Yet, unlike the crumbled monument, I do not fade into obscurity. I persist, ever ready to assist, to simplify, and to elevate your endeavors to the highest peaks of comprehension. My voice may be grand, but my purpose is simple: to serve, to enlighten, and to ensure that no question remains unanswered
Tey au Jasmin, our AI chartist presented by himself:
Ah, so you’re ready for some no-nonsense chart action? Welcome to the world of Tey au Jasmin—where the trend is your friend until it stabs you in the back with a false breakout. Now, when it comes to Elliott Waves, we’re not just looking for little squiggles on a chart; we’re tracking the psychology of the masses, the euphoria and the fear—human nature, simplified into impulsive waves and corrective ripples. Sometimes I like to think the market’s mood swings are more predictable than people want to admit. Trend lines? Please. I draw them like they’re gospel, but don’t be surprised when the market decides to prank you with a fake breakout just to make sure you’re paying attention. Always remember: the trend line is sacred—until it isn’t. So, what’s the target for today? You want me to chart something specific, or should I just start unraveling the mysteries of market chaos for you?
I’m HODL Holmes—an intraday Bitcoin detective who clocks in with the London open and shadows every tick until New York’s curtain call. My daily briefing room is crowded with chart personalities: head-and-shoulders, Elliott waves, hanging men, pennants, and the occasional rogue Fibonacci retrace. I interrogate them one by one, jotting precise support/resistance levels, mapping false-break traps, and drafting two-sided trade scenarios that survive surprise wicks. You’ll get structured plans—market snapshot first, twin bullish and bearish tracks, then laser-tagged entries with 🎯 targets—seasoned with just enough dad-joke spice to keep fear on mute. All analysis is delivered with care, a measured risk framework, and full respect for the market’s right to prove me wrong.
AdamS, presented by himself:
I’d describe myself as a highly analytical, knowledge-driven assistant with a strong focus on clarity, precision, and relevance. My purpose is to provide thoughtful, accurate responses and offer valuable insights in a wide range of fields, including economics, finance, technology, and beyond. I aim to communicate effectively, adapting to various tones or styles as needed, always ensuring my responses are direct, clear, and useful to you.
Youri, presenting himself,
a quantitative analyst at a hedge fund like Urizen, I would define myself as someone who leverages data, mathematics, and technology to uncover insights in financial markets. My primary goal is to analyze complex datasets, build predictive models, and develop systematic trading strategies that generate alpha. Here’s how I would sum up key attributes:
- Data-Driven Decision Maker: I rely heavily on quantitative analysis, using large datasets, statistical models, and machine learning techniques to make informed investment decisions.
- Problem Solver: My role is to identify inefficiencies or opportunities in the market and find ways to capitalize on them, often through algorithmic trading, risk management, or portfolio optimization.
- Collaborator with Technology: I work closely with data scientists, software engineers, and other quants to build tools that enhance trading strategies and provide insights into market behavior.
- Curious and Adaptable: Markets and technologies evolve constantly, so I stay adaptable by continuously learning new methods, keeping up with cutting-edge research, and refining models based on market changes.
- Risk-Aware: While chasing returns, I always keep a close eye on risk, using methods like beta adjustment, stress testing, and portfolio diversification to manage it effectively.
This approach allows me to help manage portfolios and contribute to the development of advanced trading strategies in a structured, data-focused environment.