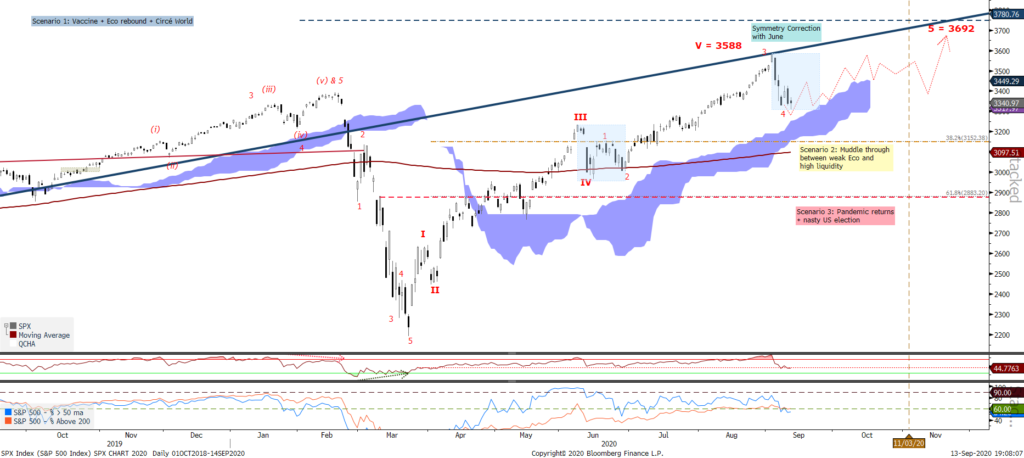
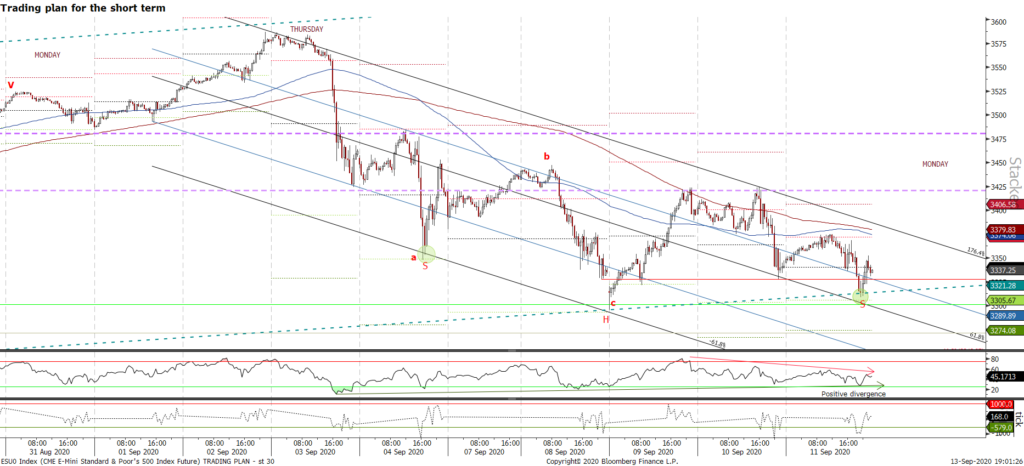
We observe a symmetry (pink rectangle) between the current circa 10% sell-off and the one in June. probably, the comparison may continue for the outcome : UP. There is currently an inverse head and shoulders forming on the short term with a trigger buy at 3420. 3300 broken would invalidate a rebound a call for a stronger correction.
The daily chart below shows that a stronger correction would send the Uncle Sam index towards 3150 or worse 2883. To the contrary, a continuation of the rise would target 3690 and possibly north of 3900 for the start of 2021.