Real time letter: Santa Claus rally done … short term warning flag emerging …
In this « every day » updated letter, you will find our current view based on our regional matrix, our fundamental convictions and our charts. The current Market Focus are analysed. Then, you will find our major thematics for the year. Quantitative factors and fractals currently driving the market are presented with the weekly change of our quantamental portfolios. Coming events and earnings are also anticipated. This is a very long letter, so just jump where you have some interest.
Julien Stouff, december 2021
Parodos
In light of inflation developments and the further improvement in the labor market, the Fed will end asset purchases in March instead of June. All 18 members said they could see the case for at least one rate hike next year, a noticeable revision up from their September projections showing a 50-50 split on a 2022 rate hike. The updated dot plots, which map out each of the FOMC members’ projections for where rates will be in coming years, show the median member of the committee projecting three rate hikes with the Fed funds rate going from zero now to 0.75% next year, another three in 2023 to 1.5% , and another two in 2024 to 2%. As we mentioned in the « Art of Tragedy », tapering and coming rates hikes create volatility, with SPX realized volatility at its highest in 18 months before the Santa Claus rally, but should not derail in itself the bull market in normal times.
There still is an enormous amount of cash on the sidelines or in bonds, and there were too many bears – last week’s American Association of Individual Investors survey showed bulls down 3.5 points to 25.2%, while bears jumped a whopping 9.0 points to 39.3%. We will have sell-offs and profit-taking along the way, but the S&P is possibly headed towards 5000 in 1Q 2022. There has been a contrarian bullish sentiment signal on Nov 30th, with SPX touching 4497.5 low – which marked the start of a strong reversal level for a December rally.
Then, the S&P500 has reached 4809 and now a short term contrarian bearish signal has flashed on December 29th. This forced us to reduce our net exposure by selling a few names and shorting 5% of our SC US quantamental Shorts.
The continuation of the rally will depend on How these dynamics play out as Fed tapering begins and markets test the ‘flexibility’ of the Fed’s policy on whether inflation is transitory or not. In the meantime, Our regional Matrix is still in a bullish configuration as well for the medium run than the short one.
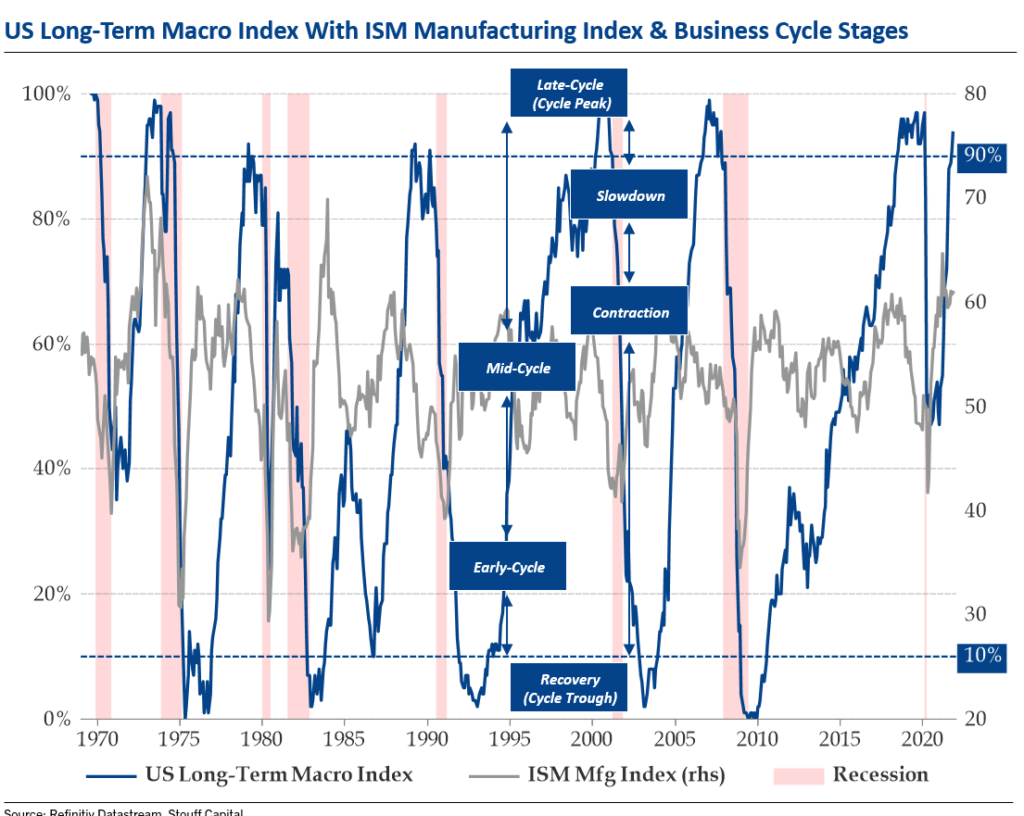
Then, we are worried about the traditional business cycle. Once the reopening effect is over (it is constantly being postponed by variants), it will be easy to tip into a recession, as forecast by the right hand chart. The end of the rally relies on when the Fed finally tightens monetary conditions. It did not tighten policy during the pre-Covid growth cycle, and now they are forced to tighten into a potential slowdown. Consolidation may resume early 2022, not just because growth moderately disappoints, but also because policy makers reduce stimulus. Our new colleague Julien Bittel (follow him on Twitter) has developped a weather model to identify economic phases and their implication on which assets, sectors, regions to overweight or underweight. His Season model defines the current cycle as »fall ». Julien right hand chart shows that we are near a transtion to late-cycle with all its nasty consequences when Winter arrives. In the meantime let’s continue dancing on a volcano.
Coming events susceptible to move the market this week can be found here. The main changes of our quantamental portfolios are described below:
Quantamental portfolios – main changes
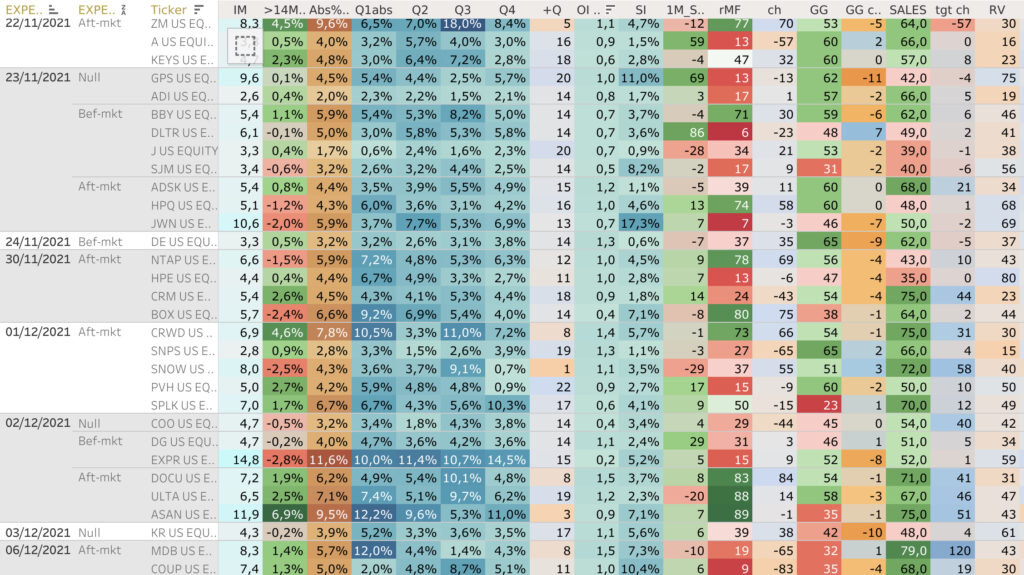
Increase quality, low vol factors, OW Health-care, Staples, reduce US Financials– There is a lot of underperformance in the High valuation infinite duration, tech/ software names like our shorts Atlassian, roku, in fact all Katie Wood Ark etf names. To the contrary, these are those times when we look for outperformance in volatile fast down markets, by increasing the weight of low vol and quality factors in the composition of our quantamental portfolios: we closed some Financials like Bank of America and added AT&T, EL US, WMT US, ABT US, zts us, NRG us, to the US list, novartis, sanofi in the EU quantamental longs. On the short side, we add BMY US (perfect chart below 200 days MA), WDAY, ZM, PTON US while closing Altria. Our regional SC portfolios can be found here. On the top right corner, under Portfolio name, select any of our portfolios (SC SPX long for the US quantamental portfolio, SC SXXP long for the European portfolio, etc…). Then, all the components of the selected portfolio are sorted by sector, with their respective quantitative grades and recent performance measures. These portfolios are updated at least on a weekly basis after the calculation of the quantitative grades of our universe of the most liquid global stocks. First, our algos identify the best companies based on their respective 6 factors, which are weighted with respect to the current market cycle. Then, this purely quantitative crop of the cream is generally halved based on fundamental/ thematic/ risk-reward/ esg or other discretionary purposes.
Main market focus for the near future are enumerated below:
Market focus – What drives markets currently ?
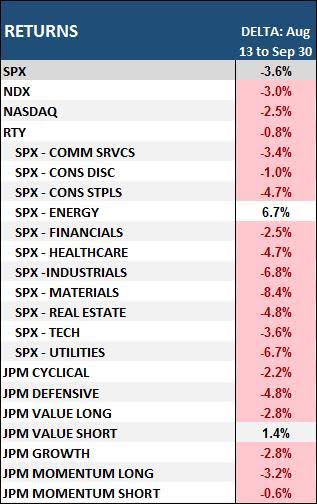
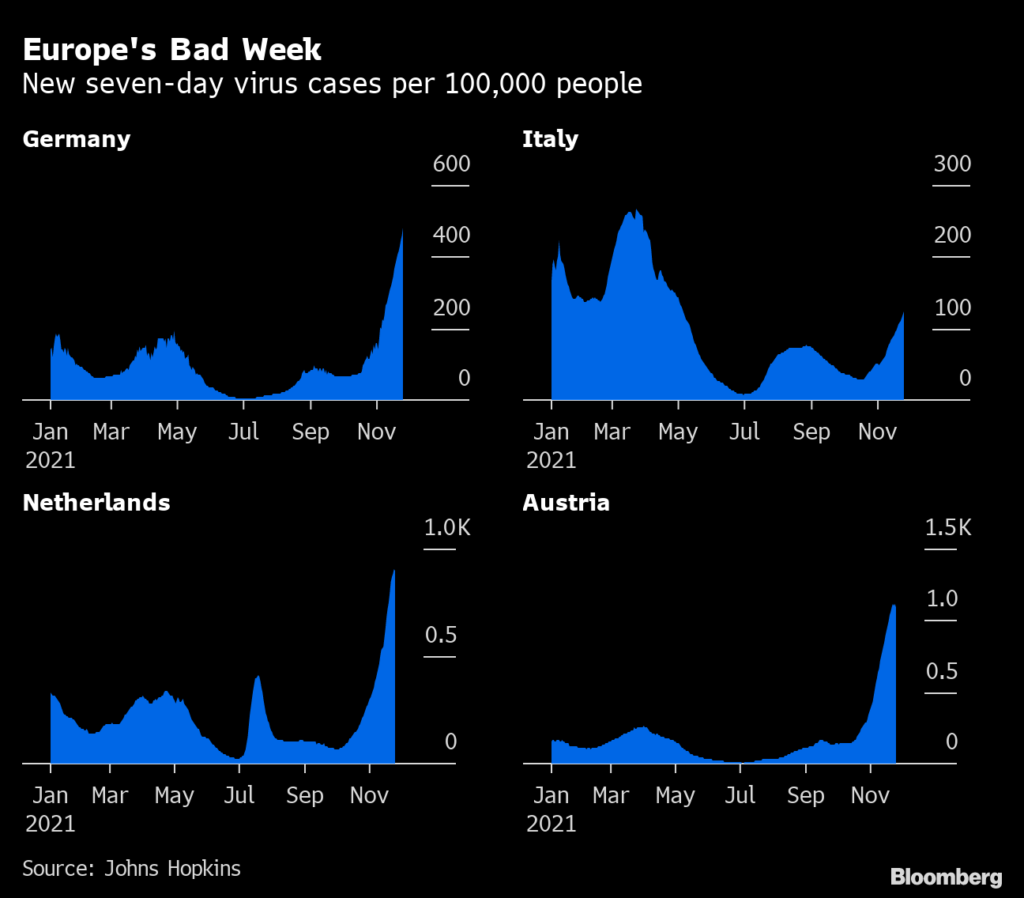
COVID – We now know that Omicron is more transmissible (~3- 4x), but symptoms are milder, vaccines offer decent protection, but boosters will help further. The apparent higher risk in children remains a concern. The largest downside risk from Omicron comes from the potential for US school closings, which would be risk-negative This feels like a black swan event but it is worth monitoring the potential impacts on the labor markets, as child care has been a headwind to labor force participation normalization. For markets, the most comparable period with the Delta variant appears to be mid-August to end-September. On right hand table, there is a sample of returns during that period:
FISCAL TAILWIND IN PAUSE – Senator Joe Manchin said he won’t support U.S. President Joe Biden’s $2 trillion economic agenda as it stands, saying his party hasn’t made real changes to the legislation during negotiations. Democrats have spent months drafting and revising the package, called “Build Back Better,” to win Mr. Manchin’s support, which they need to pass the bill through the 50-50 Senate. The biggest sticking point is on the size. Biden wants $2T+ and Manchin seems anchored to $1.5T – $1.8T with child tax credit likely has difficulty being implemented. Corp taxes unchanged and this may mean that 15% global minimum is not implemented either.
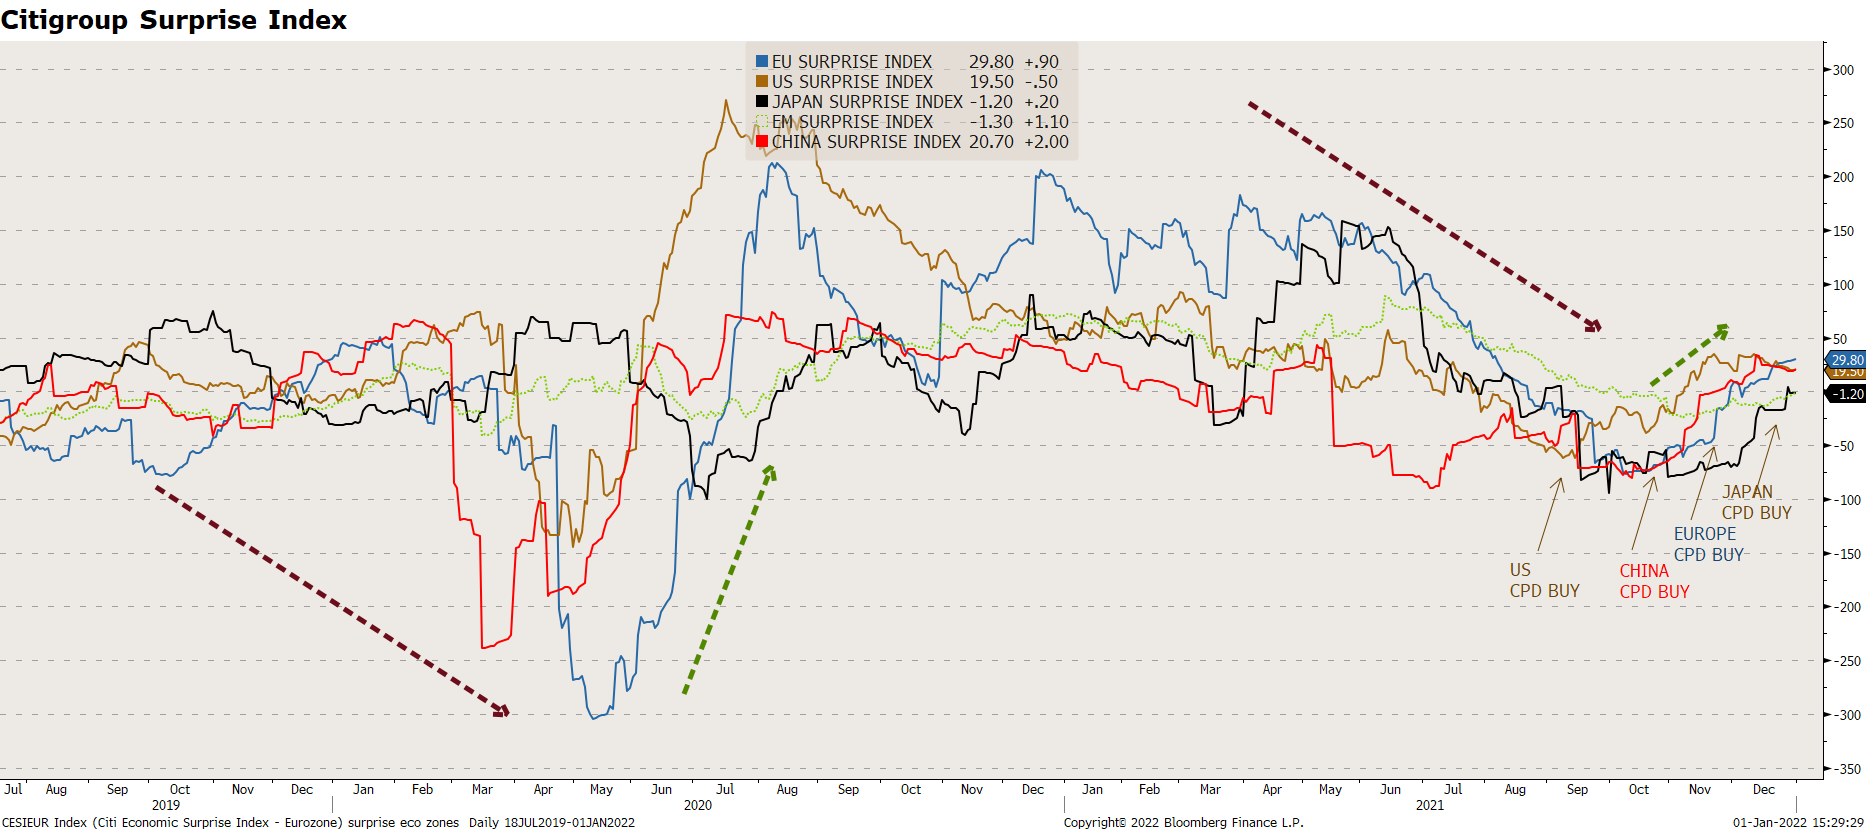
ECONOMIC PEAKING BUT WIGGLING AROUND A HIGH PLATEAU – All regions cycles (see chart below) are showing signs of reaccelerating. Indeed, there is a bullish CPD (Change point detection on chart above) on all our regional Economics grade, triggered by a rebound of more than 50 from its low. For instance, in USA, the jobless claims continued to push lower, signaling that the labor market keeps recovering. Global capex surged out of the pandemic, leading the recovery – and the outlook is strong. Expect global investment growth at 8.1%Y this year, the highest in our 25-year sample period, followed by 5.3%Y in 2022, supported by strong aggregate demand, low interest rates, and public sector funding infrastructure and green initiatives. The consumer is still far more active than many had projected that they would be in aggregate with five million jobs still left unrecovered.
LIQUIDITY PEAKING BUT STILL VERY HIGH – Central bank policy should still remain accommodative with an additional ~$1.1T in global DM CB balance sheet expansion through YE22. While inflation will remain a recurring theme, there is a compelling case to be made for inflation rotation rather than broad-based acceleration in prices (i.e. some segments of inflation remain firm while others soften). Record corporate liquidity and strong fundamentals should continue to drive capital investment, inventory re-stocking, shareholder return, and M&A activity. While there have been sporadic setbacks with COVID-19 variants (e.g. Delta, Omicron), this needs to be seen in the context of higher natural and vaccine-acquired immunity, significantly lower mortality, and new antiviral treatments. With this in mind, the key risk is a hawkish shift in CB policy, especially if post-pandemic dislocations persist (e.g. further delay in China reopening, supply chain issues, labor shortages continue). ECB programmes have close to €480bn of net purchasing power combined until the end of March 2022. In US, M2 money supply is still growing at 13%, down from a peak at 27%. That excess liquidity could offset the Tapering of QE purchases from $120 billion a month down to zero next summer.
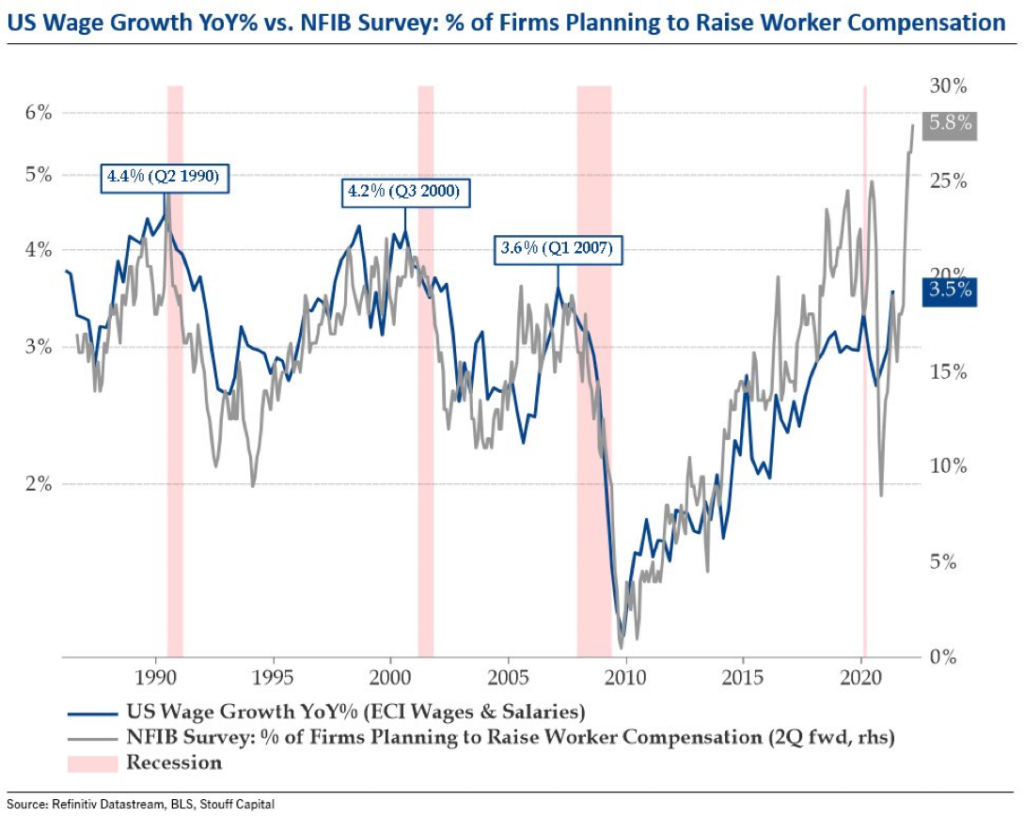
INFLATION RISING – Inflation has overtaken Covid as households’ top concern: survey-based measures of inflation are materially higher as supply shortages are spilling into the real world via Nat Gas prices, labour shortages and ongoing disruption in used car prices..The right hand chart shows What late-cycle looks like in with Wage inflation. According to the latest NFIB survey, a record no. of small businesses are planning to raise worker compensation. The survey leads wage growth by 2Q & targets >5%. Historically, the pain threshold for margins was ~4%.
Central-bank officials now worry that rather than simply threatening to curtail economic growth, a surge in Covid-19 cases could also prolong high inflation. This should create a global tightening to face inflation: indeed, Central banks that leave their policy rates unchanged when the Fed is tightening policy run the risk of big falls in their currencies, which stokes inflation by raising import prices.
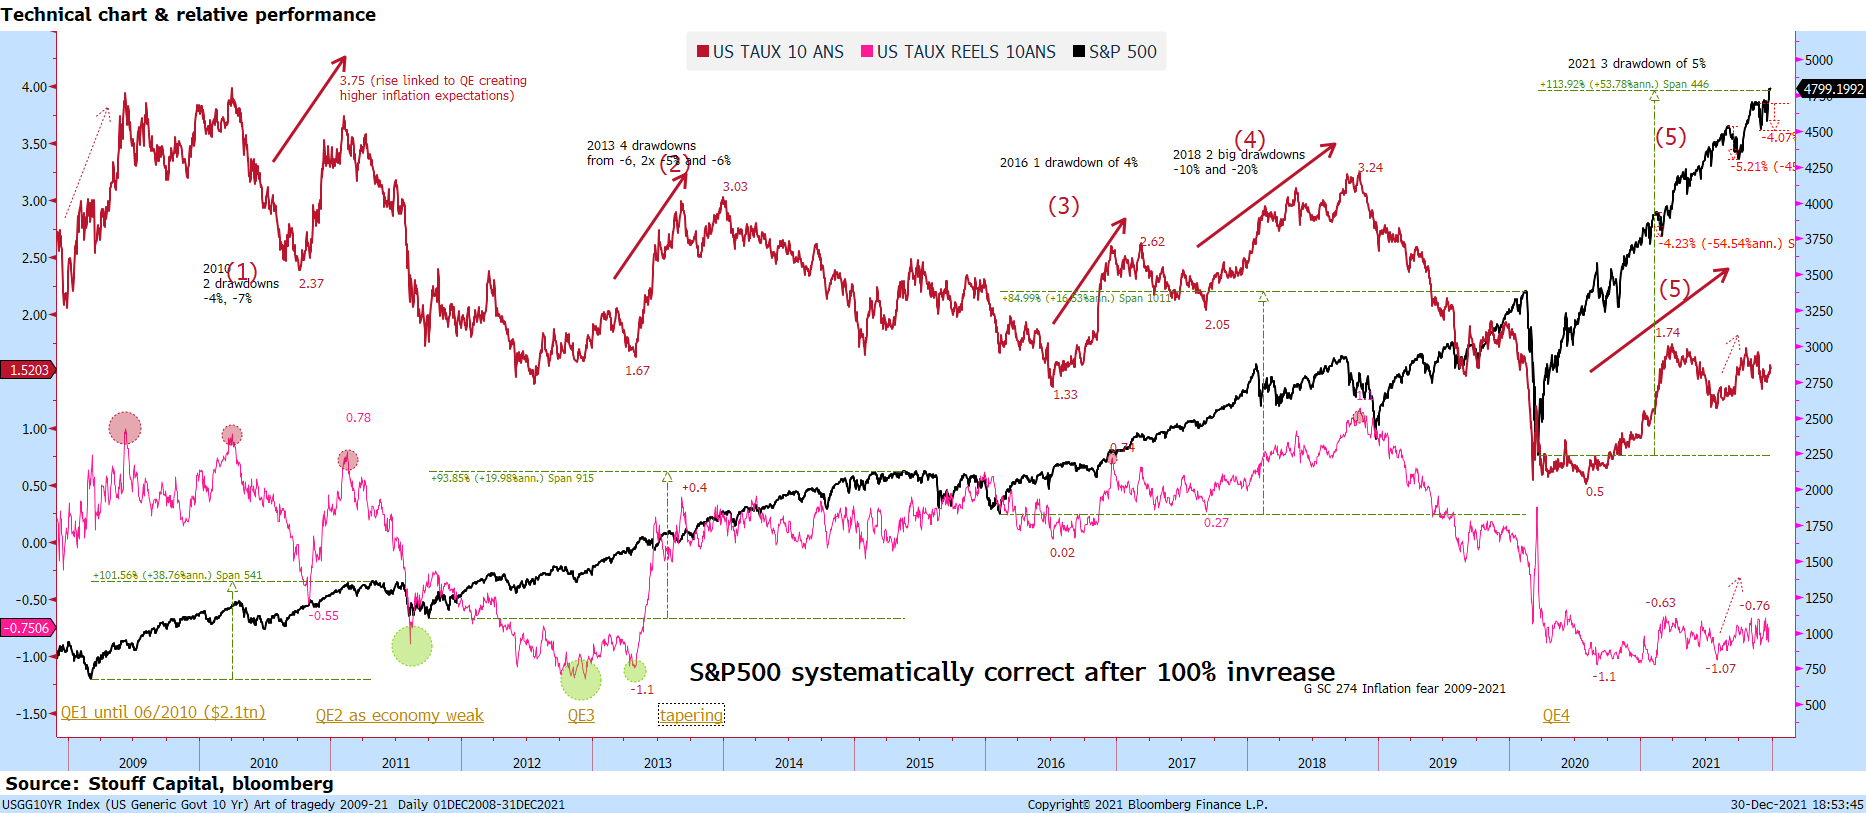
Our research report The Art of tragedy analysed in March 2021 what the impact can be on stocks from the start of tigntening conditions; the below chart shows that the Art of Tragedy has not derailled bull markets but instead created many intermediate corrections:
Moreover, bond yields have not reacted in the way investors thought they would in the start of tightening: they are in fact down with the 10Y Treasury yield back up closer to the 1.45% mark, with the real 10y yield between -0.70 and -0.90, currently -0.85. The Federal Reserve is laying the groundwork for the start of a cycle of interest-rate hikes that the bond market warns might be unusually constrained in how far it can go, setting the two on a collision course where one will eventually have to give. Treasuries yield curve — or the spread between short-term and long-term interest rates — looks set to be the flattest at the beginning of a Fed tightening cycle in a generation if the central bank begins raising its benchmark overnight rate in mid-2022. But unless inflation or long-term rates change dramatically, the yield curve suggests that a series of Fed hikes in 2022 could cause an inversion, where short-term yields are higher than longer-term ones. That’s something that precedes recessions and has caused policy makers to lean against further tightening.
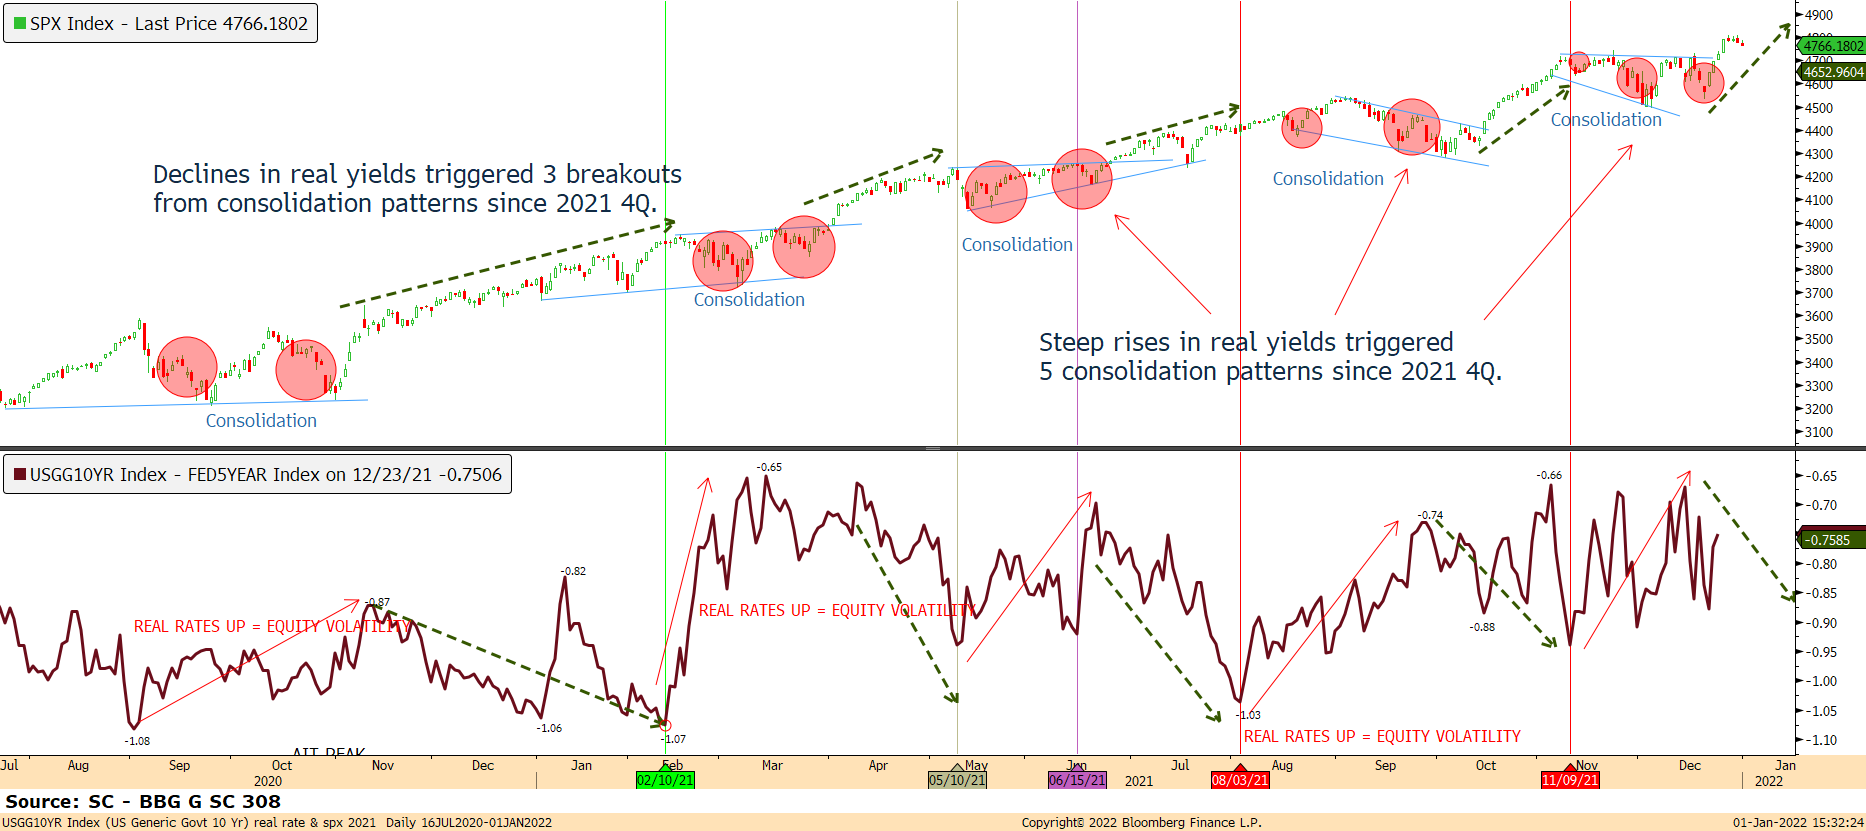
The chart below is important for us to monitor the current market regime. It shows that US equities have consolidated when real yields (dark red bottom hand chart) are on the rise, and any pause or real yiel falling again has induced steep rallies. Since November 9th, real yields have bottomed at -0.95, and in a very volatile manner, rose to -0.67, now -0.75%, corresponding to a period of consolidation for US equities. Since mid-december, the Santa Claus rally has been associated with lower real yields.
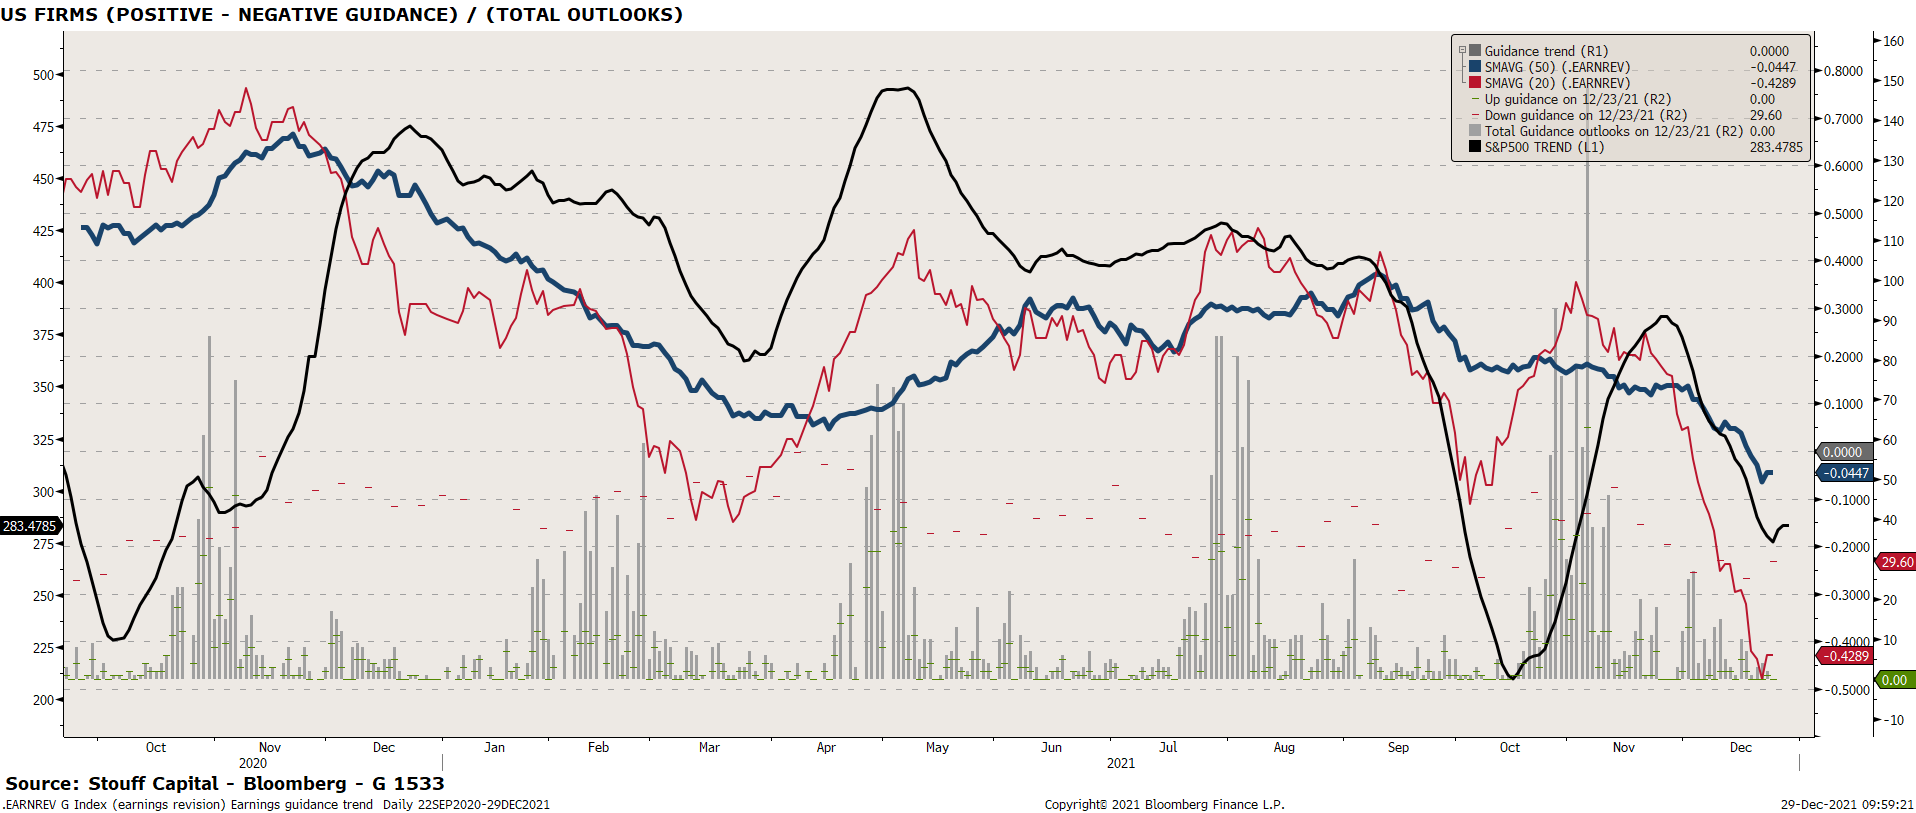
PEAK EARNINGS BUT GOOD 4Q SEASON– 4Q 2021 Earnings season was a very good »crue ». Earnings delivery was robust with an EPS growth at +42% y/y in the US, and +44% y/y in Europe, that came in better than consensus expectations, with both regions recording a positive surprise factor of 10-11%. please go directly to our 4Q EARNINGS analyse here. For the coming 1Q 2022, our upgrades/ downgrades trend indicator has fallen to very negative levels , meaning much more downside guidances on total. While negative, this is usual ahead of coming earning season, after which the ratio more than often rebounds to new high.
CHINA/ EVERGRANDE – Evergrande and Kaisa Group Holdings Ltd. were downgraded on Thursday 09th Dec, to restricted default by Fitch Ratings, which cited missed dollar bond interest payments in Evergrande’s case and failure to repay a $400 million dollar bond in Kaisa’s. After property contract sales by major developers having fallen by -21% yoy in November vs – 19% in October, the Guangdong provincial government and PBoC/CBIRC/CSRC took action. Among others, one notable item was CBIRC’s stated support for initial/upgrade home buyers, a first since China’s 2014-2015 round of property stimulus. China cut RRR in December to support the real economy and SMEs. While there is much to be debated around regulation and debt-related systemic risk within China, what is most germane to US bull v. bear arguments is the presence of Chinese stimulus. China has injected some liquidity into markets and they should continue so for 2021Q4. Evergrande not completely blowing up is risk-positive.
In Japan, Fumio Kishida won race to become Japan’s next prime minister, and Japan’s 55.7 trillion yen ( ~$490 billion) government package is the largest government stimulus ever, and the Cabinet office estimates it represents 5.6% of Japan’s GDP. ~$175 billion will be attributed as cash handouts that go directly into the pockets of consumers. This headline comes at a time where seasonality plays to Japan’s favor, and adds on to the accelerating narrative for inflation globally.. The recent sell-off offers a great entry point as it was triggered by hawkish commentary on financial income taxation by new PM Kishida, which has been denied. see lower in the letter.
What charts tell us
The November 26th variant news triggered a correction to 4495. Then, our SC US Sentiment indicator flashed a bullish contrarian signal, and the rally has re-started. Last week, we saw an impressive thrust in buying interest among a broad swath of stocks. That sent the S&P500 to 4809, before a bearish short term signal emerged from our SC US Sentiment indicator on December 29th. A consolidation could develop after the new year, with a possible target at 4720.
The rally could then continue towards the dotted green line, currently around 4860, and the Reverse Head and Shoulders target is 5000 sometimes in 1Q.
Chart 1: game plan on the S&P500 daily – Reverse Head & Shoulders with 5000 target
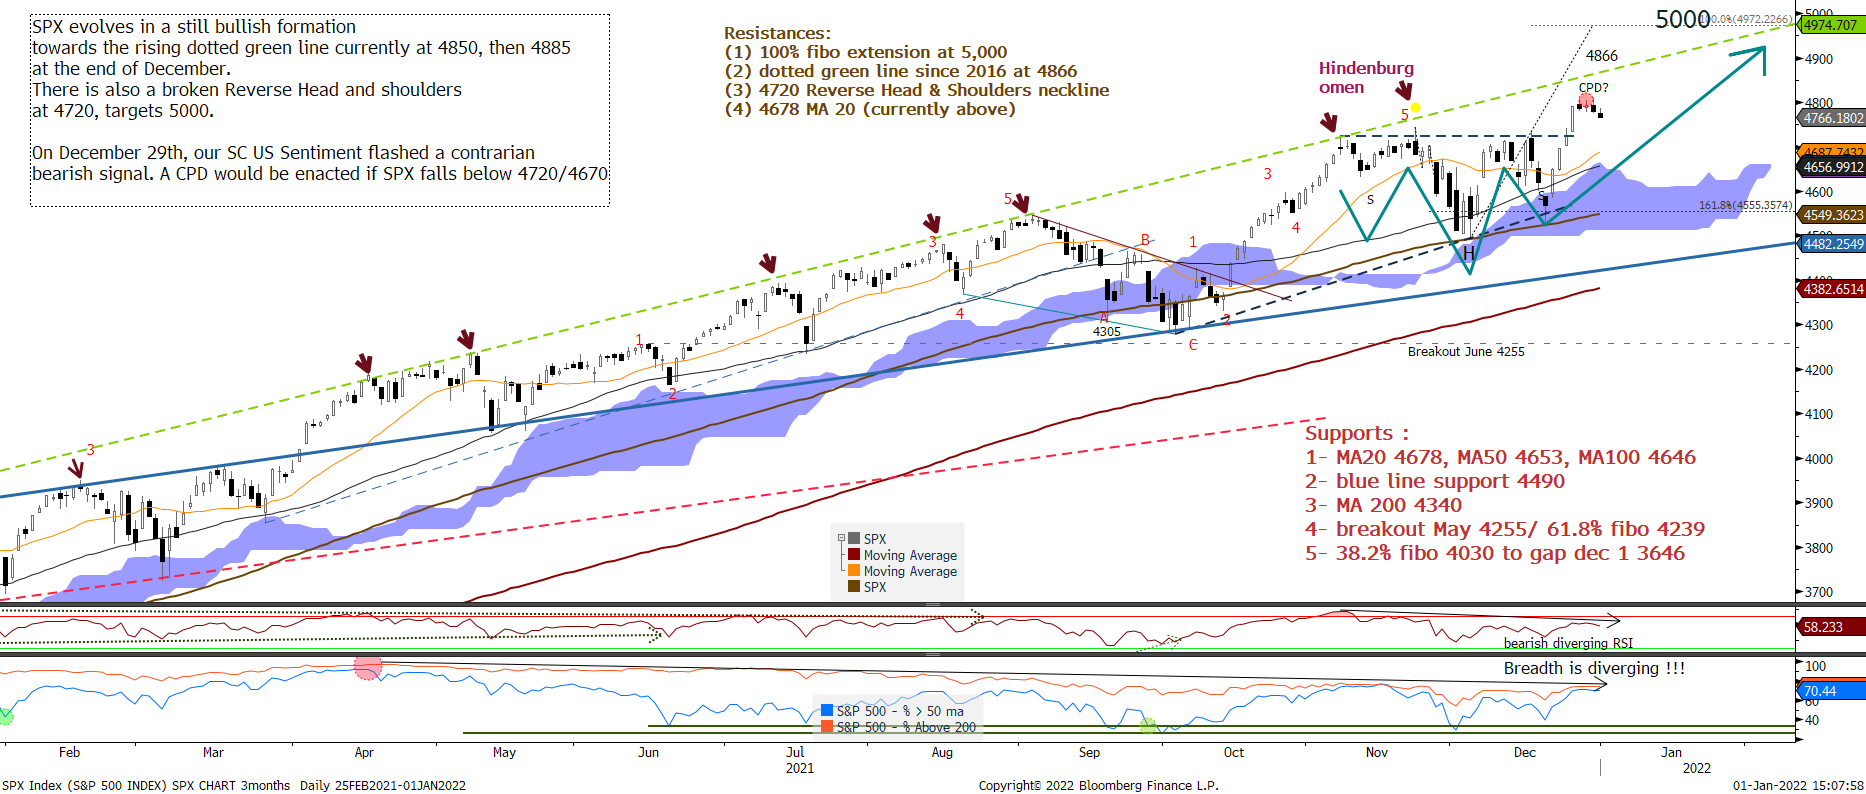
Chart 2: game plan on the S&P500 – Moving to ESH2 – Xmas rally to 4850/ 5000, but cluster of resistances at 4795
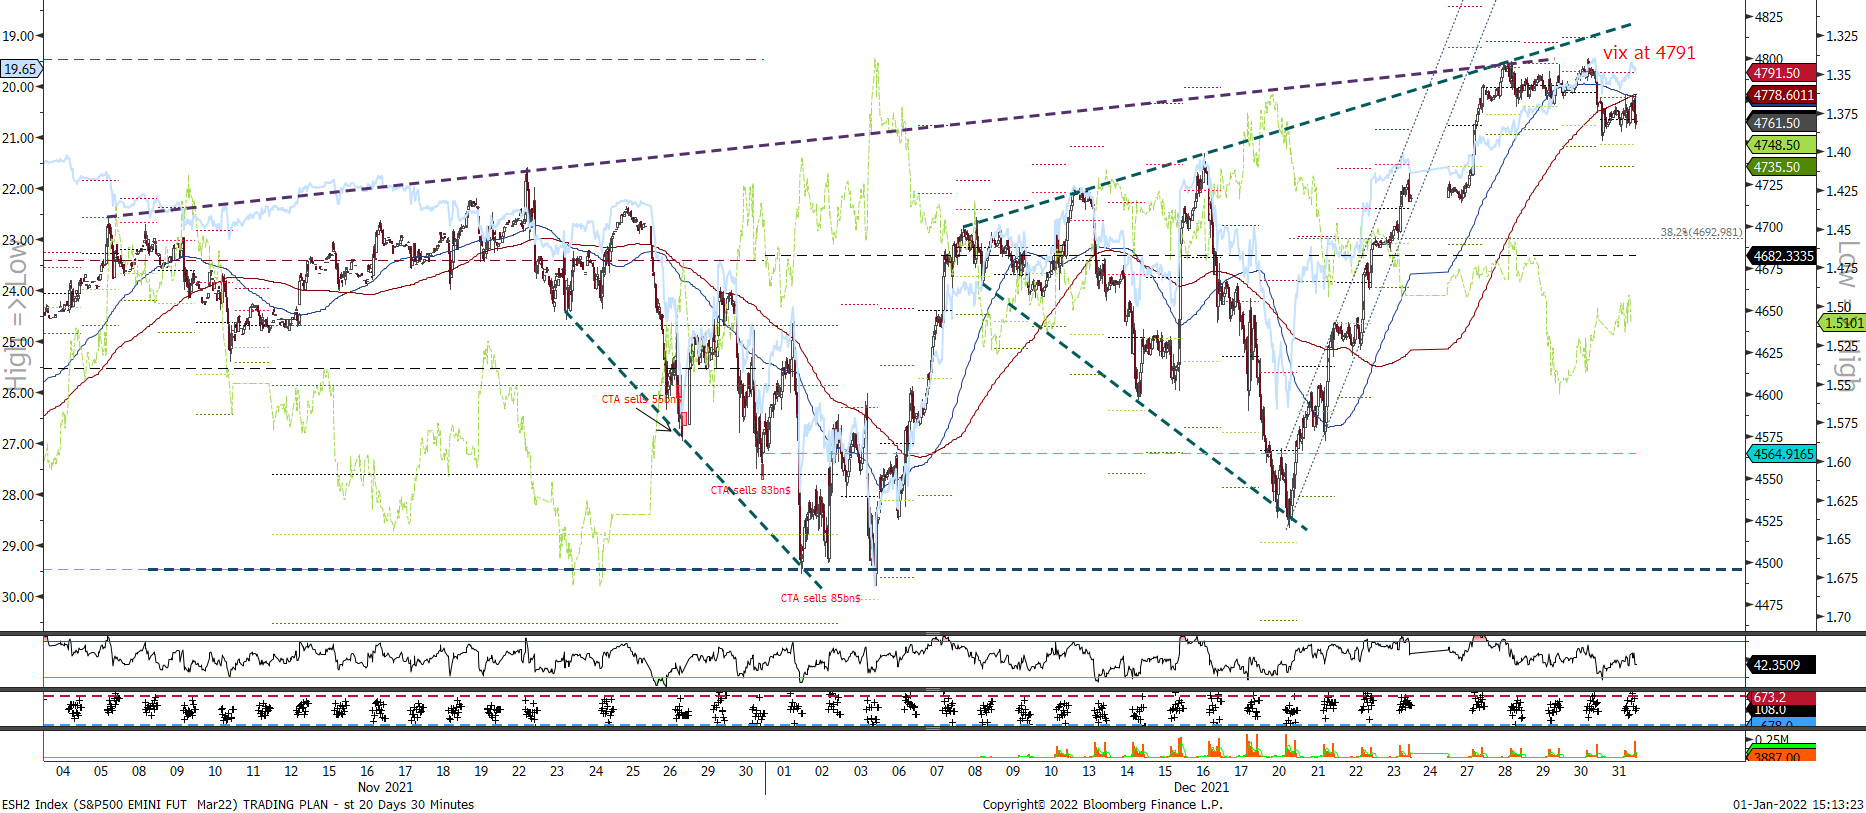
The above intraday chart shows our ESH2 intraday chart. It is evolving in a broadening wedge formation, seasonality became again very bullish after Triple witches option expiration. The break-up of a reverse Head and shoulders created a meltup target towards 4810. But (written on Dec 28th) there is a cluster of resistances around 4795 that could be hard to break, and a contrarian bearish signal on December 29th that just flashed.
Sentiment – Not anymore supportive for the short term
We use our Sentiment grades as a contrarian tool: when investors are greedy with their too exuberant Sentiment, we add downside convexity (but out the money Put) when markets are bullish and/ or reduce our long. We can even go short if a CPD (Change Point Detection) condition is enacted. To the contrary, when investors are too pessimistic, we add some longs in a bullish market, or even pass net long in a bearish market.
The Santa Claus rally has been supported by a wall of worry that is now over: indeed, a short term contrarian bearish signal has been flashed by our US and European short term Sentiment indicators. Our medium term Sentiment indicator is neutral, showing no real danger for the coming days.
Chart 3: SC US Sentiment indicator, bearish short term signal but neutral on the medium run
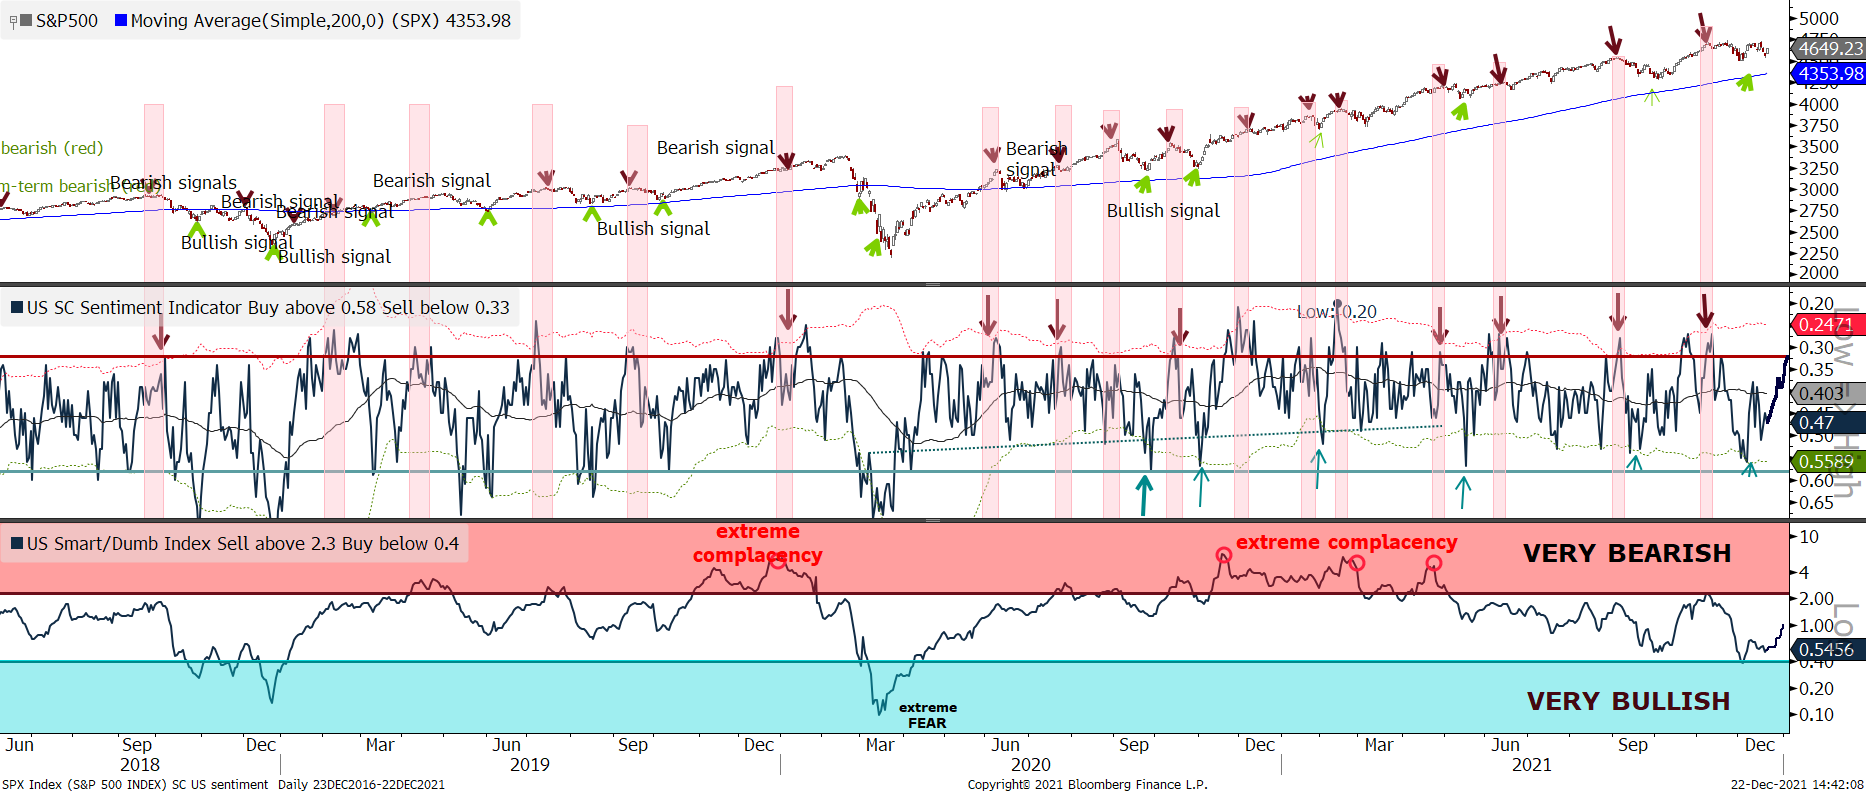
The chart above shows our two SC Sentiment indicator, one for the short and the other one for the medium run. Let’s analyse what they told us this year: Sentiment toward stocks reached its peak soon at the end of 2020 (denominated extreme complacency in the bottom panel of the above chart). The speculative orgy heading into February coincided with a peak in some higher-risk assets but not the major indexes. Even as those indexes have trudged higher, sentiment has become less and less optimistic. In particular, the American Association of Individual Investors have been full of fear. This is only the 2nd year time the inception of the AAII survey that the Bull Ratio was negative for the first 4 weeks of December. It has finally reversed and optimism is back... Time to reduce a bit !
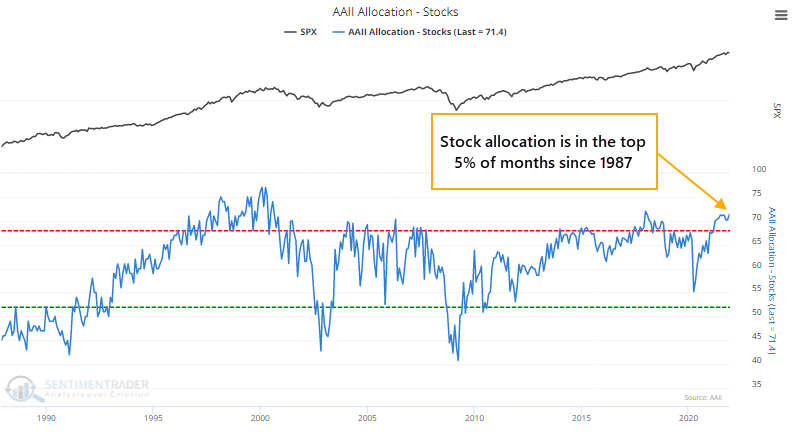
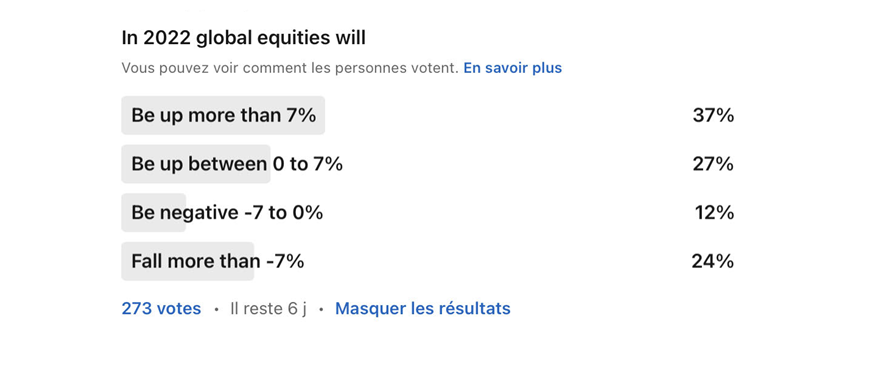
There is often a disconnect between what these folks say and what they do. Despite tepid optimism in recent months, their stock allocation is near all-time highs: Their monthly allocation to assets tends to get stuck at extremes for extended periods, and using it as a guide to future returns is tricky. When there was a wide disparity between their allocation and their opinion, it favored their allocation. Besides the financial crisis, their high stock allocation was rewarded more than their pessimism. While Main Street may be pessimistic, Wall Street isn’t – analysts are busy upgrading price targets, and Strategists’ average price target for the S&P 500 over the next year is nearly 5% higher than where the S&P was on Monday, suggesting the index is undervalued (see below left chart). Our own Linkedln survey confirms this bullishness with 64% of respondants bullish for 2022 (see below right hand chart). A contrarian mind would find that negative, but statitics show that was mostly a good sign for forward returns, especially in the first couple weeks of the new year:
Among amateur investors, the once-raging gaming spirits are ebbing. Tracking data on small-lot options trading, a proxy for retail activity, it can be found that their participation has been ticking lower on the call side while ramping up on the put side. When investors are bullish on stocks, they buy call options to bet on rising prices. Conversely, when they are bearish on stocks, they buy put options to bet on declining stocks. The put/call ratio can be used as a contrary indicator to identify an environment where sentiment has become too pessimistic on the future direction of stocks. When opinions become too bearish, stocks tend to rally.
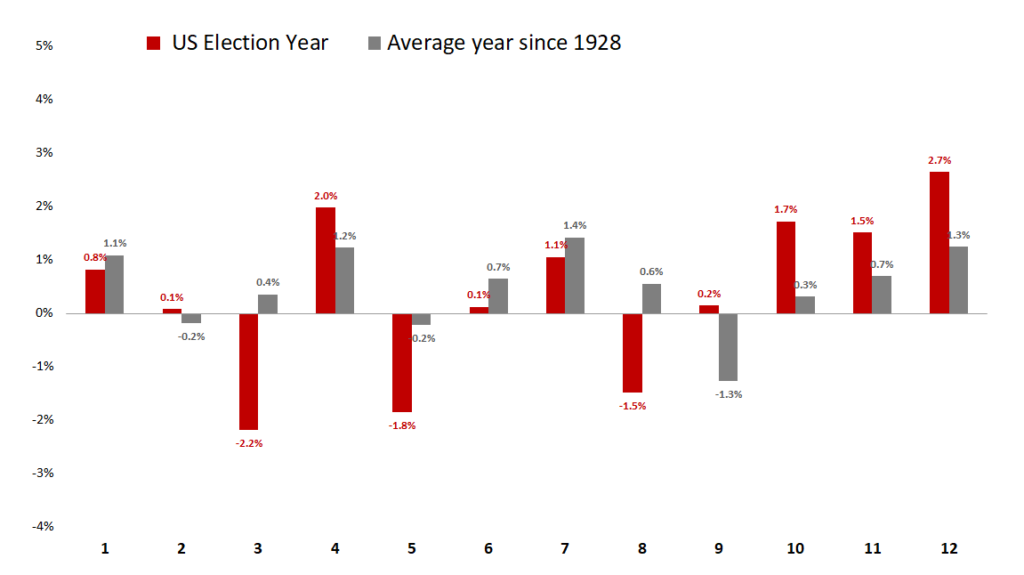
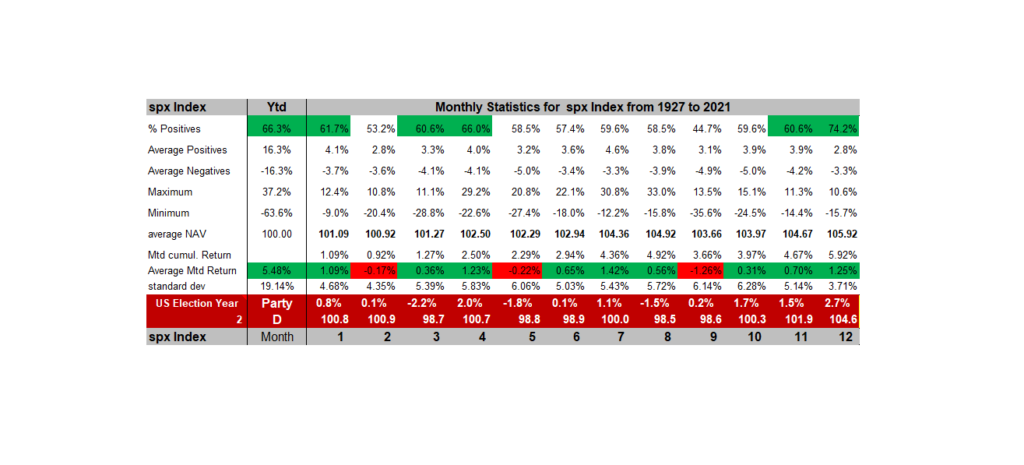

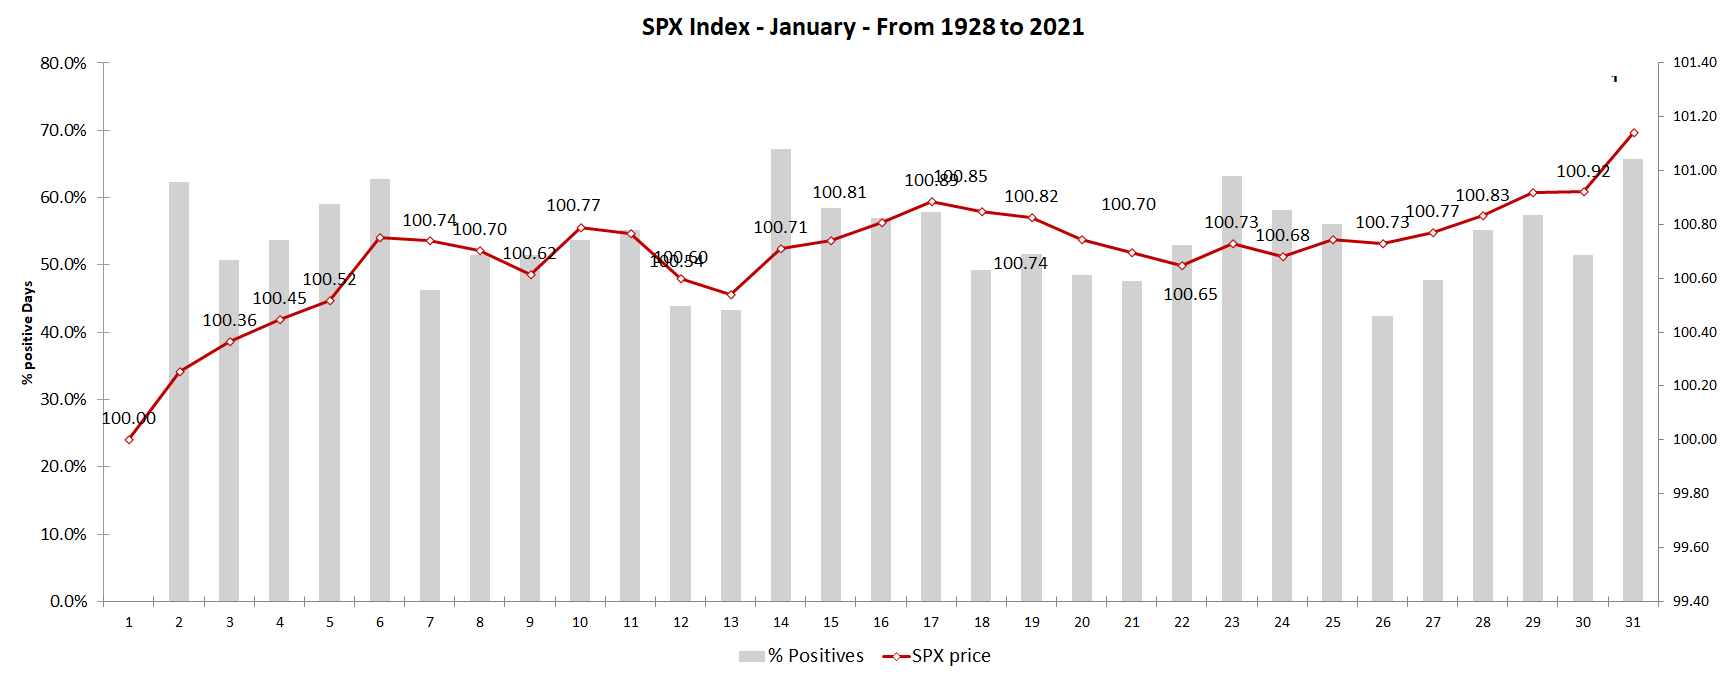
We are still in one of the most bullish seasonality for US and global stocks until the end of january. Seasonally, the first 10 days of January are bullish, up 0.77% on day 10 with strong probabilities (62.3% up day on the first day of the year and 62.7% up days for the 6th day of the year). Then it plateaus. When adjusting statistics with the second year of a Democrat President (yes there are strong differences between who is presiding), January is up 0.8%, but the 2 year is not great up 4.6 on average, with very bad months in March (-2.2%), May (-1.8%) and August (it is going to be a nice summer again…). All these statitics on seasonality can be found here.
Global charts
With respect to global equities, the chart of the MSCI World shows a similar picture than the US with a fast correction towards the 200 days moving average, followed by a rebound towards ATH ?
Chart 4: chart on the MSCI World daily : Correction is over , ATH coming
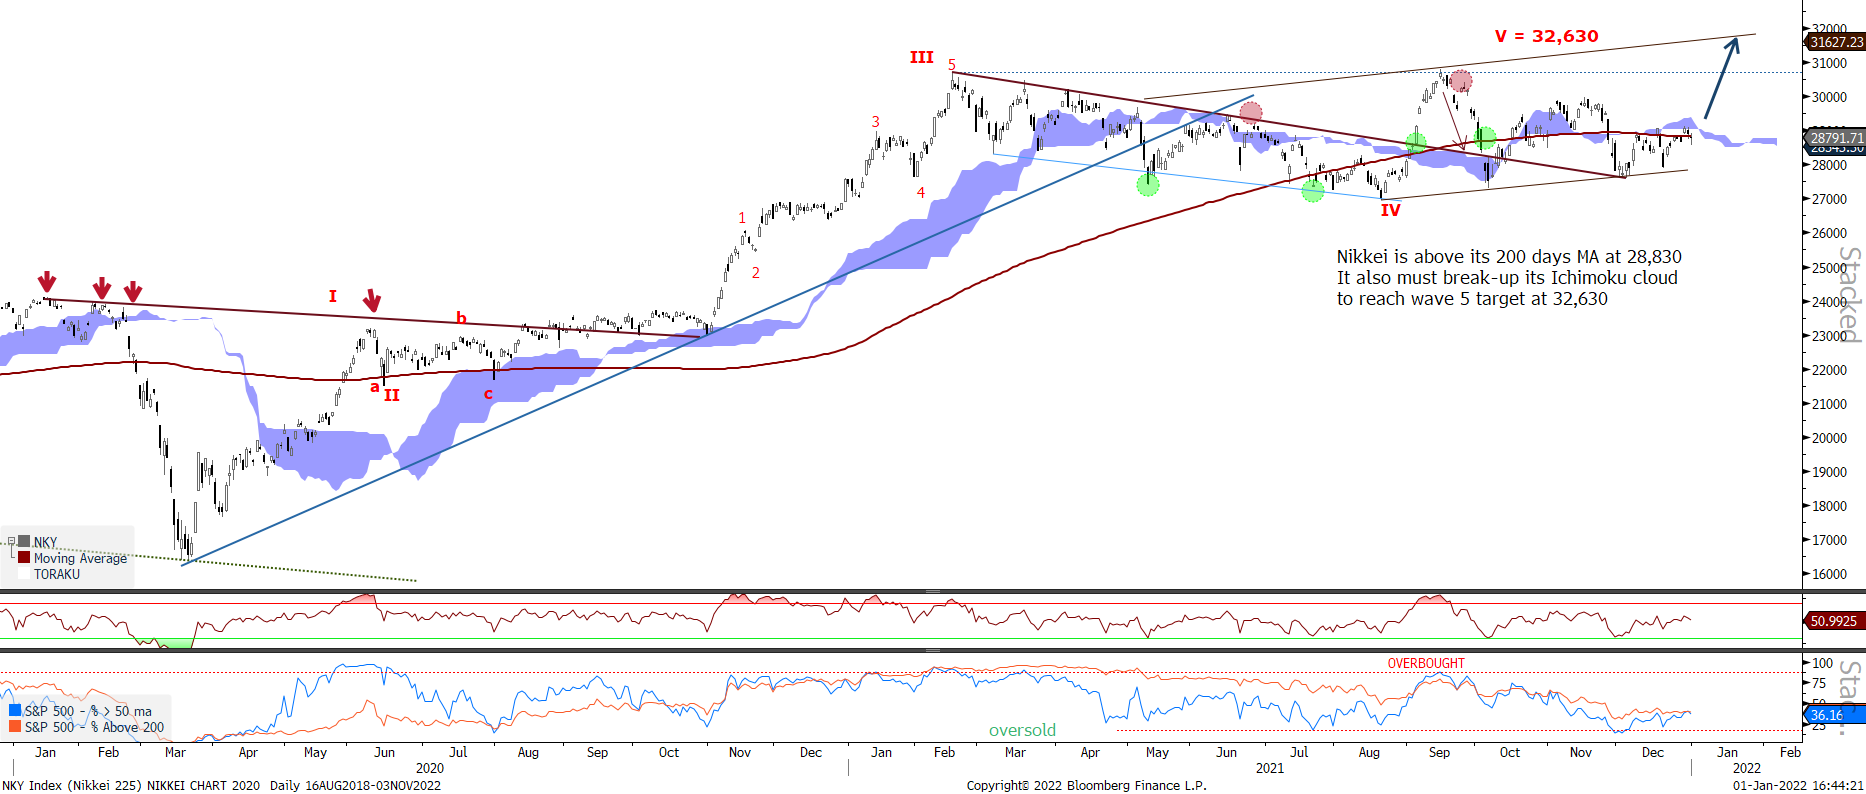
The Nikkei may have finally found a fundamental reason to close its under-performance versus the rest of the World. Indeed, the recent National Election should be a good catalyst for Japanese equity as the LDP victory is the best choice for positive market impact. Mr. Kishida won the 2nd round against Mr. Kono. He generally follows Abenomics’ expansionary monetary/fiscal policy. LDP wants to stimulate consumption and reopen the economy because it changes people’s mind-set positively easily, and they may have subsidy for consumption like they did last year (e.g. travel expenditure support/ food industry support). Coincidently (or intentionally) Japan lifted lockdown yesterday because of high vaccination penetration rate (60% had 2nd shot) and lowered Coivd new patients. So in the sense, transportation sector (Airlines, Japan Railways), Leisure and Retail (Seven & I 3382 JP, Isetan Mitsukoshi 3099 JP), and Food service related and other consumer related such as Kobayashi Pharma 4967 JP could benefit further reopening trade while Healthcare sector/Clean energy/Digitalization will be also spotlighted potentially according to Mr. Kishida’s policy stance already announced into the LDP election.
Chart 5: chart of the Nikkei – bullish up to 32,630
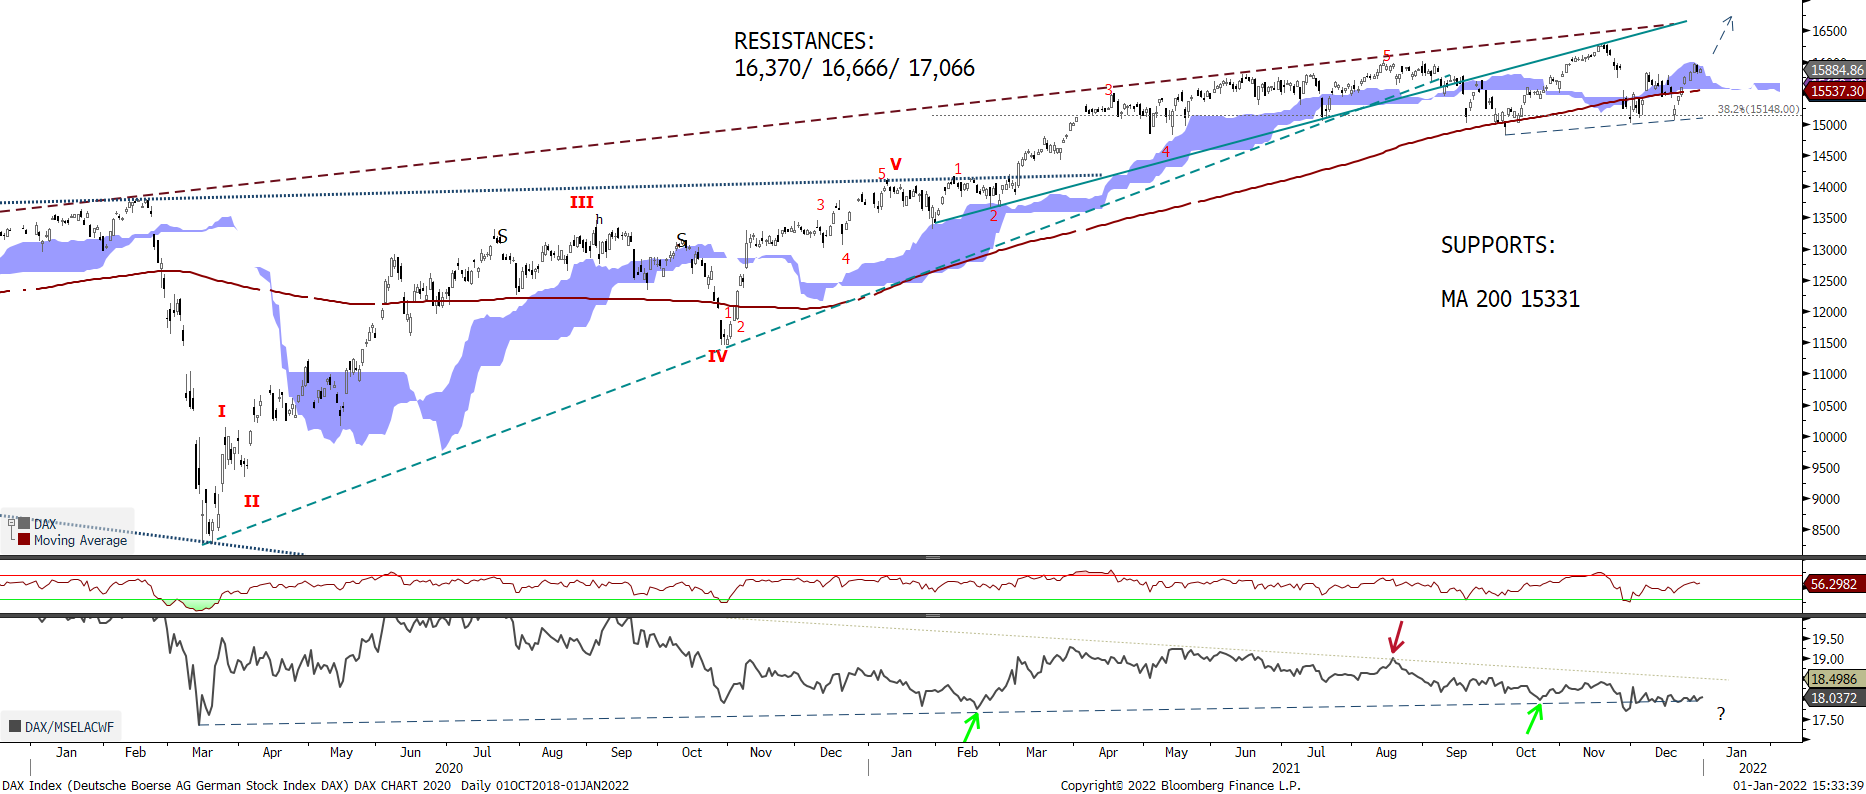
The Dax has continued underperforming global equities, oscillating around its 200 days MA, where we initiated a long trade going into the election. We also initiated a pair trade by going short CAC40 to hedge a tail risk with coming French elections.
Chart 6: chart of the DAX – Bought DAX on 200 MA towards wave V at 16,060/ 16,370/17,066
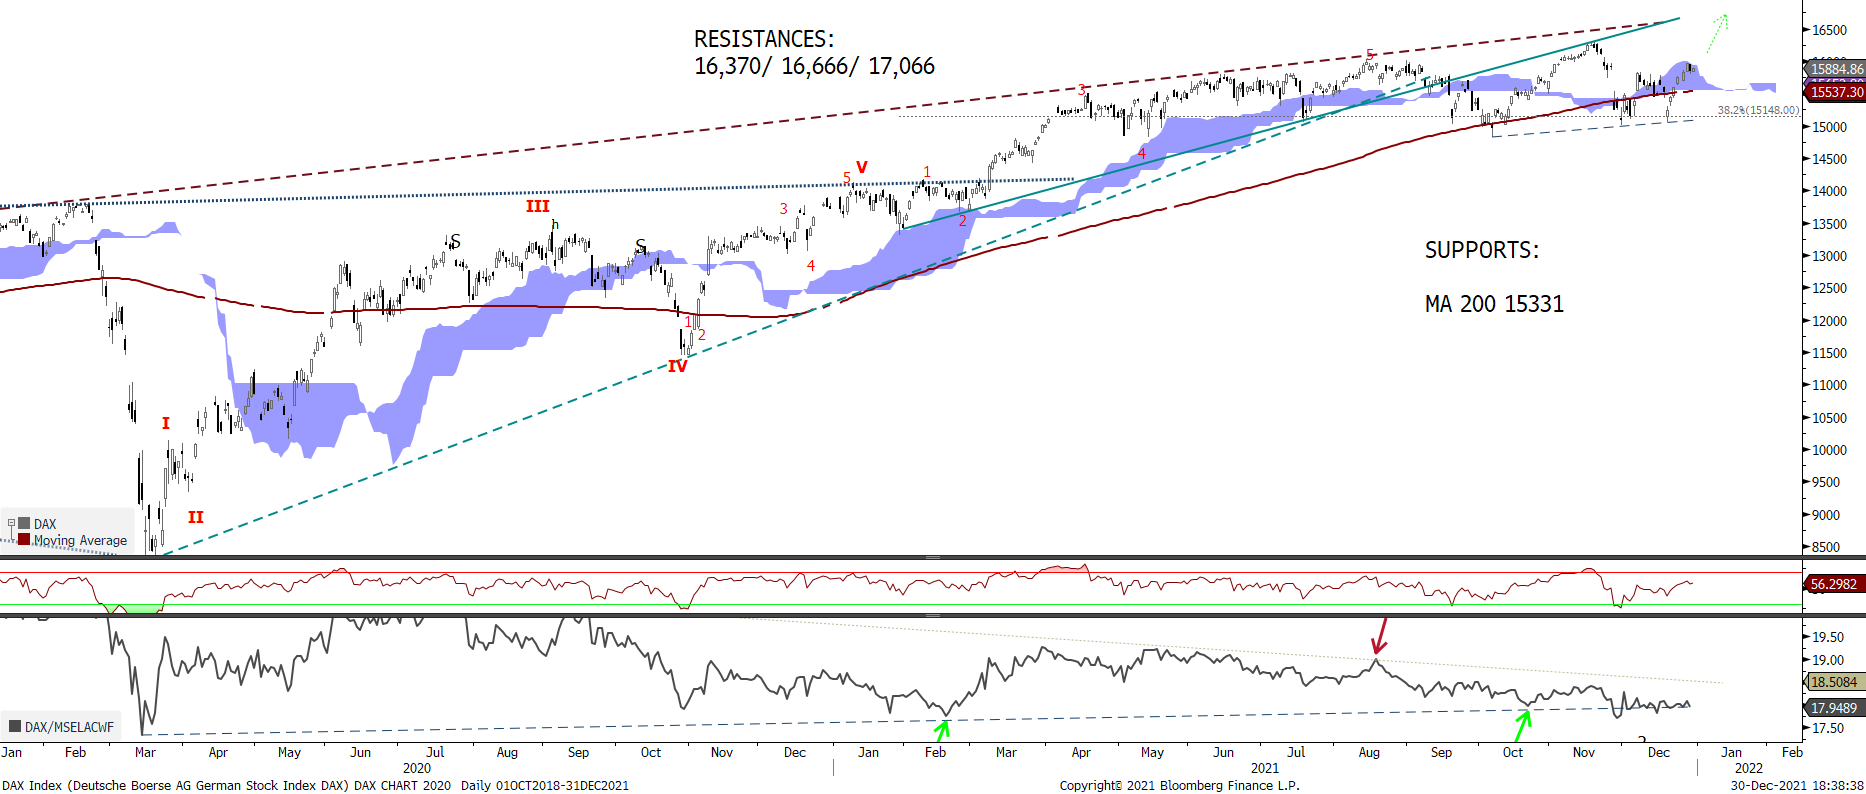
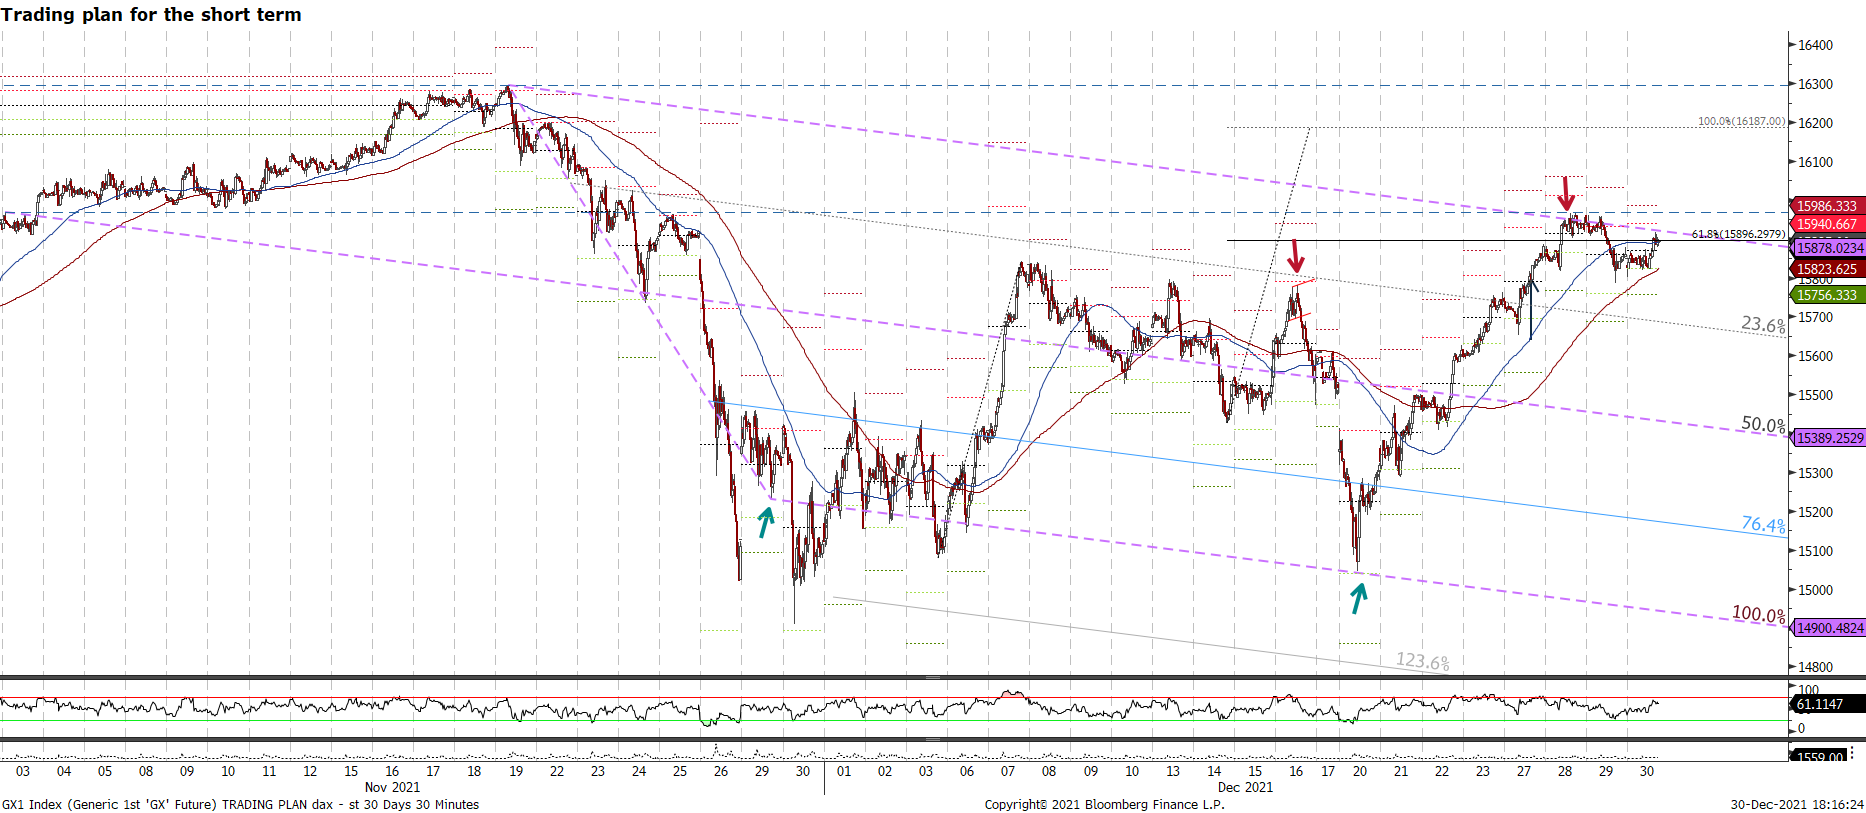
Chart 6b: Intraday chart of the DAX – 15900 reached – net target is 19187
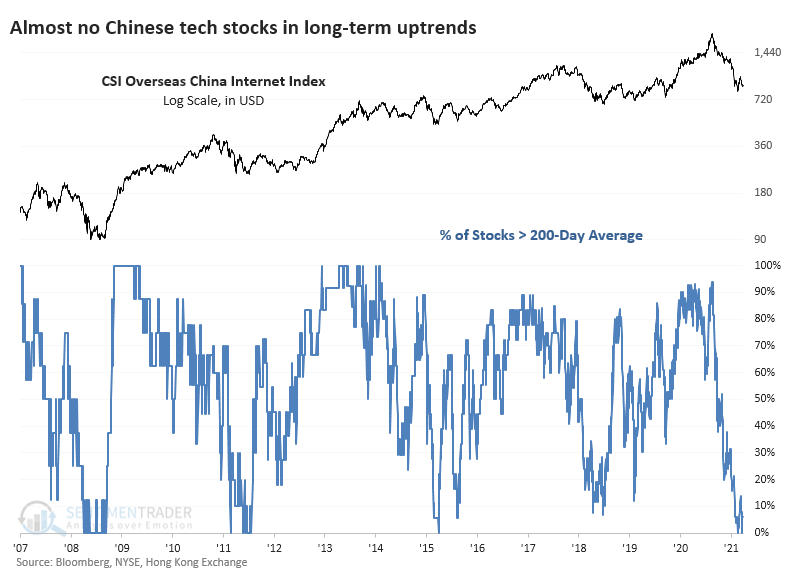
Chinese tech stocks are showing panic-level breadth. The most popular domestic fund for trading Chinese internet stocks KWEB, based on the CSI Overseas China Internet Index, has just over 50 member stocks, and it’s hard to find an uptrend among them. During mid-August, exactly 0% of these stocks were trading above their 50-day moving averages before bouncing. It’s an even uglier picture when looking at the percentage of these stocks in long-term uptrends. In recent days, only 4% of them have closed above their 200-day moving averages, ranking among the very worst readings in available history.
The plunge in late July caused more than 50% of Chinese internet stocks to fall to a 52-week low, only the third time in 15 years that so many have done so at the same time. Not only have they been falling to new lows, but they’ve also suffered gigantic drawdowns. Across the 53 stocks in the index, the average stock is down nearly 60% from its 52-week high. The only period that (barely) exceeded this rout was the depths of the global financial crisis. From a contrarian point of view, this is good news. in fact, Our SC sentiment China Grade is in a bullish CPD posture.
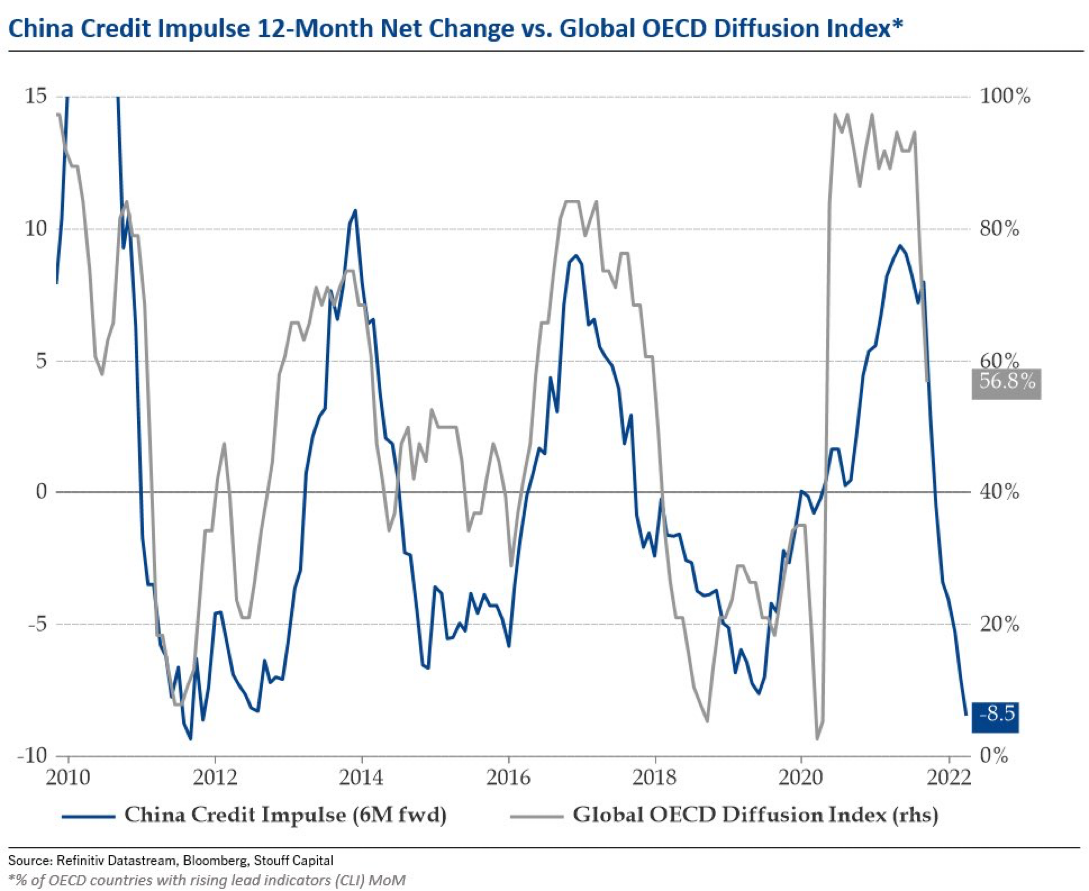
The China Credit impulse 12-Month net change is also at an extreme low level, ready to rebound as shown on the right hand chart:
Thus we are waiting for a frank reversal of Chinese equities to be comfortable again. The chart below shows that the etf FXI is still trying to bottom. To the contrary, our favourite way to be invested in China, the SHCOMP is in the wave 5 of an elliott bullish waves pattern – see chart 8. While economic data may remain on the softer side in the near term (weak credit growth and holiday consumption), signs of policy support are emerging (should help reduce the market’s risk premium). The government announced measures to support property demand and reforms to incentivize power generation : OW on Huaneng 902 and China Resources Power 836, Nari Tech and Xuji 000400ch
Chart 7: fxi us (chinese adr) – bottom process – a long one !!!
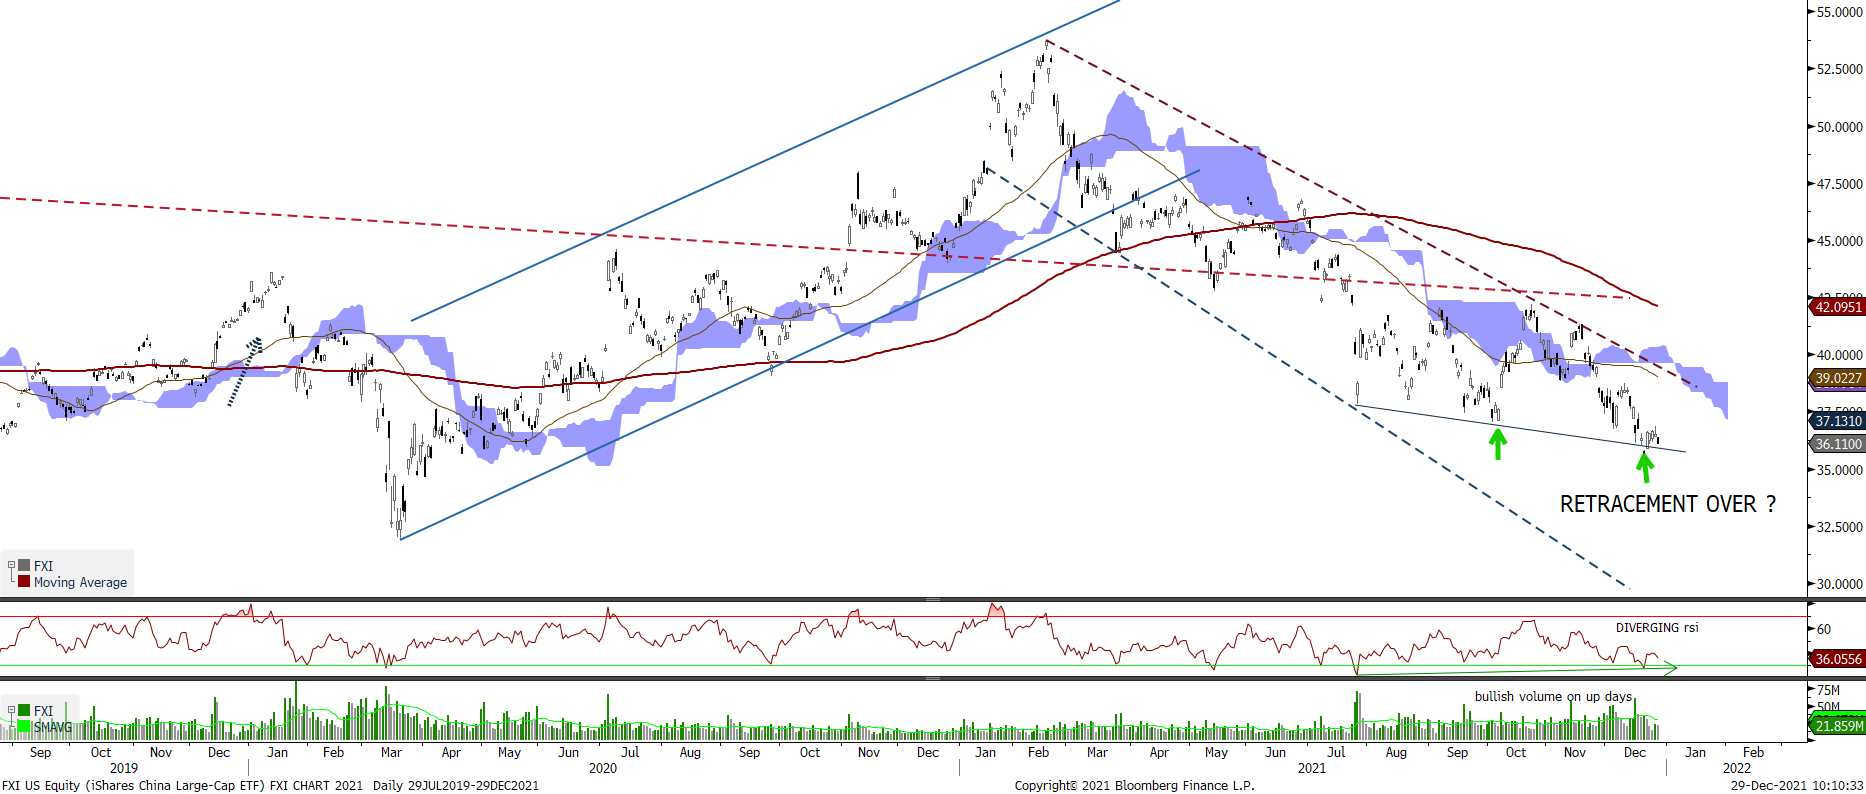
Chart 8: chart of the Shangai stock exchange – climbing higher towards its wave V
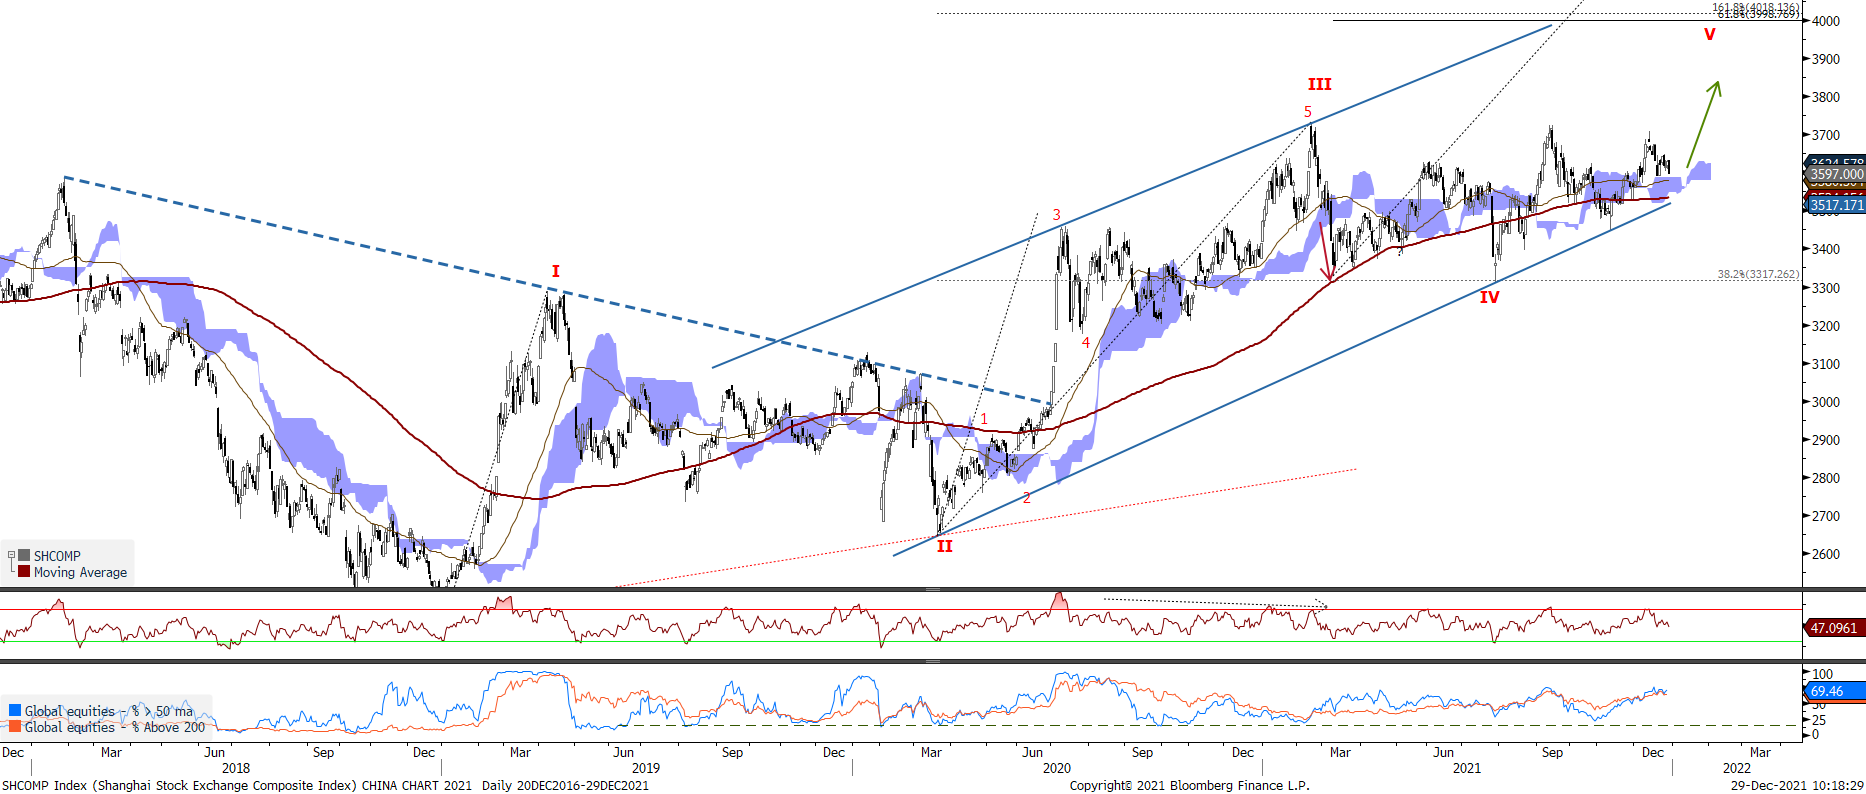
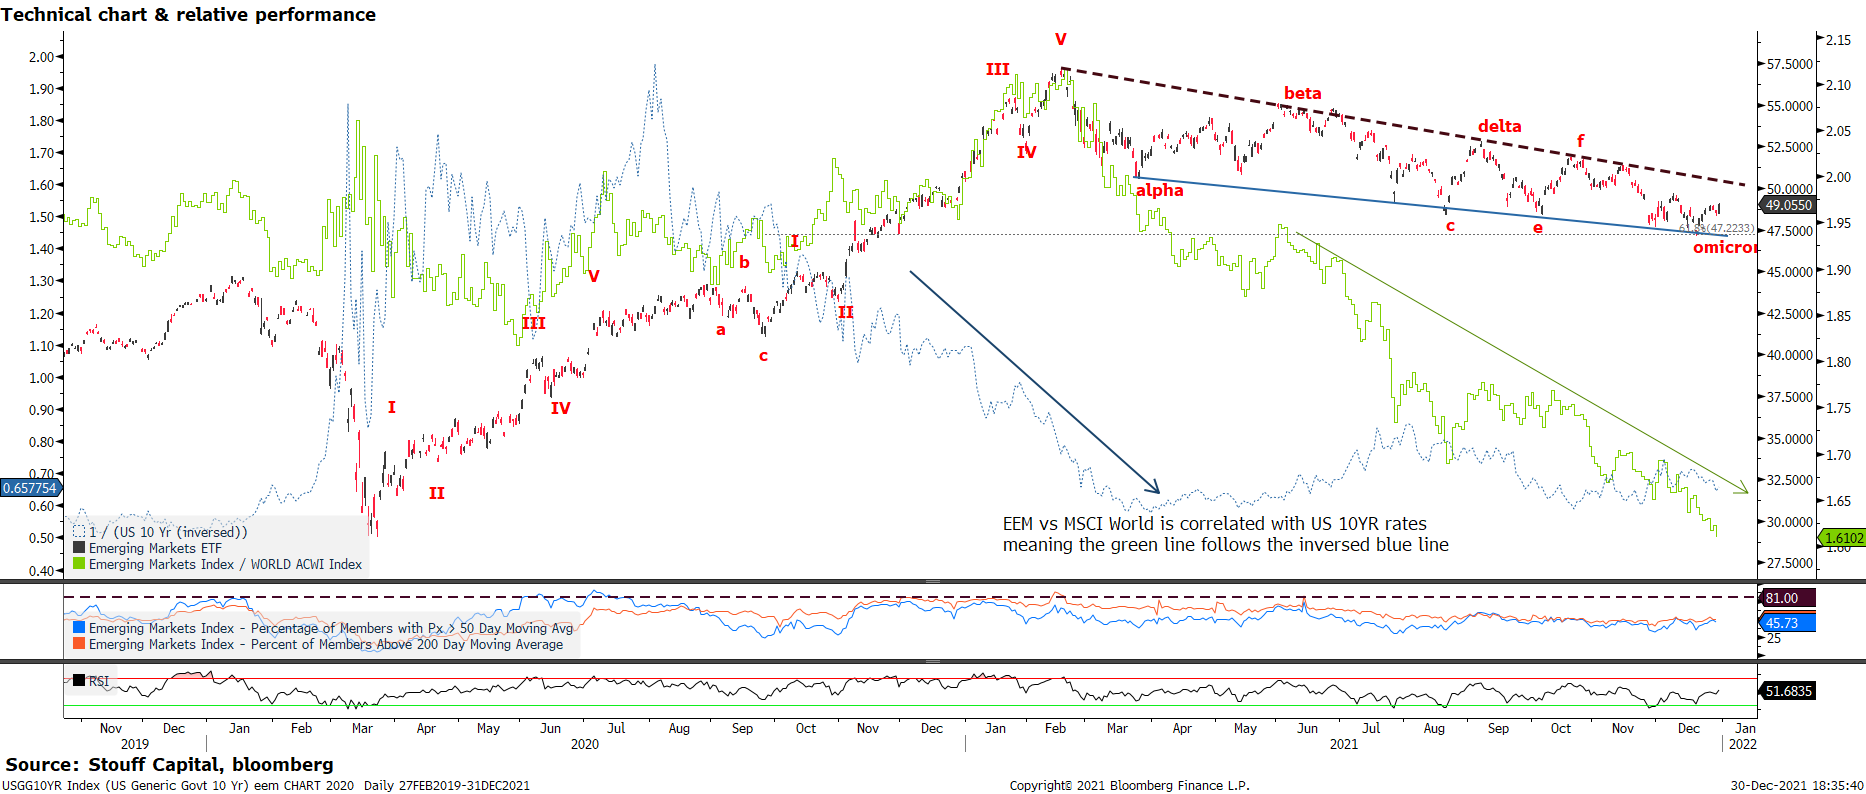
Chart 9: chart of the MSCI Emerging equities – still bearish but bottom formation – breakup at 50.5
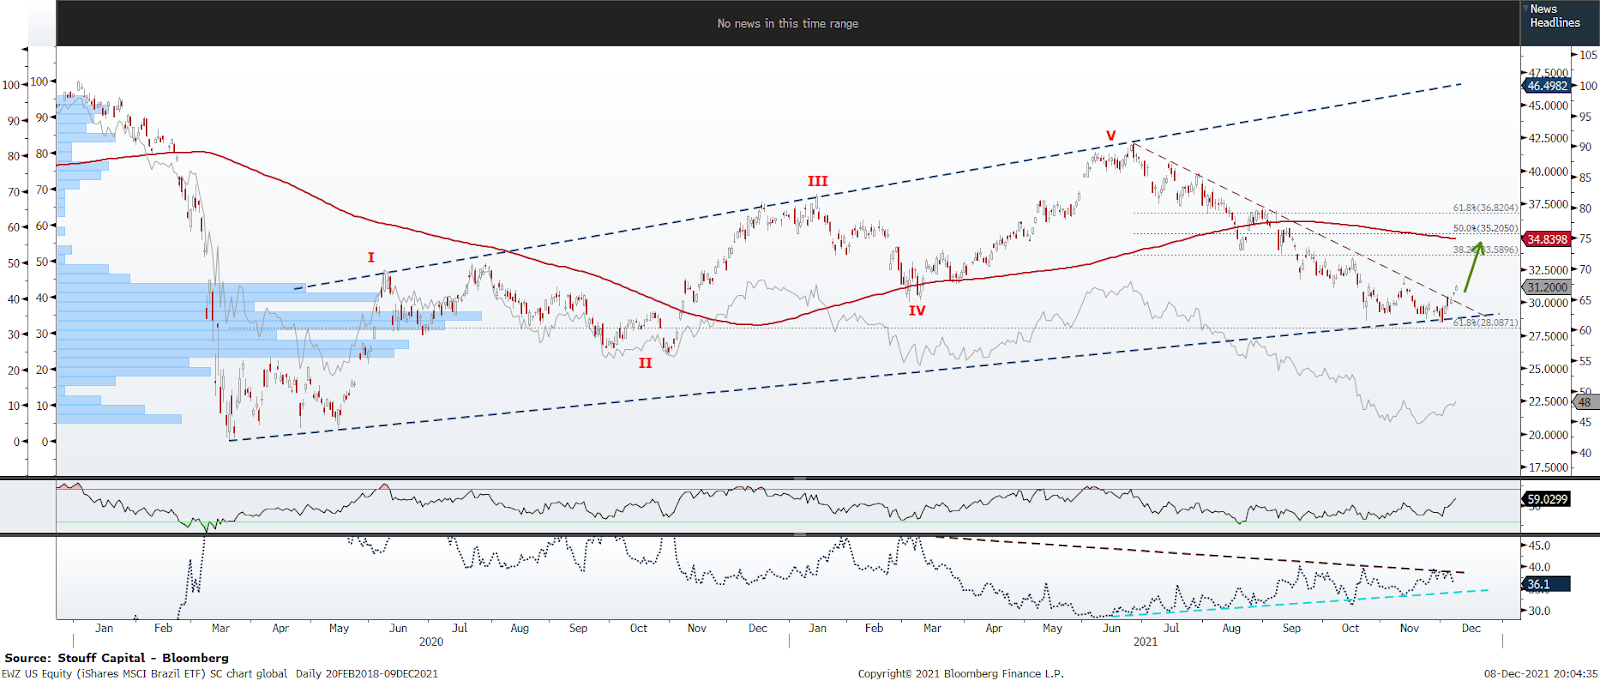
Within EEM, we initiate a contrarian bullish trade on Brazil.
Brazil is one of the worst 2021 performers, with a -27% underperformance versus ACWI. Our top down Global Macro tool, the “Compass”, is bullish on Brazil for 2022, as shown in the below table: the momentum is turning up, testing the bottom end of the channel and turning higher. Brazil is the first country to enter spring next year. The timing has been too early but, the etf has already retraced 61.8% of its low March 2020 to high June 2021 at 42.05, and from a relative point of view, it has started outperforming again since the summer (below chart).
Table: Macro Season for various countries
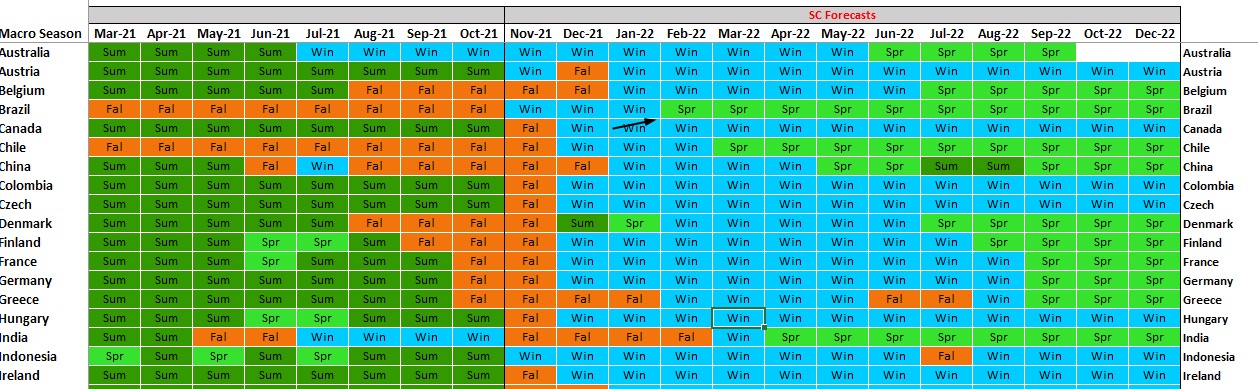
Chart 10: EWZ US has ended a 61.8% fibonacci retracement
What our Matrix tells us ?

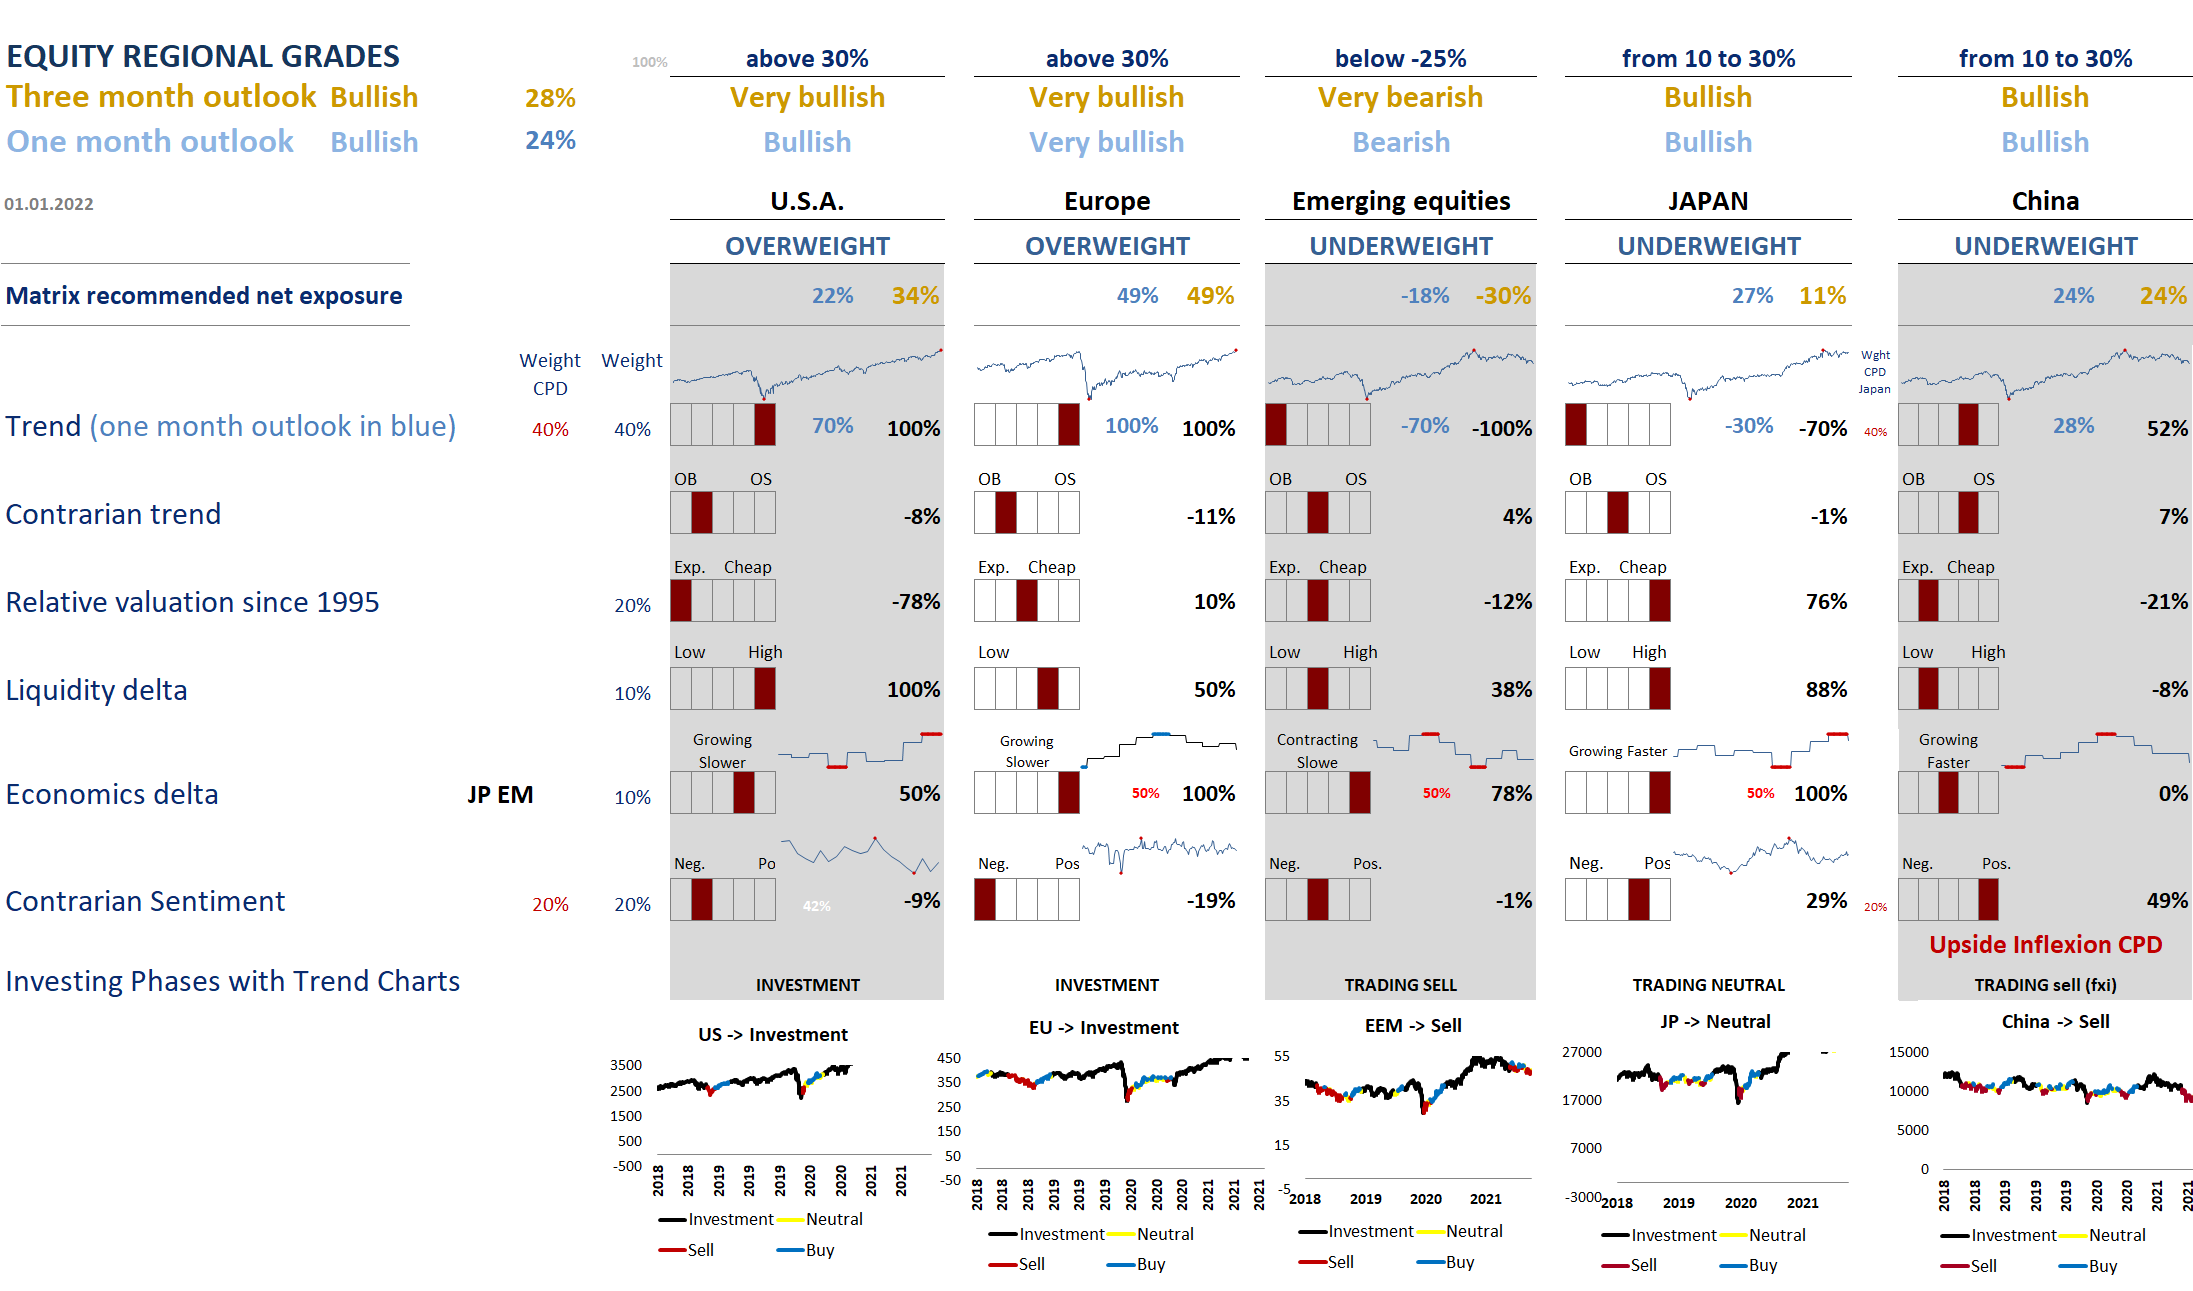
The Regional Matrix has switched from very bullish to bullish on a 3 months outlook and 1 month outlook. It is still giving strong distinctive outlooks for regions. EM, Japan & China are underweight, but EM is still very bearish while China is bullish thanks to its A-shares and oversold sentiment on ADR. US and Europe are OW, and in an Investment phase. Europe is preferred to US as it is specifically strong at 49%. The path for equities short term from here is still a rally until the start of 2Q, but overbought conditions in price and Sentiment must be worked out. In terms of business cycle, our economics grade are rebounding in all regions (Economic CPD in Europe, EM and now Japan). The big question is whether the business cycle will run out of steam and could be entering late stage or a new contraction “Winter”, or is going to rebound with fading Covid19 and more fiscal spending ? Indeed, the very unique nature of the Covid19 recession and economic expansion could create a new series of economic peaks and light slowdowns (like a high plateau in a mountain with many peaks on our right hand side photo). This is a Julien (S) versus Julien (B) debate, that could last for a few months.
What our Sector Matrix(es) tell us ?
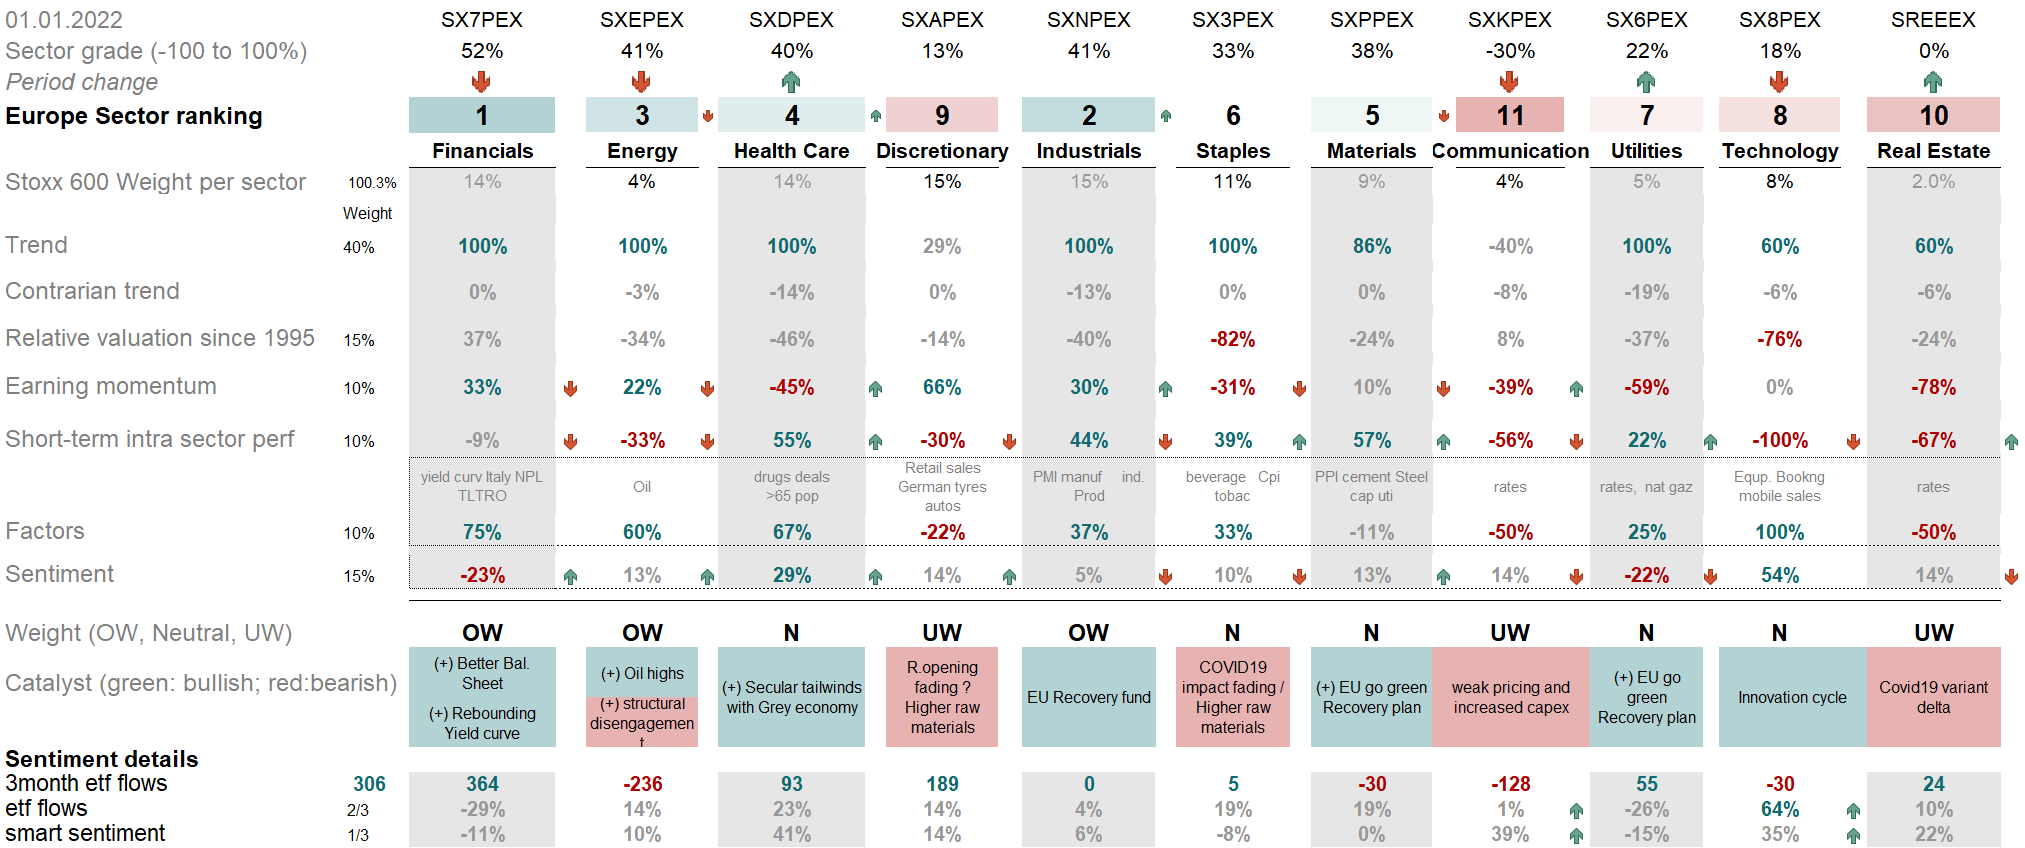
In Europe, OW sectors are Energy, Industrials, and Financials. Financials have rebounded to OW inline with the SantaClaus rally, to the detriment of Utilities and Real estate. Health-Care is near OW partly thanks to a bullish Smart sentiment .
In US, on the below table, OW sectors are Materials, Energy and Technology. Utilities & Real estate have fallen again versus Tech with the recent global equities and rates’ rebound. By the same logic, Financials are rebounding thanks to a rebound of US 10YR rates. Health-care & Industrials have been upgraded and near an OW state. This shows an inflationary environnement.
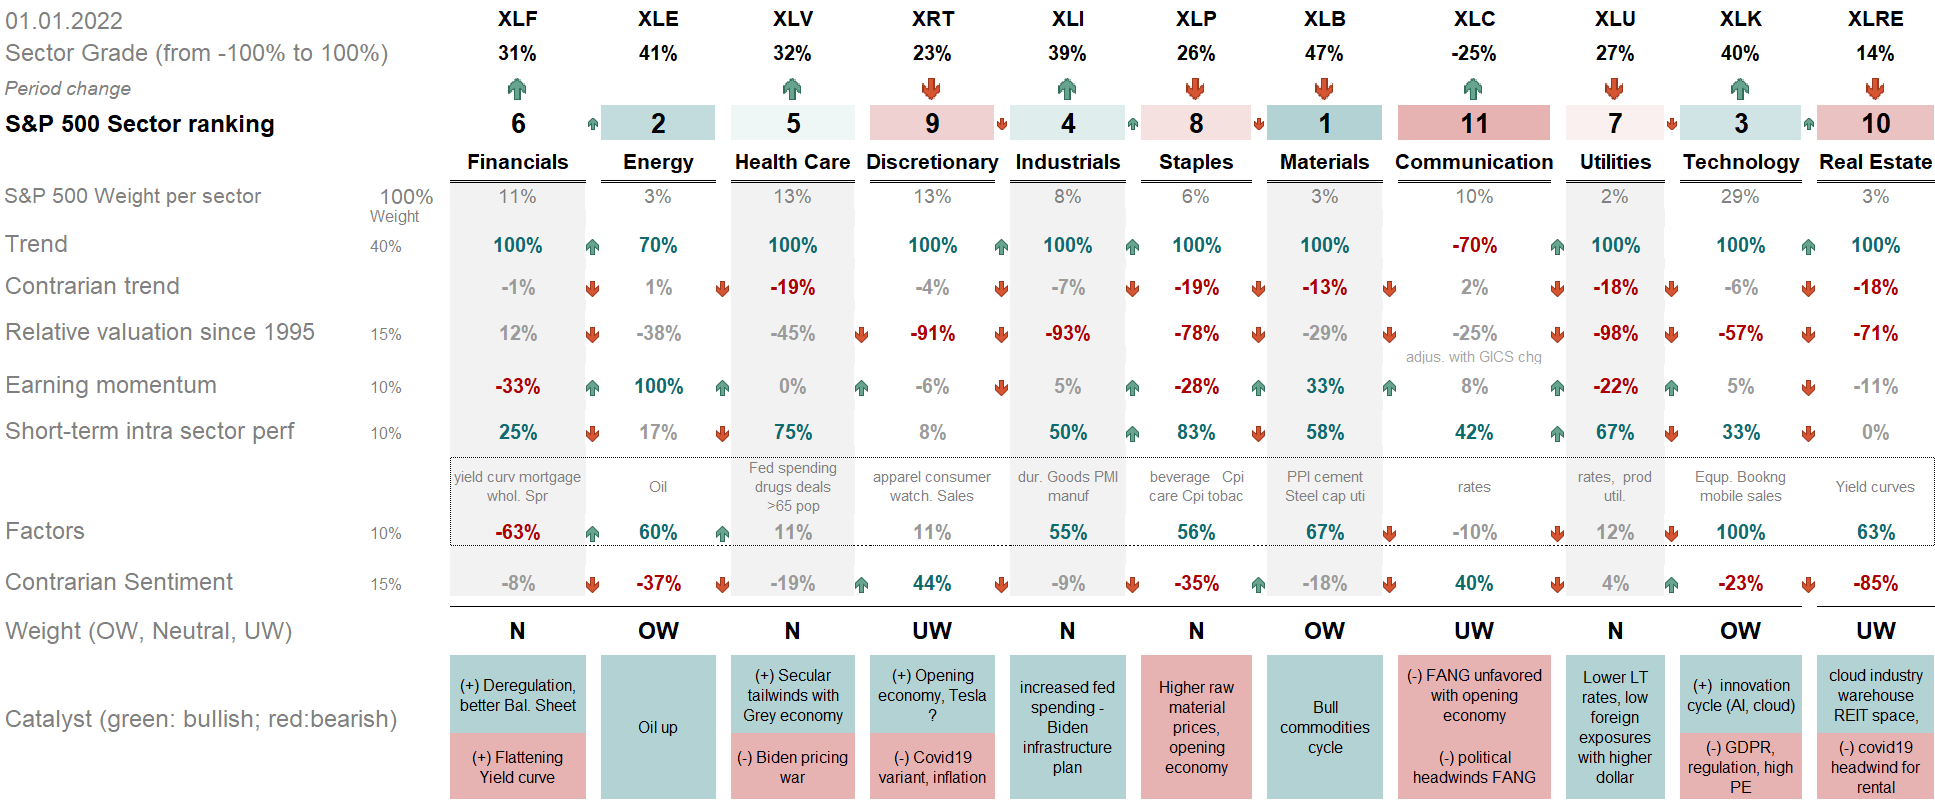
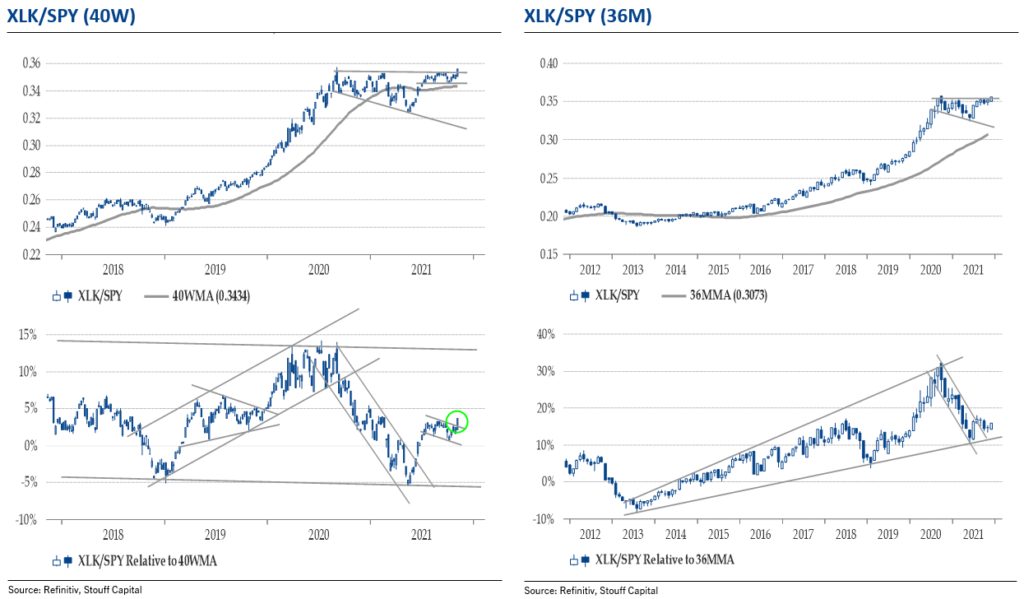
Tech is OW in our chart with a recent relative breakout:
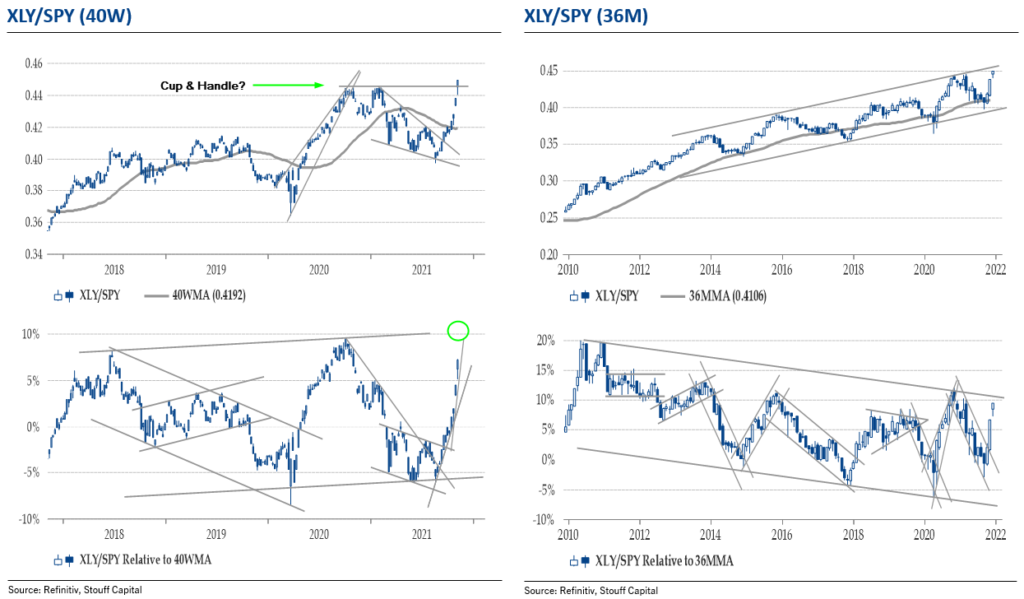
Discretionary is oscillating between neutral and OW thanks to a +28% earning momentum, a 100% trend grade. Julien B chart is also bullish with a relative break-out:
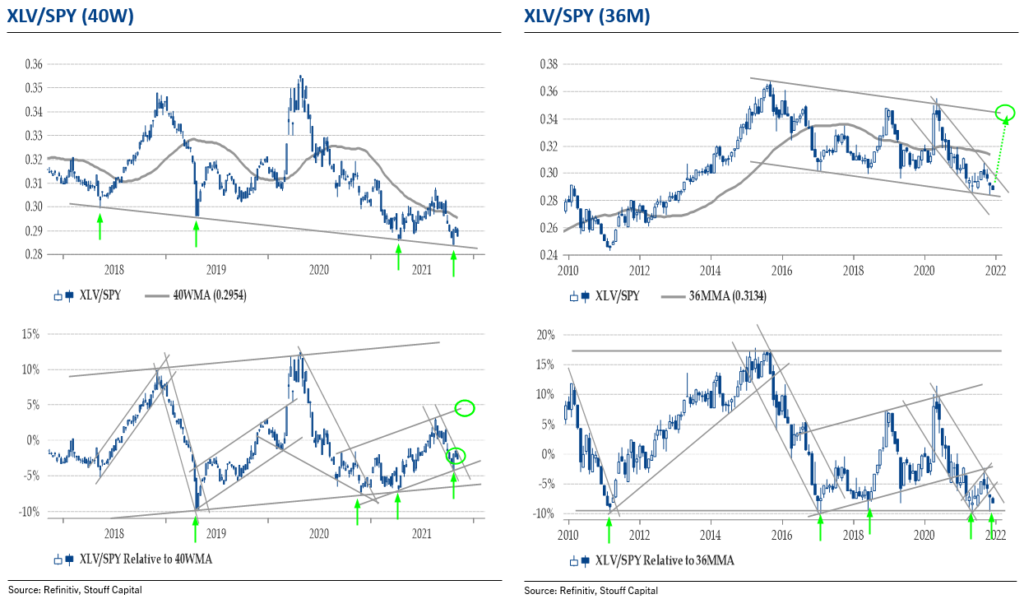
Healthcare has been upgraded to Neutral and is technically not far from a relative purchase:
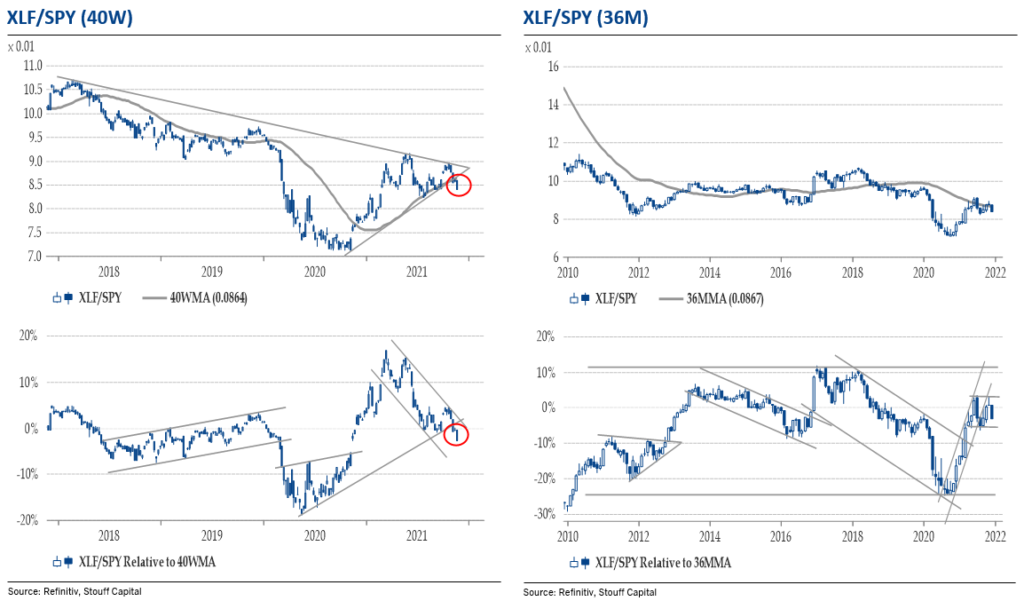
XLF (Etf for Financials) is giving a bearish relative signal versus the S&P500, in line with our US Sector matrix.
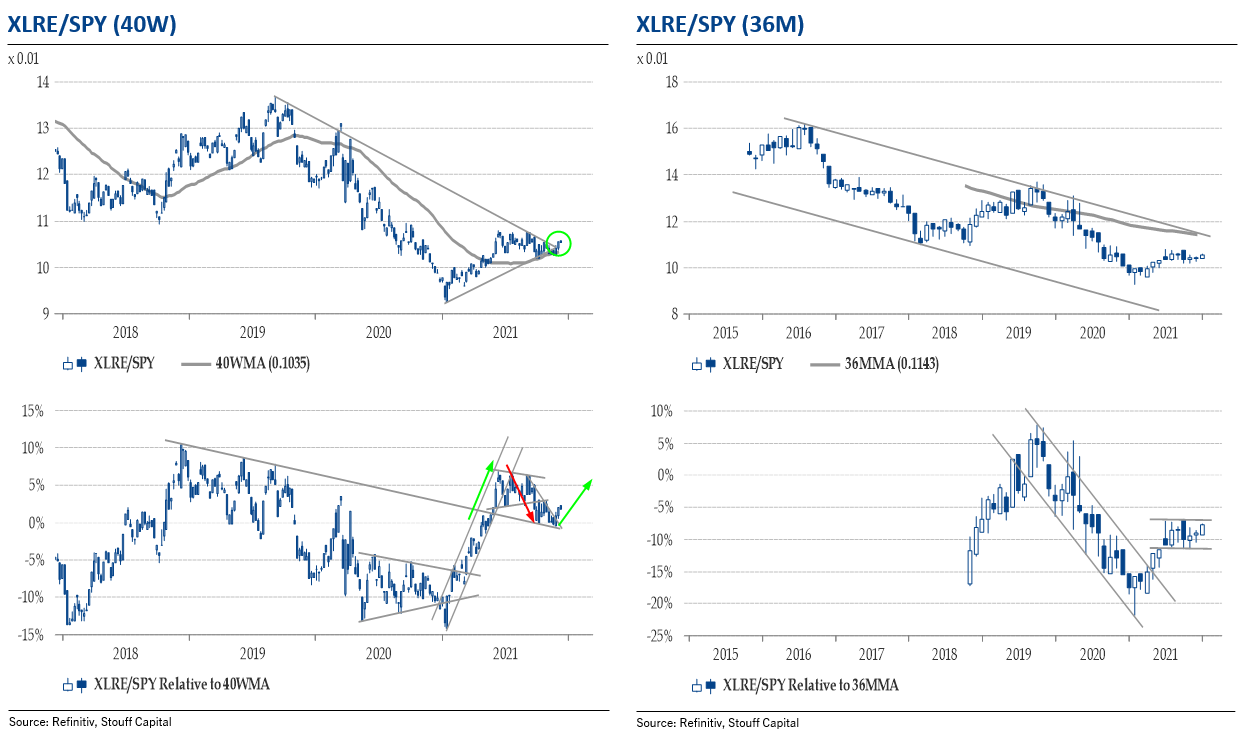
XLRE, Real estate is neutral/ bearish in our US sector Matrix, but technically, it could revert higher. To be followed…
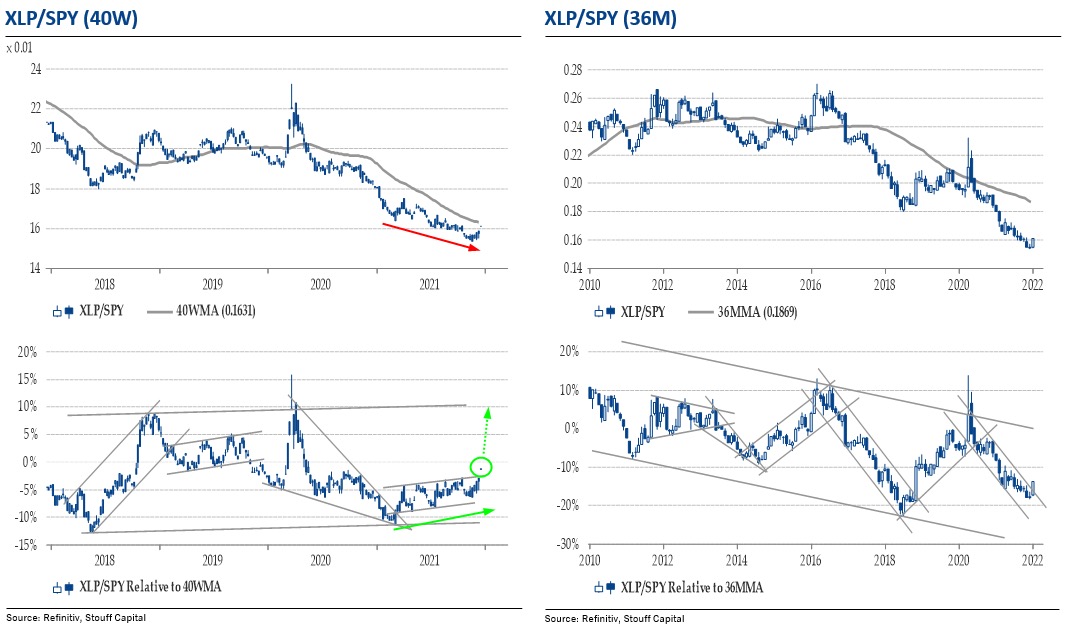
US Staples have been upgraded which is confirmed by their charts below
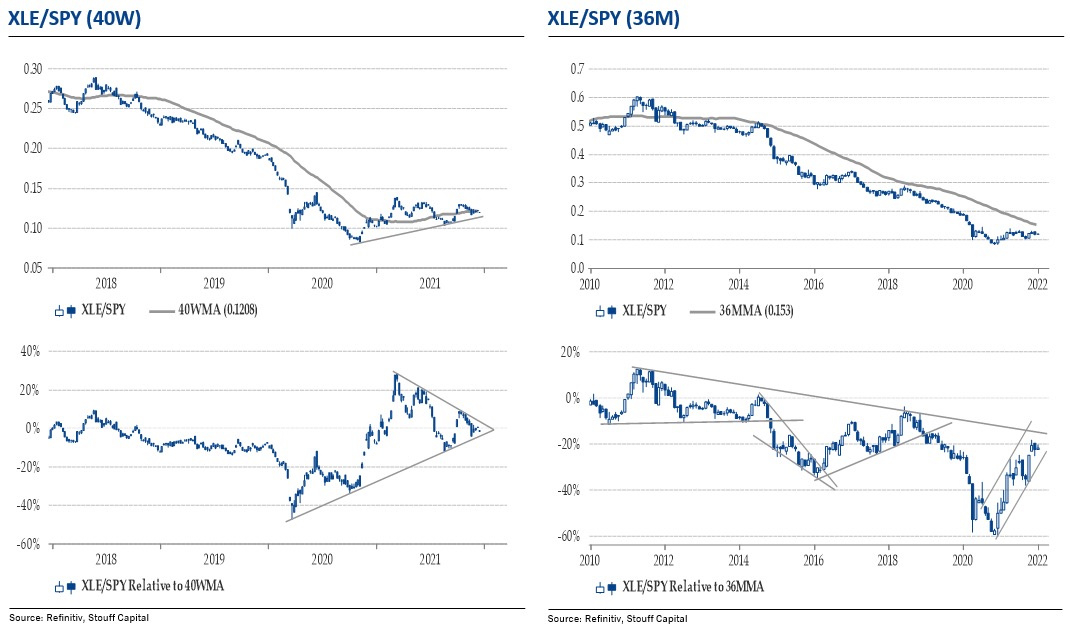
US energy is still OW, but the chart may turn:
Thematics: (1) Green revolution / EU Recovery fund / Green metals / all energies
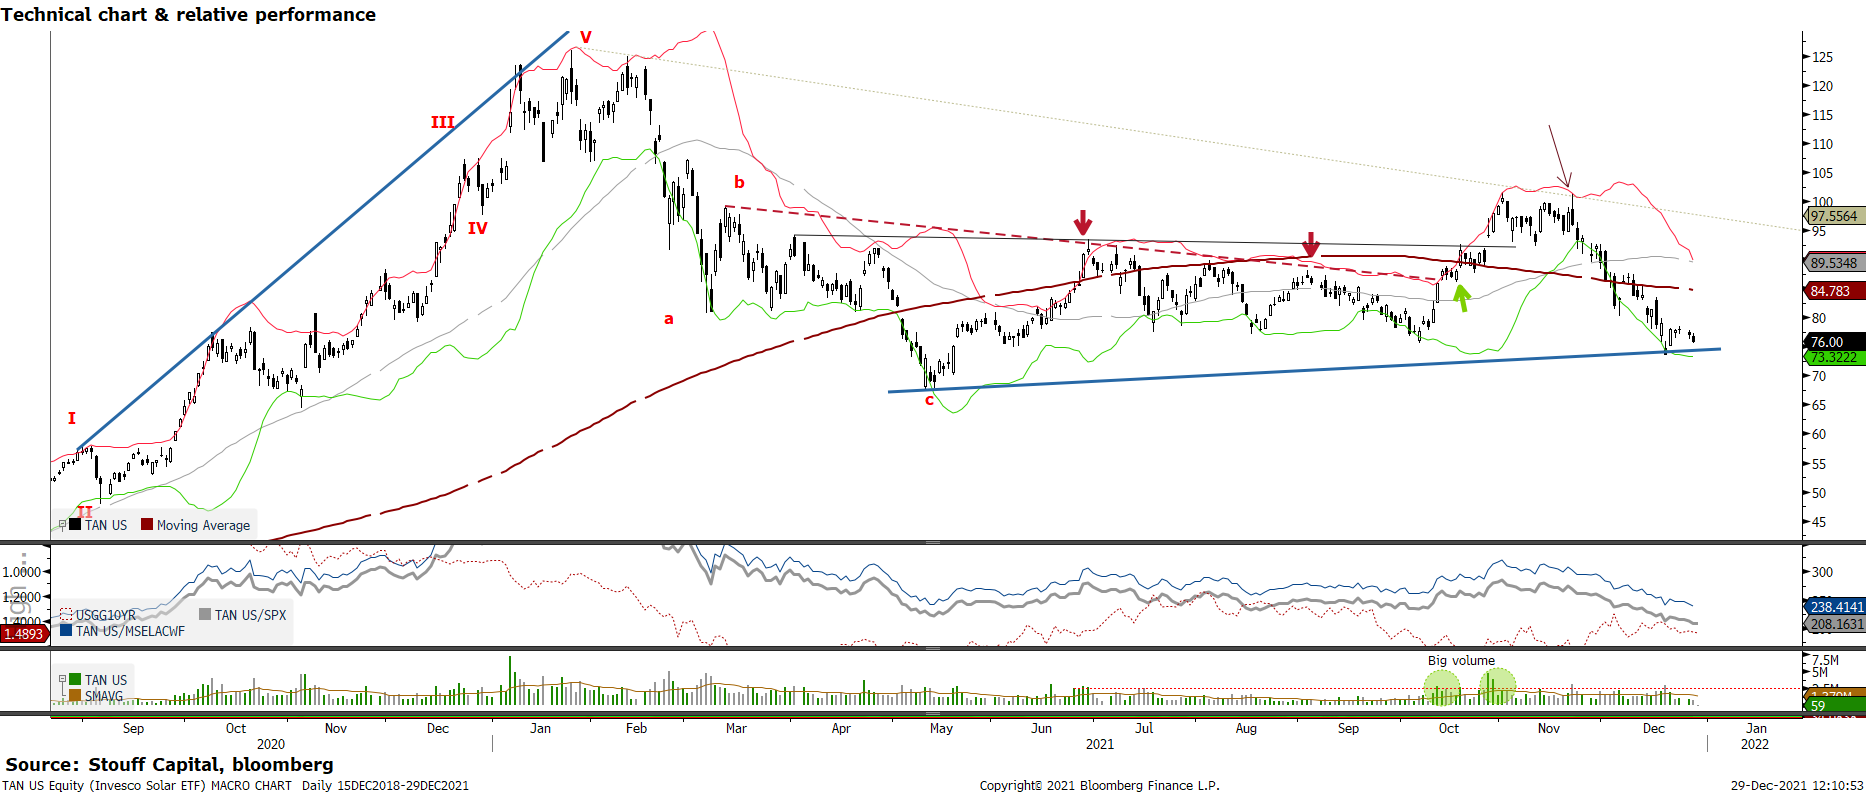
A newly profound government-backed push towards sustainability should support our EU Recovery fund list with names like RWE, Nordex. please find our special report here. The COP26 UN Climate Conference concluded on November 14, reaching the Glasgow Climate Pact to boost de-carbonization efforts globally and reaffirming the Paris Agreement goal of holding the increase in the global average temperature to well below 2 °C above pre-industrial levels and pursuing efforts to limit the temperature increase to 1.5 °C above pre-industrial levels; Developed countries are committing to US$100bn annual climate finance to support Developing countries with two key pledges: 1) transition away from coal-fired power generation and 2) use of clean tech for power, vehicles, steel, hydrogen and sustainable agriculture… We have added long exposures in TAN and ICLN with single stocks like SEDG, 968 HK, HASI, RUN, ARRY, ORA, ENPH. In China, key beneficiaries in Renewables – Sungrow (300274 CH), LONGi (601012 CH) and Longyuan (916 HK); Equipment – Nari Tech (600406 CH) and Xuji Electric (000400 CH); and Gas utilities – ENN Energy (2688 HK) and Kunlun (135 HK). The energy transition is going to see fivefold. Global capital investment in oil is about $600 billion this year, but it peaked in the 2014-15 time frame at $900 billion. For the energy transition, global investments are going to be between $3 trillion and $5 trillion a year for the next 30 years. What we’re preparing for and focusing on is finding those enabling technologies that are going to allow this level of global capital investment. On the solar side, we’re not as interested in the big utilities that are putting in solar panels. We prefer the enabling technologies in and around that. It’s kind of like the gold rush in the energy transition. You don’t necessarily want to own the companies that are installing the mines, or installing the wind farms or solar fields. You want to find the companies that supply the picks and shovels. Whenever you put solar panels on a residence, you have an inverter to convert DC power to AC. There are technology companies that manufacture those inverters. Enphase Energy [ENPH] is one. Solaredge Technologies [SEDG] is another company that benefits from inverter demand.
In US, Congress passed the legislation to repair bridges, redesign intersections, expand rail service and upgrade airports and power lines, representing the largest federal infrastructure investment in more than a decade.Industry executives. The projects funded by the new bill aren’t likely to get under way for several months or a year. That lag could give infrastructure companies time to catch up with current backlogs created by supply-chain constraints and tight labor.
Tesla (TSLA), a proxy for alternative energy, is still investing in battery capacity and technology. Overall, auto makers controlling about 50% of the global vehicle market have earmarked about $75 billion for battery development and manufacturing through the end of the decade. Legacy automakers, lithium producer Albemarle, and Korean chemicals giant LG Chem could be among the big winners in the race toward vehicle electrification. To meet battery capacity goals, legacy car makers are partnering with big battery makers, including SK Innovation, Samsung SDI (006400.Korea), and LG Chem (051910.Korea), which are sharing costs with them, helping to secure supply, and reducing operational risk. Panasonic Corporation’s automotive division is booming as demand remains robust for EV batteries. Panasonic currently has a relationship with Tesla, and it’s developing Tesla’s new, larger 4680 lithiumion batteries. As far as overall EV sales are concerned, Ford is expected to become number-two in the U.S. by 2023 due to its hot-selling Mach-E and reservations for the F-150 Lightning, followed by Volkswagen with its Audi, Porsche and VW EV models. Eventually, expect Volkswagen to pass Tesla in worldwide EV sales—and that could happen as early as late 2023.
| Freeport-Mcmoran Inc | FCX US | 9.36 | |
| Glencore Plc | GLEN LN | 8.87 | |
| Ganfeng Lithium Co Ltd-A | 002460 C2 | 6.26 | |
| Mmc Norilsk Nickel Pjsc-Adr | MNOD LI | 6.25 | |
| Zhejiang Huayou Cobalt Co -A | 603799 C1 | 5.42 | |
| China Northern Rare Earth -A | 600111 C1 | 4.95 | |
| Grupo Mexico Sab De Cv-Ser B | GMEXICOB MM | 4.34 | |
| Teck Resources Ltd-Cls B | TECK US | 4.19 | |
| Sumitomo Metal Mining Co Ltd | 5713 JP | 3.06 | |
| First Quantum Minerals Ltd | FM CN | 2.98 |
As major countries move toward reaching a goal of zero carbon emissions and make a bigger shift toward cleaner-energy alternatives, green metals such as lithium, cobalt, copper, and nickel are expected to see demand climb: in a scenario that meets the Paris Agreement goals, the total share of minerals demand from the energy sector would rise significantly over the next two decades to over 40% for copper and rare-earth elements, 60% to 70% for nickel and cobalt, and almost 90% for lithium. Buy FCX for copper, or the GMET etf, with its members on the right hand table.
We have a secular Energy call, bur we want to invest through a barbell long alternative energy along with old energy companies that transform themselves. It’s a unique moment for the old energy industry, after years of sleepy returns for the stocks. Shale drilling boomed in the past decade in the U.S. and released vast amounts of gas, which led to a surplus that depressed prices. Producers could never make much money because of persistently low prices. Then the pandemic caused U.S. drilling to drop, and it hasn’t fully rebounded, even as demand has; Meanwhile, policies to slow climate change look like they will affect natural gas prices, both positively and negatively. Gas will eventually be phased out as countries adopt more stringent home-heating and electricity production regulations. But gas is also a key bridge fuel for the next several years—perhaps more than a decade—as coal goes away and renewables ramp up. Gas, which has historically been used mostly for home heating, is now the leading source of electricity in the U.S. and a growing source elsewhere. A lack of gas supplies caused prices to hit highs in Europe and Asia last month, leading China to impose restrictions on electricity use by companies and causing some European power companies to go out of business. 😱In this sector, we are long Coterra Energy (ticker: CTRA), the product of a merger between two companies focused on natural gas—Cabot Oil & Gas, Cimarex, and EQT US.
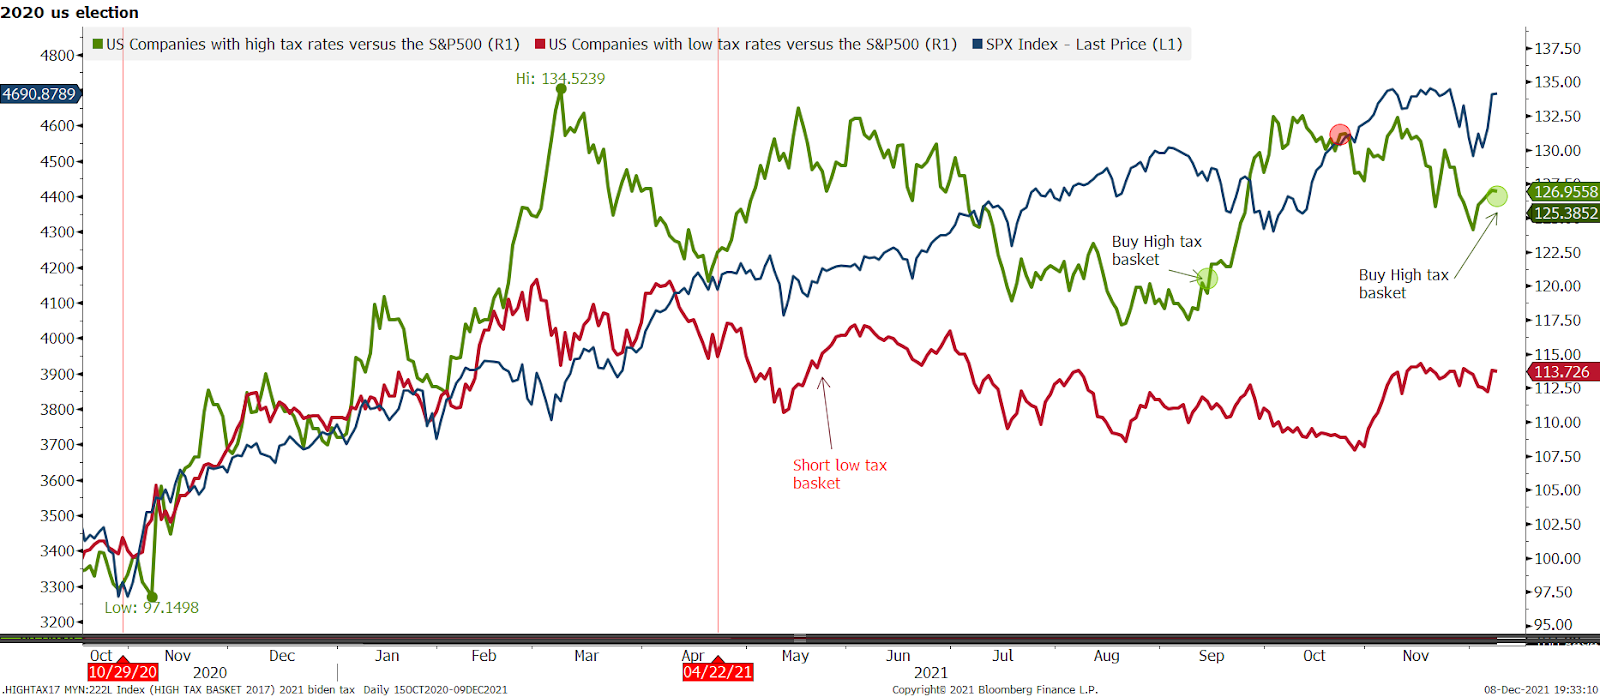
Thematics: (2) Das Kapital
One of our 2021 market focus is US tax reform. Back in May, in our letter Das Kapital (see here), we presented 2 baskets, one hurt by higher tax rates which we shorted on May 18th (the basket has underperformed by -2% the S&P500), and one benefitting relatively from higher tax rates. On September 14th, we bought the High tax basket, we closed it on October and just bought it again on Dec 8. Most details for the justification of this trade are to be found in our Das Kapital letter.
Thematics: (3) Crypto liquid equities
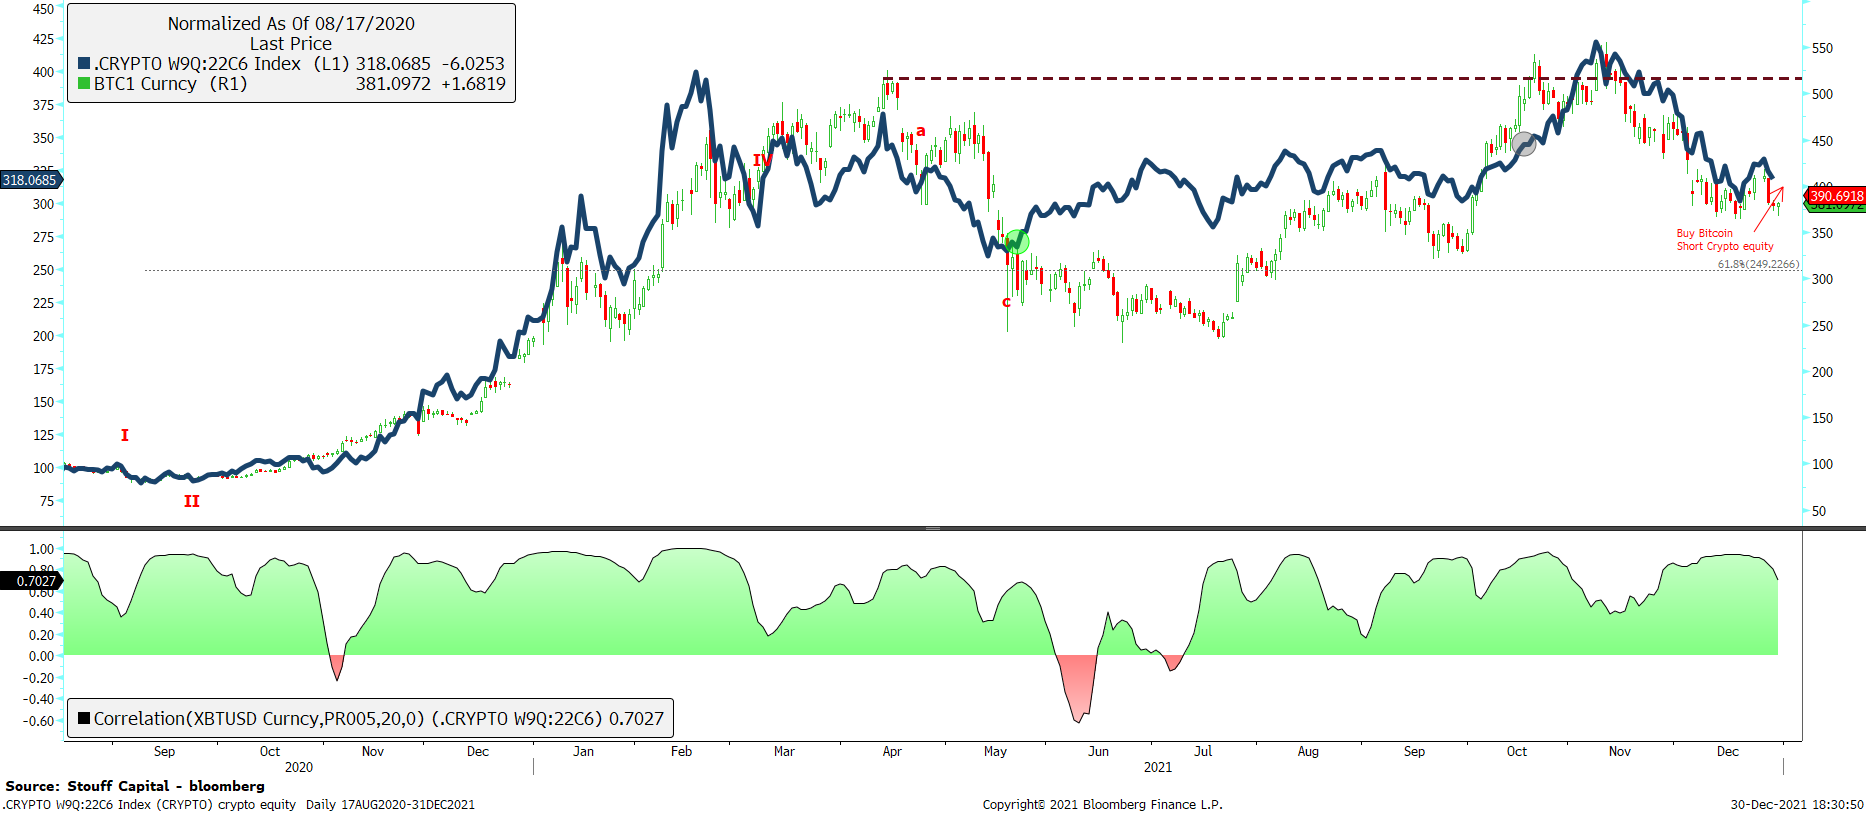
We built a basket of equities related to the Crypto world: major holders are Tesla, Microstrategy, exchanges like Coinbase Global (COIN) and mining chip company Nvidia (NVDA), then there are other groups like:
DeFi – The new focus from crypto world are interest rates and decentralized finance (DeFi). Crypto lenders are offering 5%+ interest on crypto-dollars that compete with traditional banks, causing regulators/governments to respond. Given the rapid growth of the stablecoin market (now $137.7bn market cap versus $20bn a year ago), the banking industry will likely look to capitalize on the demand for stablecoin deposits as well. Both Signature (SBNY) and Silvergate (SI) are a way to play this theme.
BITCOIN MINING – Bitcoin mining involves producing Bitcoins as a reward, for validating transactions on the blockchain network. Miners do this by running computers continuously to try to guess a string of crypto characters for each block of transactions. Guessing correctly validates the block, adding it to a chain of previous blocks (hence the term blockchain). The main prize for being first is payment in Bitcoin itself, which the network’s code allocates at a rate of 6.25 Bitcoins per block. One big variable, is mining difficulty—how many guesses per second the network makes to validate, or “hash,” the next block. That hash rate is measured in exahash, or 10 to the 18th power hashes a second. It’s now nearly 170 exahash and could more than double over the next year. Higher hash rate reduces the potential rewards for each miner. The rate plummeted this summer after China banned Bitcoin mining, but it has been climbing back. expect it to rise, potentially making it harder for miners to earn Bitcoin rewards and requiring more electricity for each coin.
Run by Riot Blockchain (ticker: RIOT), 11,000 computers huming 24 hours a day at the old Alcoa site contributed to “mining” 1,292 Bitcoins in the third quarter, worth $54 million in revenue to Riot. Rockdale is now one of the largest Bitcoin production sites in North America. Riot aims to add 63,000 computers, more than doubling its mining capacity, by the end of 2022. Another stock to consider is Core Scientific, a miner that plans to go public through a merger with a special purpose acquisition company, or SPAC, called Power & Digital Infrastructure Acquisition (XPDI). Core also seeks to be net carbon neutral, using renewables and carbon credits. Marathon Digital Holdings (MARA) is also part of our basket, mining “rigs” from Malaysia and expecting to more than triple its Bitcoin capacity over the next year. Marathon is banking on an asset-light model—contracting with hosting facilities for energy and plowing nearly every penny of capital into mining machines. The company has just 10 employees, outsourcing much of its operations, buying machines in bulk at 30% of the industry average, producing Bitcoins at a cost of roughly $6,200, well below the industry average of $10,000. Wall Street expects Marathon’s sales to more than triple from 2021 to 2022, reaching $750 million, resulting in Ebitda of $581 million
We are starting a new blog, preclude for a coming crypto fund here.
Thematics: (4) Metaverse
Metaverse can be defined as a virtual space constructed in three dimensions where consumers interact via avatars. Consumers take the lead in what we would describe as a user-generated platforms (USGs). Such spaces are not completely new as numerous examples already exist. What is happening now is primarily that companies are redefining their platforms and racing to add to their market shares. The metaverse concept will also become a natural extension of their daily lives.
Investors are likely to give companies with established market share priority when investing in platform names. The sort of interactive spaces that metaverse proponents seek to provide are already enabled by game software, which represents a successful business with a global consumer base of 3bn. For that reason, platform operators are increasingly interested in gaming, and we expect to see a continuation of such existing trends as the gaming market attracting new entrants and engaging its own vertical integration in the form of financial and operational tie-ups and creators moving between companies. As progress is made on metaverse initiatives, we see potential for stronger market outlooks for the gaming and other content industries and for revaluations of individual companies.
Thematics: (5) What happen if disruptors are disrupted –> Short them
We have many shorts in Delivery food companies in Europe like DHER GY, US like Doordash. In fact, many members of Cathie Wood’s Ark etf are shorts in our quantamental Short portfolios.
Which factors work: Quality is still leading
From March 2021 to the end of the summer, quality has outperformed, in anticipation of peak earnings and peak economics. Since MID AUGUST, this had reversed in line with rebounding rates. There was a pause in the outperformance of small caps versus quality in sept/ oct, despite the move in interest rates. Since the start of November Quality is outperforming again versus small caps. Will the January effect change that ?
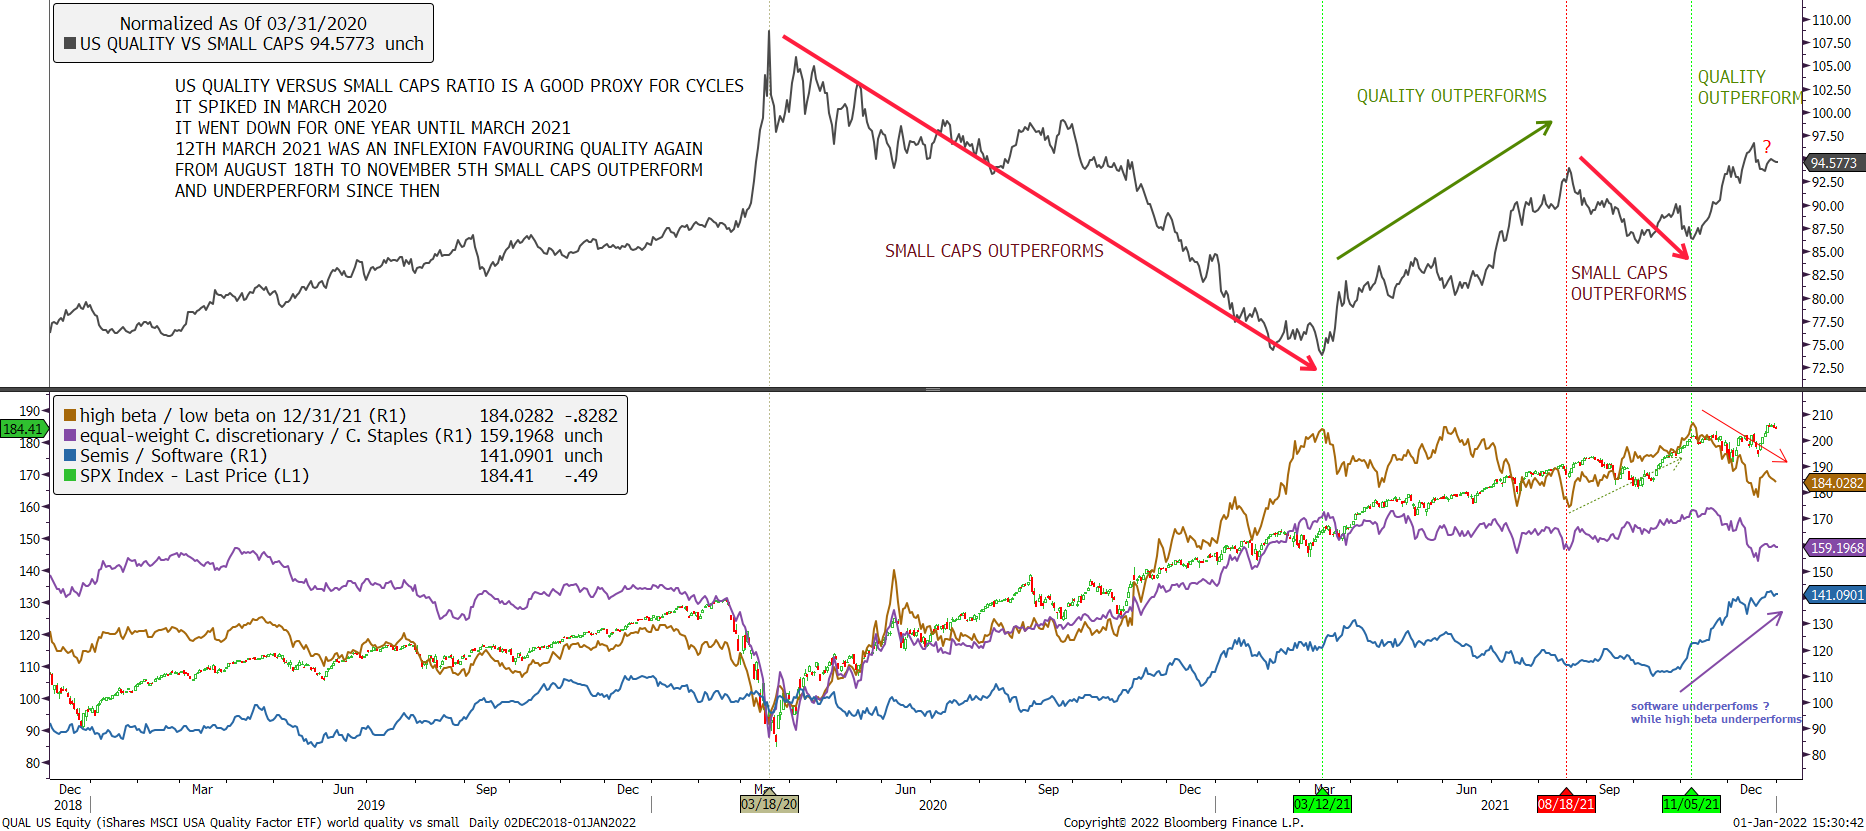
While the new virus triggered a strong underperformance, Seasonality SHOULD HAVE BEEN very good for small-cap stocks on the close of Friday, November 19. This small-cap position should be held until the close of the 10th trading day of March 2022. But the small-cap Russell 2000 has underperformed from March 2020 until now. Going forward, small caps have several ingredients in their favor. They are cheap in an expensive market (The S&P 600, which includes a narrower slice of the small-cap universe than the Russell 2000, goes for less than 17 times expected earnings over the next 12 months, versus about 22 times for the S&P 500), have attractive fundamentals, and can avoid several of the potential pitfalls facing large-caps in 2022 (the S&P 600 has just a quarter of its market value in tech and consumer discretionary, and about 45% combined in financials, industrials, materials, and energy—20 percentage points more than the S&P 500).
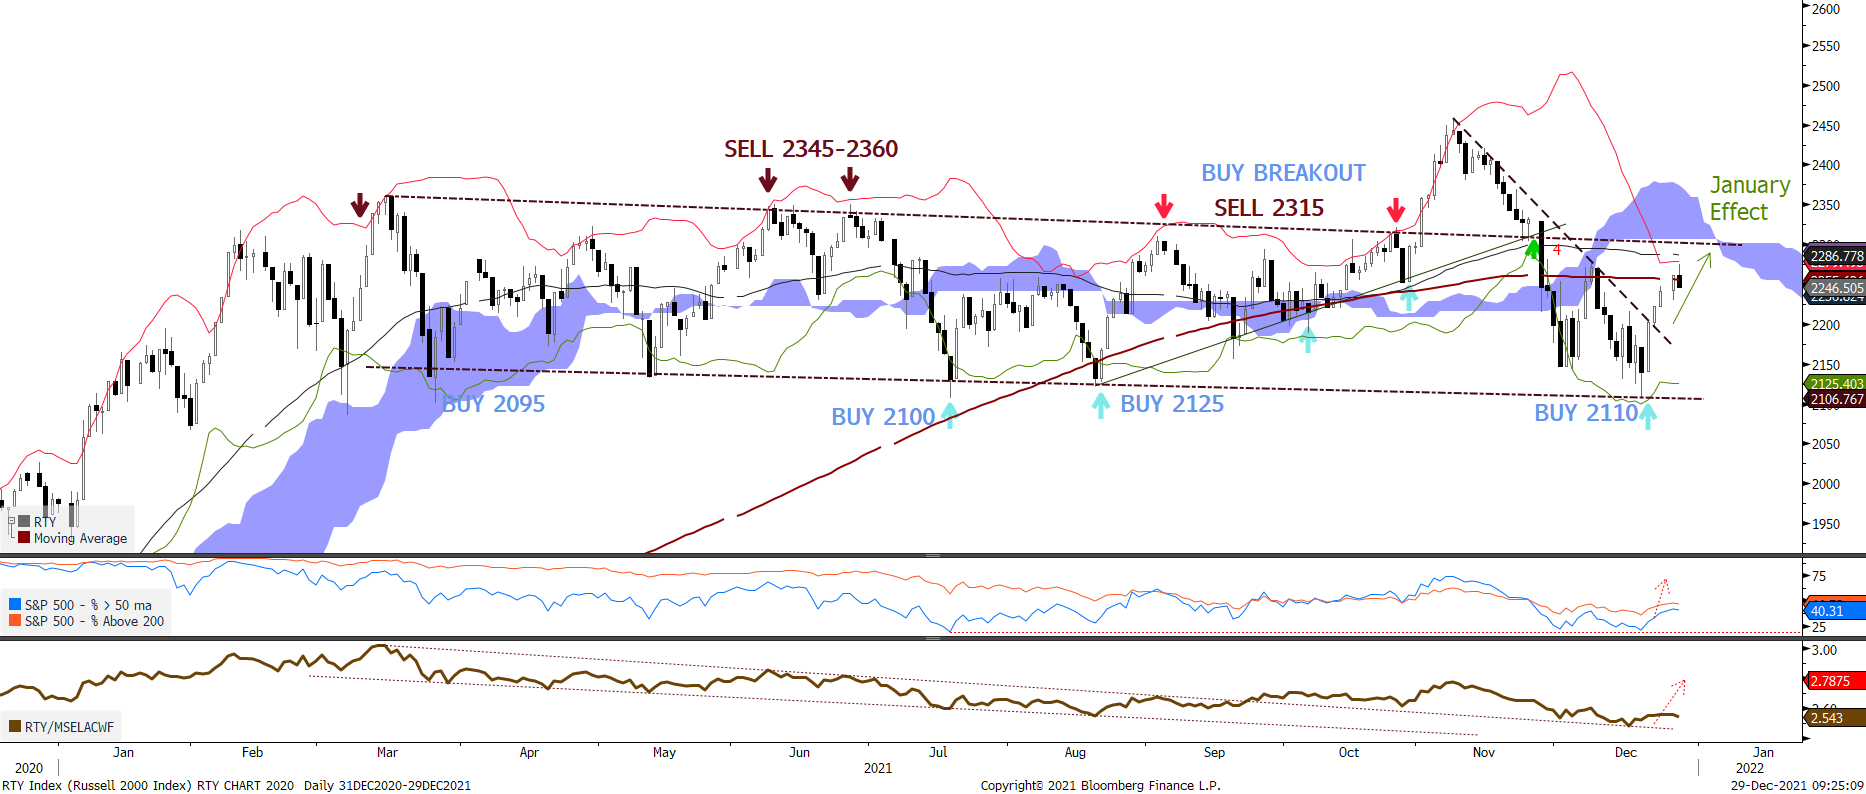
We think investor positioning is too bearish on small caps and high beta, while too optimistic on “pseudo-bonds” stock. Indeed, performance in the hedge fund space has been poor lately, which resulted in forced liquidations and deleveraging at a time of low liquidity, triggering extreme stock price action, especially across the High Beta and small-caps stock complex. The January effect should be all the more constructive for High Beta and other laggards than they are so underowned.
Hints from 1Q22 earnings
S&P 500 companies are projected to report 12.7% revenue growth in the December quarter, its third-largest year-over-year growth since FactSet began tracking this metric in 2008. It is projected to report 21.2% earnings growth, the fourth straight quarter above 20%. The US earnings trend (see chart below which is the ratio of positive minus negative guidances on total outlooks) has fallen in the last 2 weeks, which is generally the case before a new earnings season:
4Q21 earnings – will be moved to archive here …
Earnings have been remarkably impressive, during the earnings season. The S&P 500 was up 8% during this earnings season, its best performance in seven years. “Profit margins for S&P 500 companies have barely flinched, showing that companies weathered inflation headwinds well. However, misses have been penalized the most in 5Y and supply chain constraints still dominating the narrative; and the US earnings trend (see chart above of the ratio of positive minus negative guidances on total outlooks) has fallen again in the last 2 weeks. The winning formula has been owning asset-light companies that are insulated from supply disruption/ wages increase/ covid19 headwinds and have shown the ability to grow in a WFH or re-opening world. The consensus trade has been to underweight / short companies facing significant supply chain and inventory shortages. With early signs of supply chain headwinds easing, we believe it is an opportune time to look at them.
Here are 2 lists of companies able to sustain their margin despite higher Inflation with long names like M, TPR, KSS, WMT, HD, LOW, CAT, ABNB, FCX, PEP, STZ, LEVI and FANG* and short names like ANF, M, and BBBY, SWH, NKE, FDX, BOO, H&M, DPZ, TWLO, PYPL, TGT, YETI, JWN, ADSK,
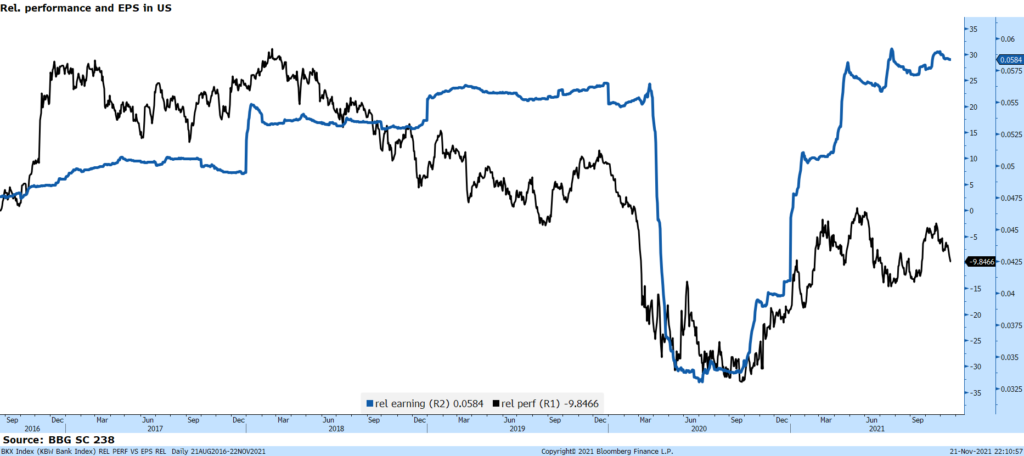
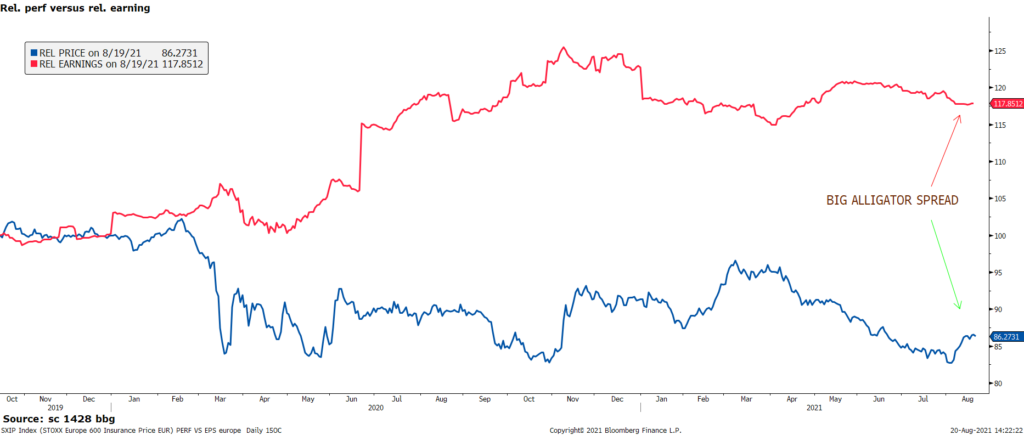
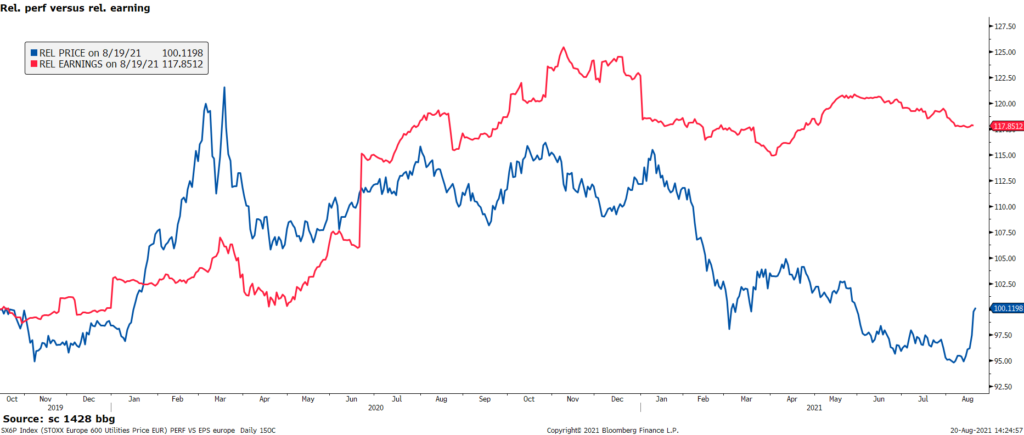
Signals from earnings versus price
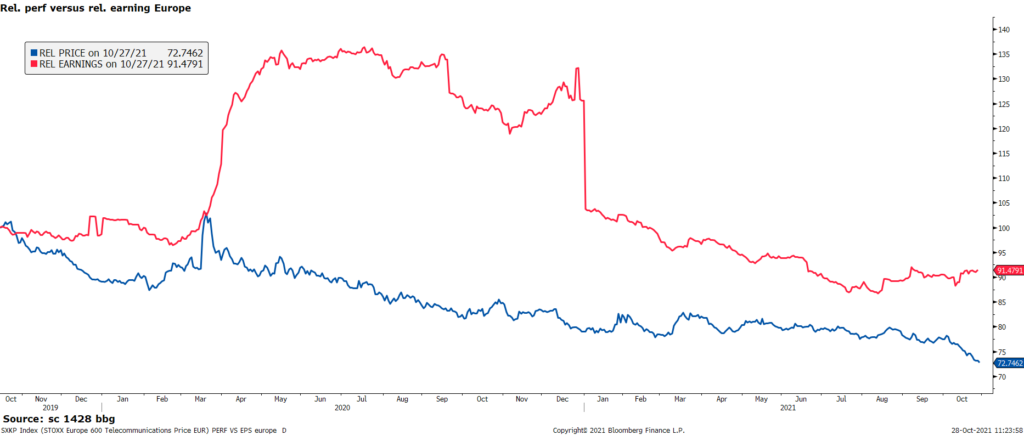
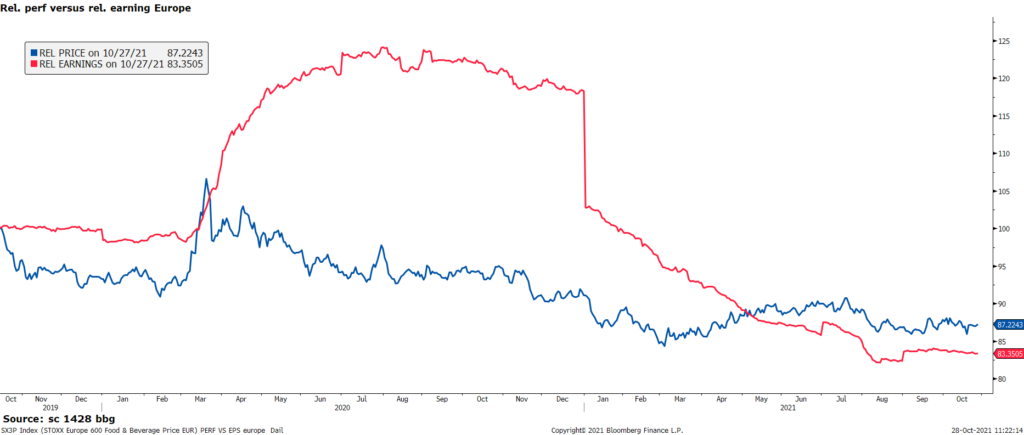
What strikes us in terms of earnings momentum versus price momentum is the bullish divergence of Japanese and European equities versus US, the attractiveness of US materials, Financials & Energy versus the S&P500 (versus Tech and discretionary), the divergence of European insurers, Utilities, banks.
Chart 10: relative performance of Europe versus US in black compared to relative earnings momentum & Chart 11: rel. CAC40
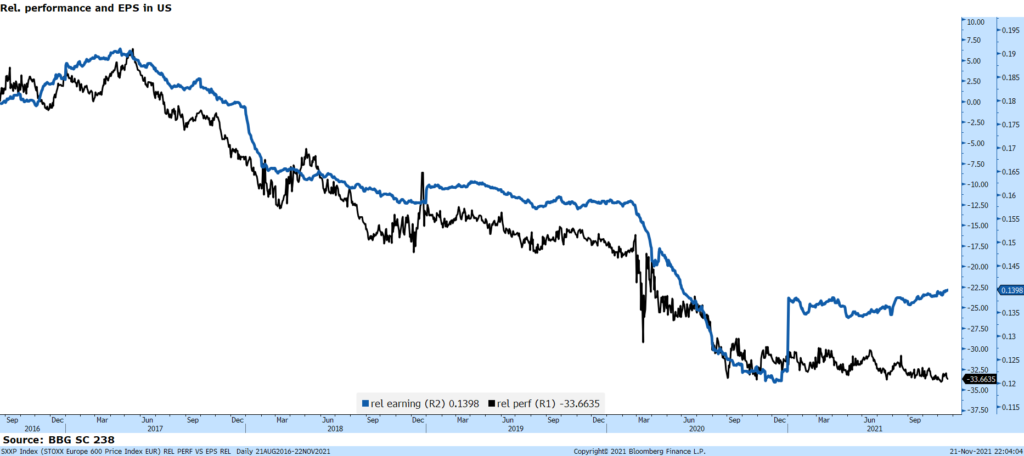
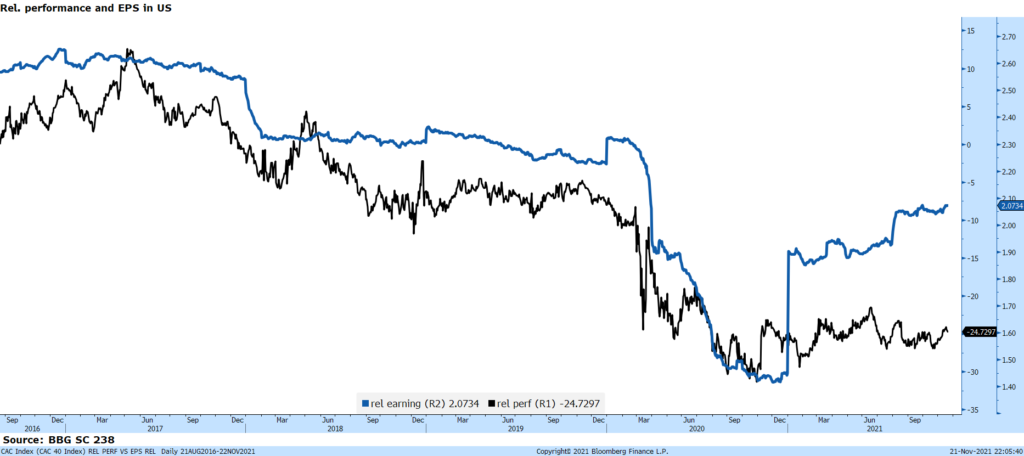
Chart 12: relative performance of Nikkei versus US in black compared to relative earnings momentum
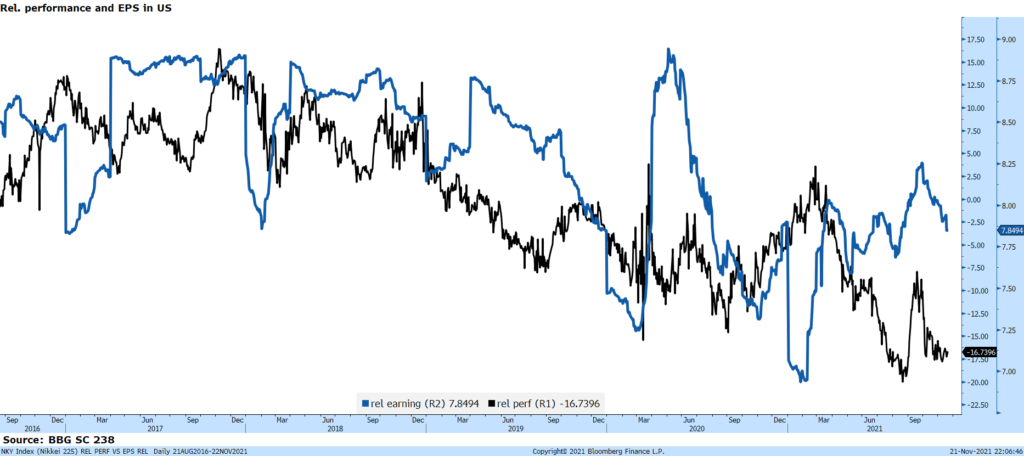
Chart 13: relative performance of US Energy versus S&P500 in black compared to relative earnings momentum
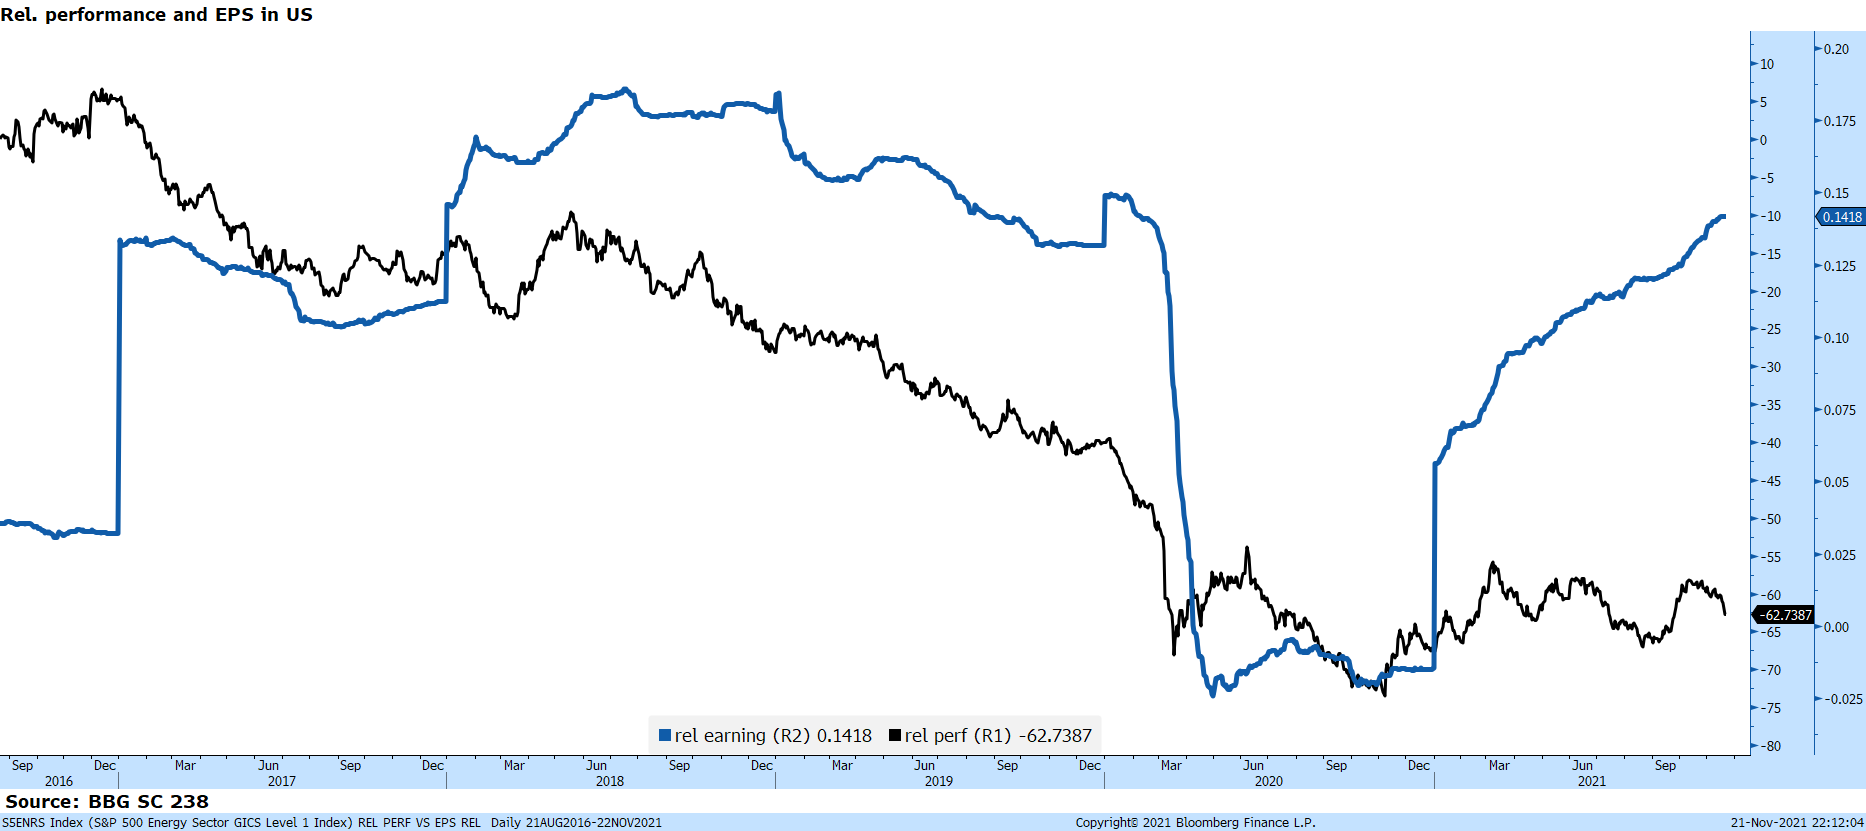
Chart 14: relative performance of US Banks versus S&P500 in black compared to relative earnings momentum
Other charts
Why the Nasdaq 100 looks vulnerable: As the Nasdaq 100 marches higher, driven by a few gigantic stocks, fewer of its members are participating. There has been a cluster of negative divergences over the past 30 days, and the NDX is underperforming the ACWI (global equities) since the 29th of November.
Chart 17: Nasdaq 100 NDX – laborious rise to unclear wave 5
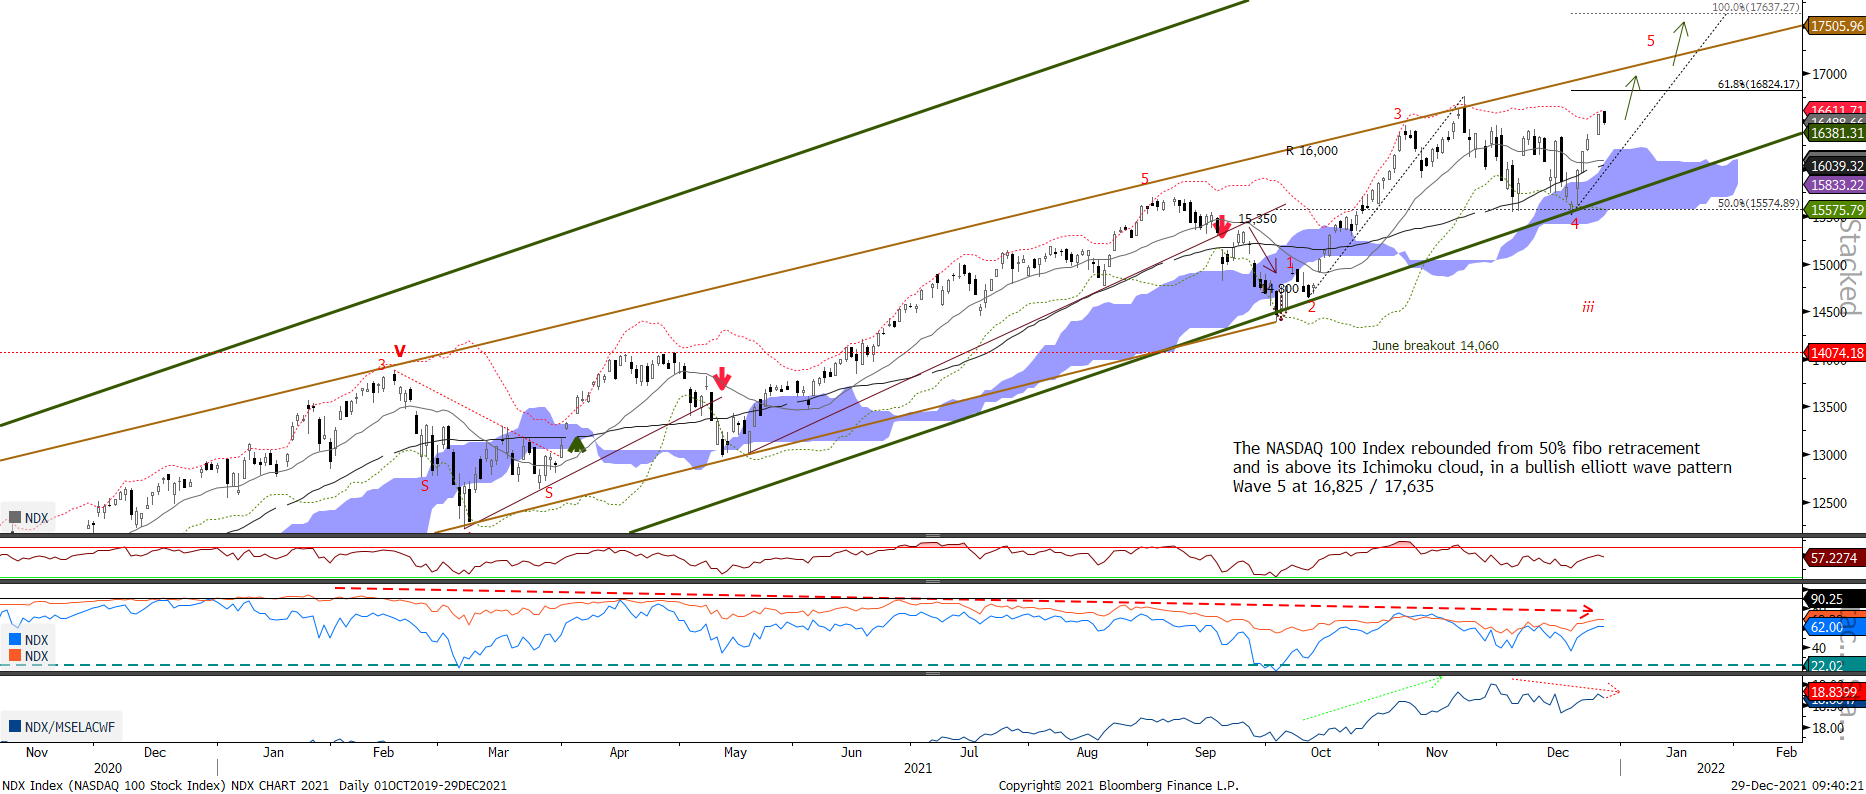
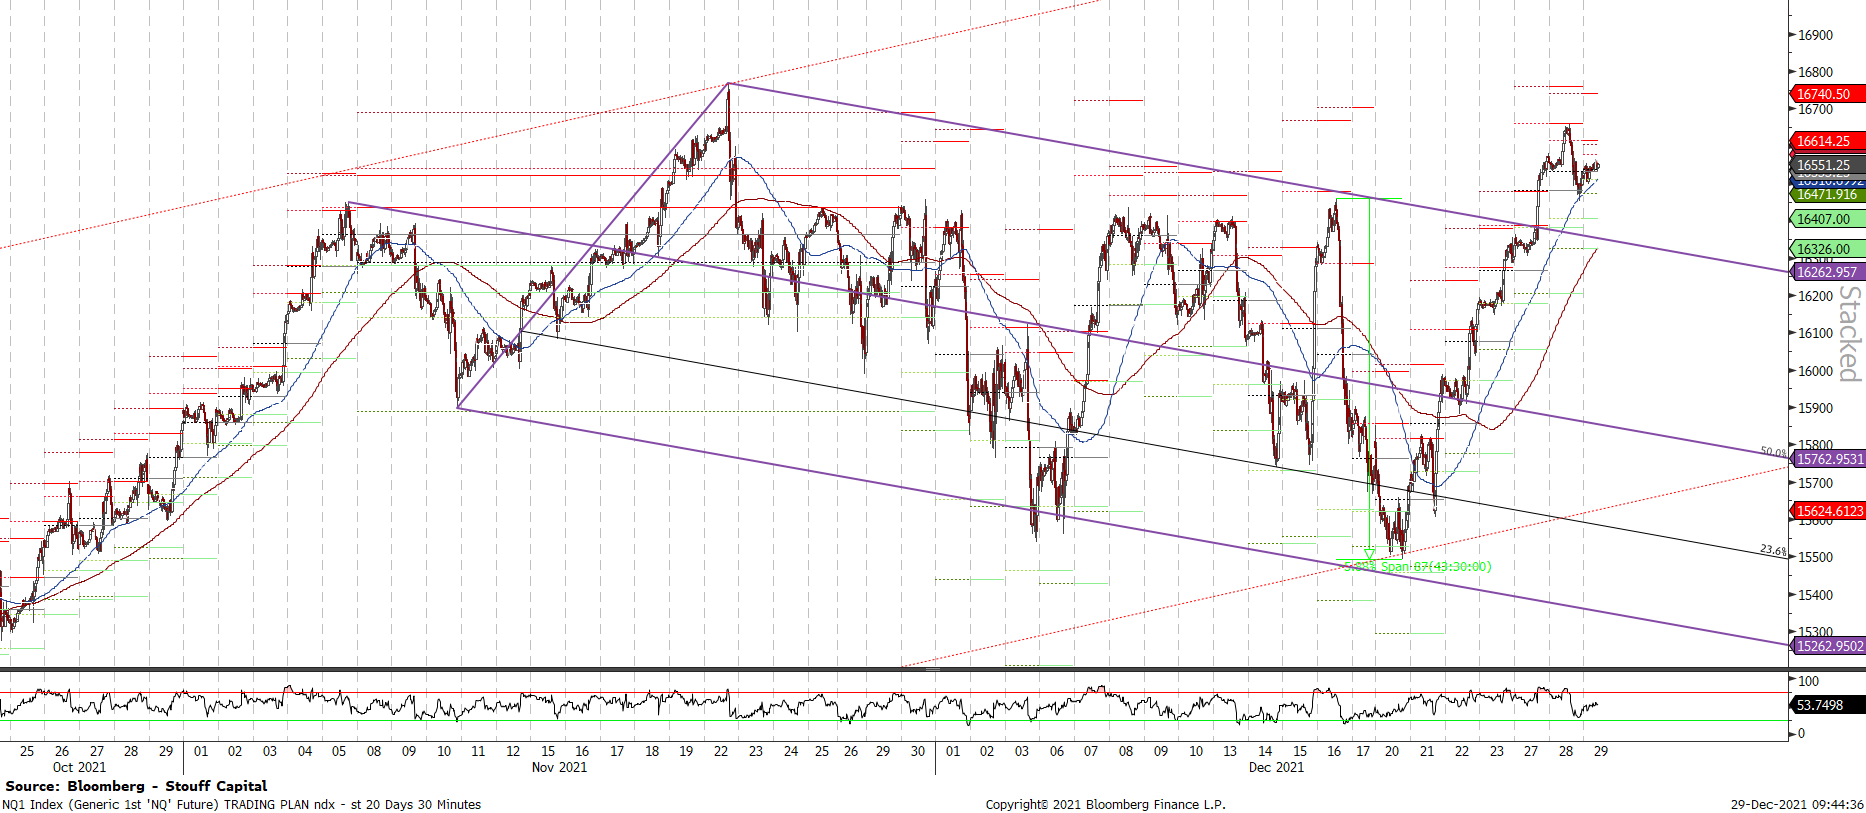
Chart 18: Nasdaq 100 NQZ1 – Consolidating since mid-November is over ? 16,770 ATH still not broken up
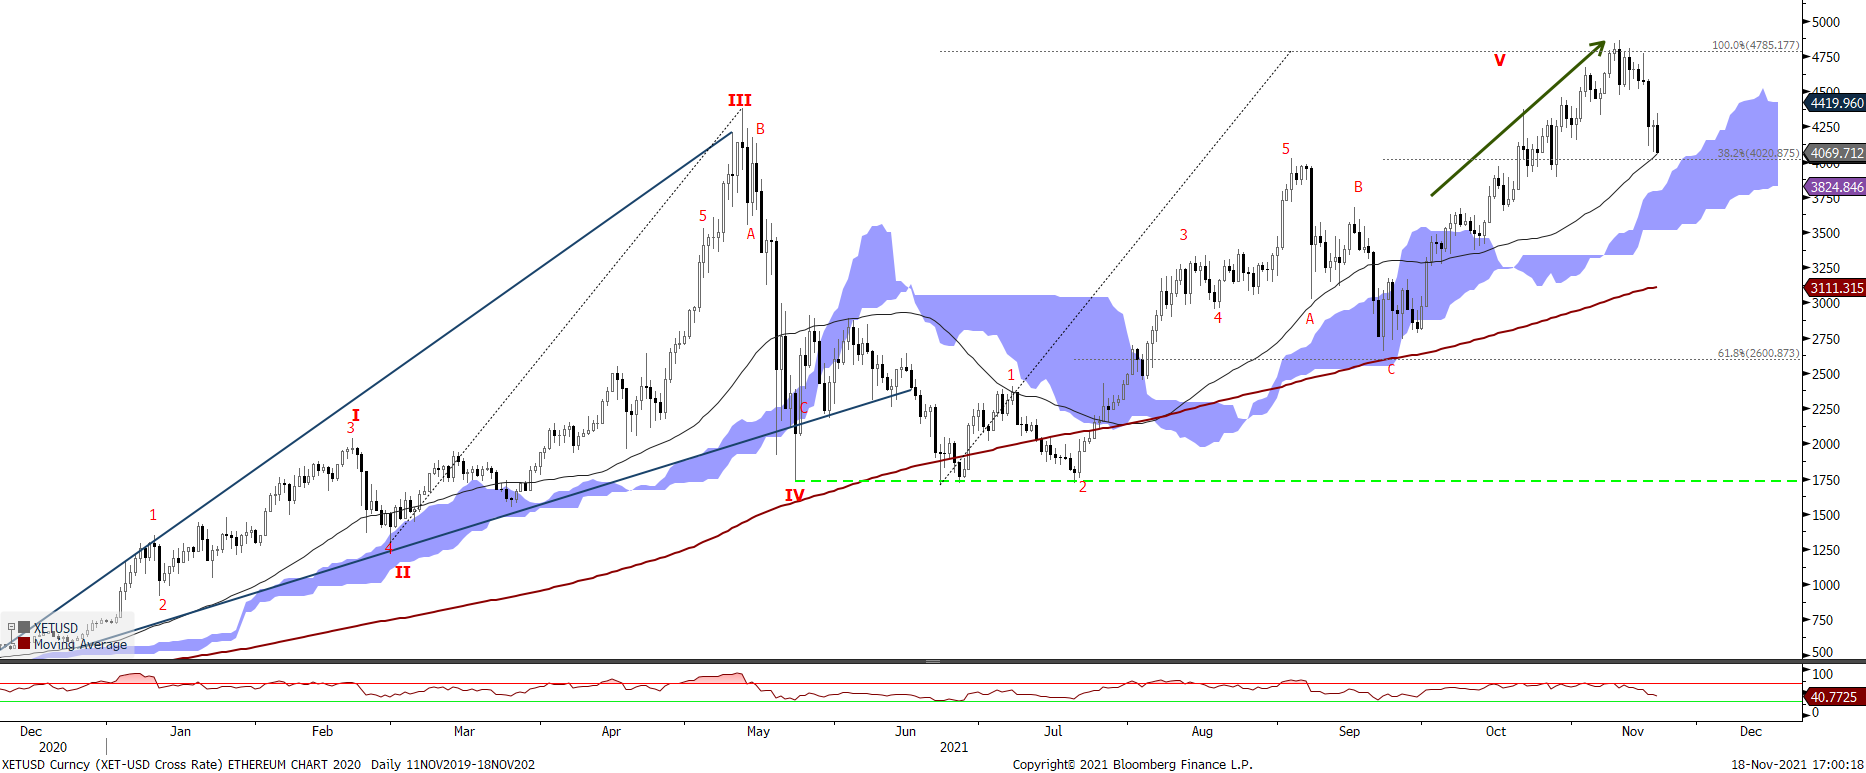
We are starting a new blog on Cryptos, preparing our coming fund. It can be found here…
Chart 20: Ethereum – wave V target Reached at 4782, correction to 38.2% fibo at 4020
Bitcoin prices are in an Elliott wave pattern with 86,000 as medium run target wave V. Before that expect a wave 3 at77,500, corrected to wave 4 at 64,000:
Chart 21: Bitcoin – bullish reversal
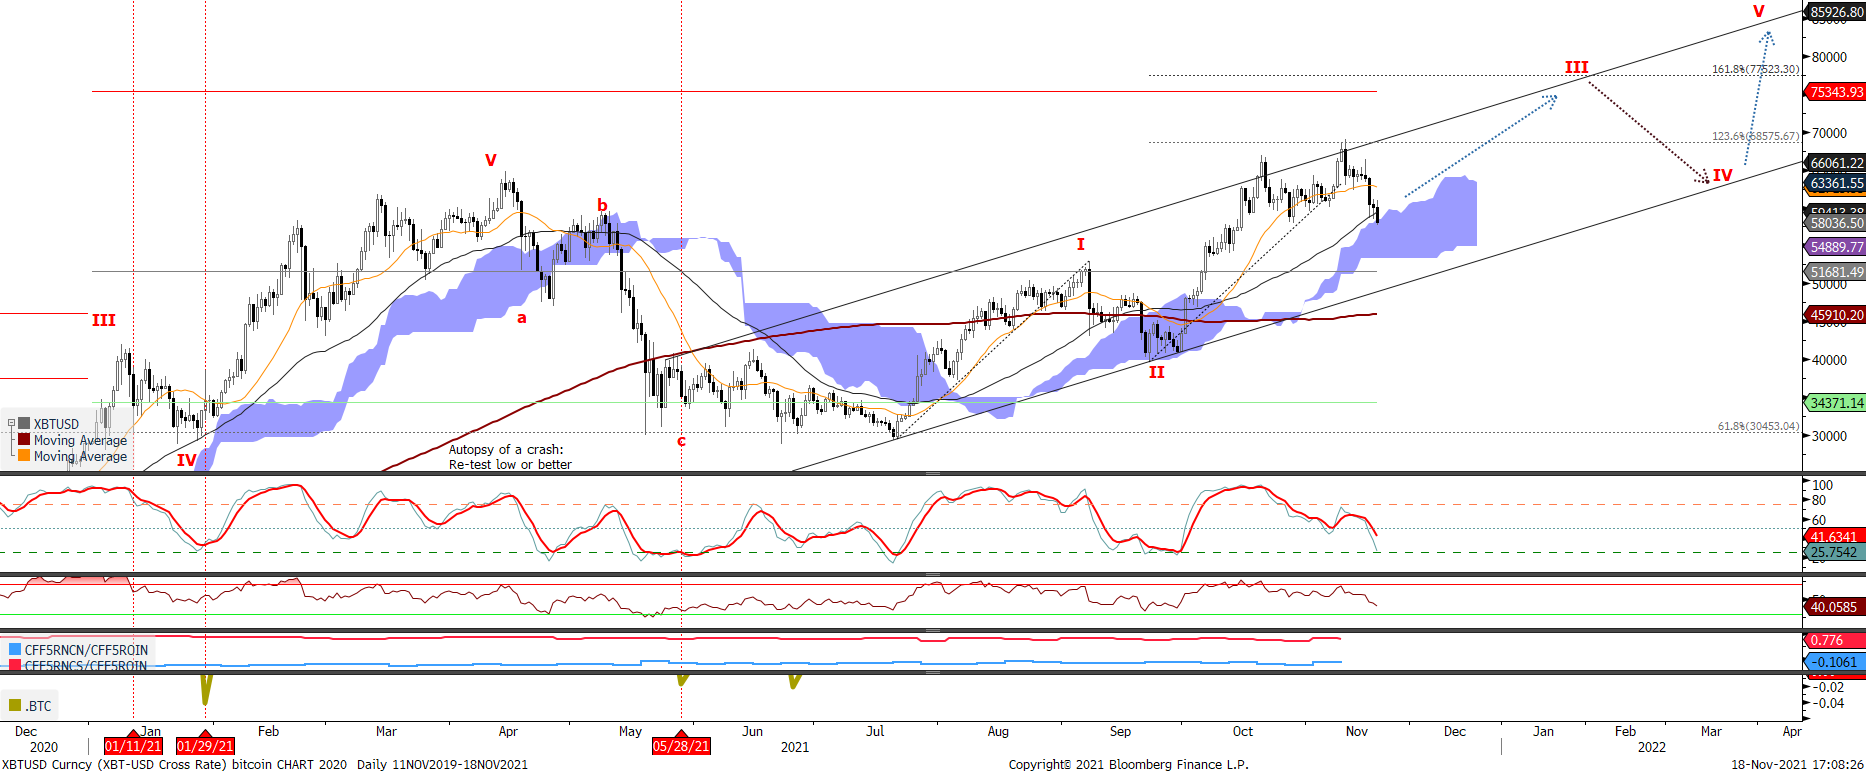
Chart 22: Eurostoxx50 – on its way to 4350/ 4428 then all time high at 4572
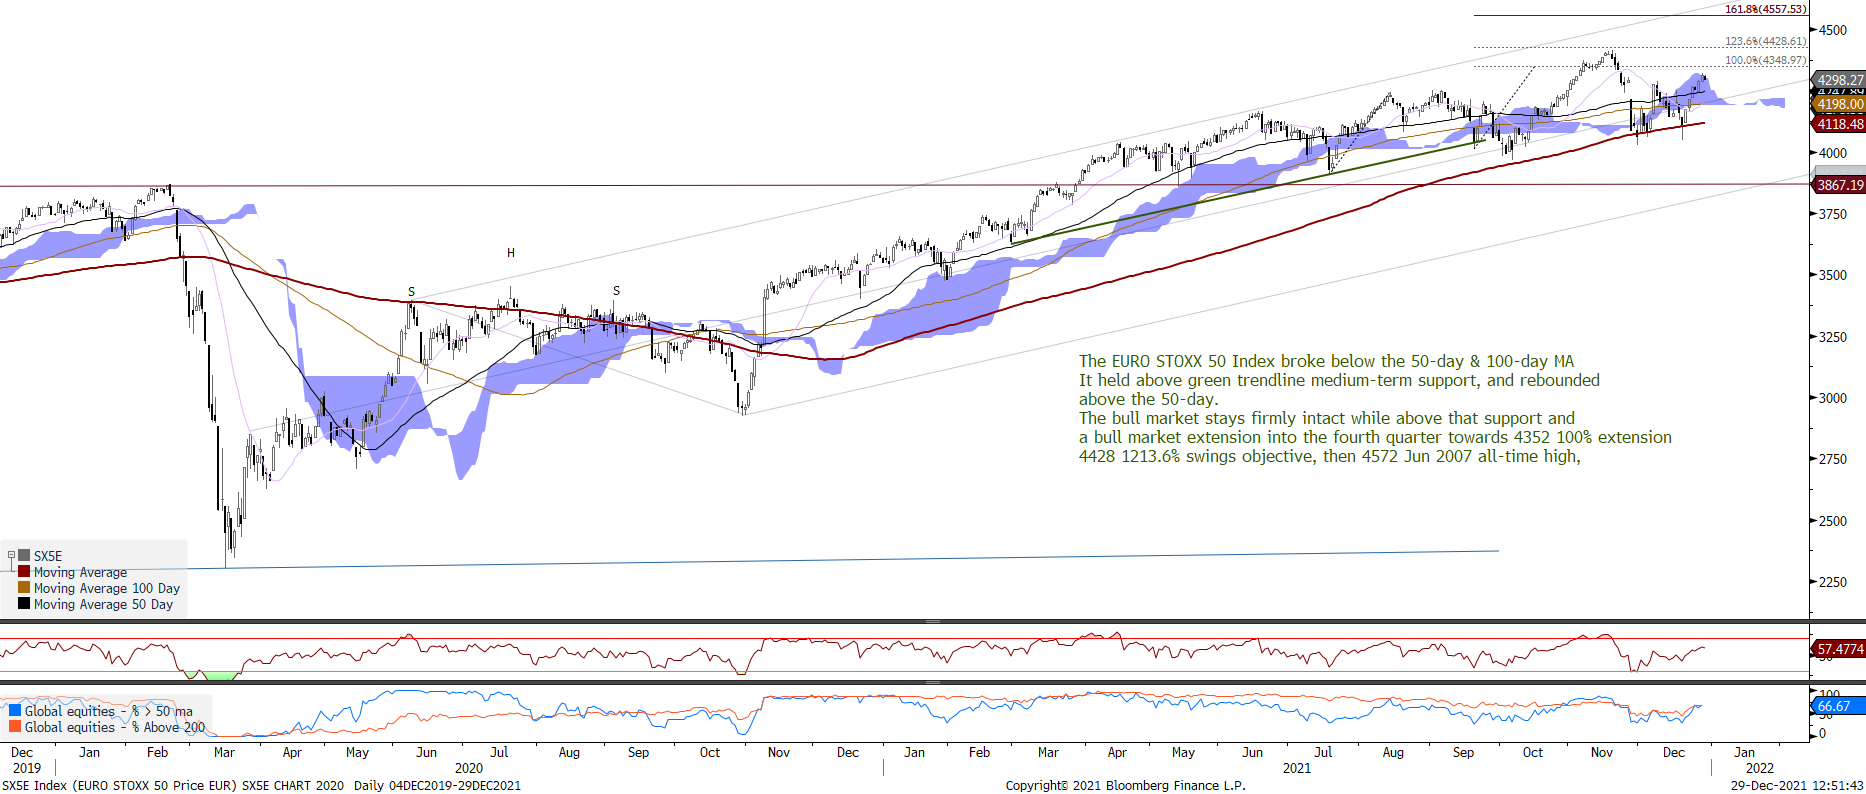
Chart 23: US 10 YR – US 10 YR RATES gowing South ?
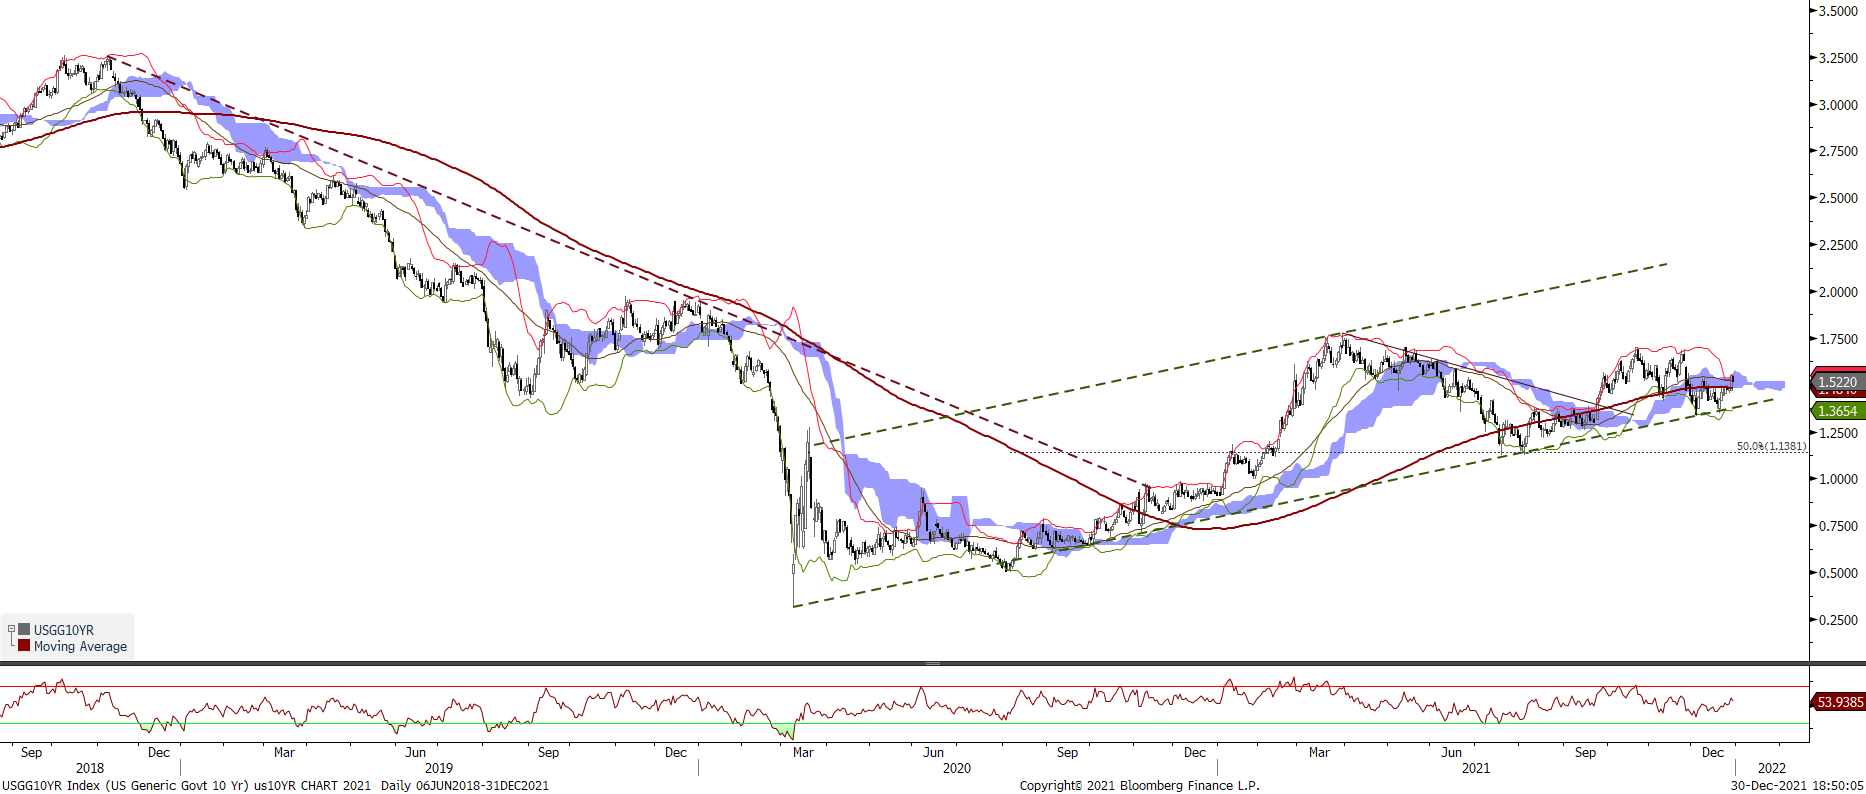
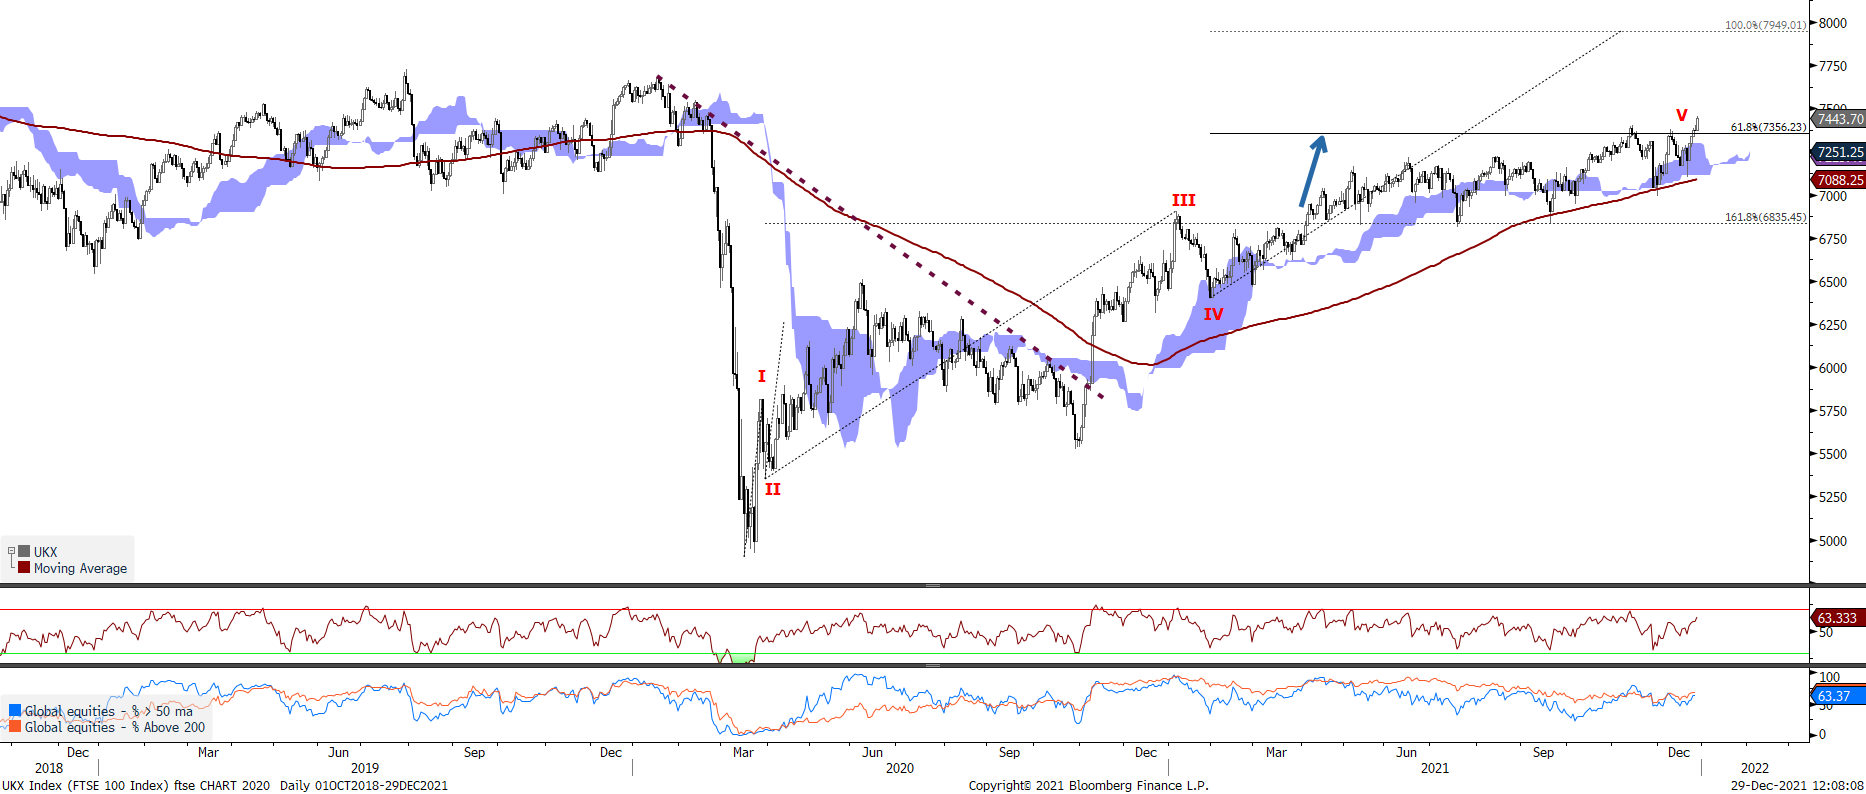
Chart 24: FTSE has reached its wave 5 target
FRACTALS
MACHIN Fractal: dec 20th, Manchin refused to vote the budget. Up at open clx, psa, mrk, dhr, nflx, T, WMT, EA (looks like a covid resurgence fractal mixed in it with Moderna announcing booster)
FED Fractal – November 22, 2021: Powell Re-nomination – first 15 minutes moves: USd up from 1.1287 to 1.1238, SPX up from 4709 to 4728, XLF up 1%, US 10 year reates 1.58% to 1.59%, TAN uip 2%, XLV/XLP down, XLB up 1%, smh up 2%, xop/xle flat, rty up 0.8% (down after 5 minutes to 0.3%), – after 2 hours: esz1 0.7%, NQZ1 0.25% down, RTYZ1 uè 0.8% up, XLF up 2%, AMZN from +0.56% to -2%, XOP +3%, xlu up 0.7%, xlp +1.2%, FB from +2% to -0.8%, aapl stays up 3%
Inflation risisng Fractal – December 14th, PPI very strong before Fed meeting. RTY up, nasdaq down, 10yr rate up, dxy up, sectors: xlb +0.6%, XLf +1%, xlu -0.3%, xlp -0.2% , xly -0.66% , xle +0.6& at 16 swiss time. With the record-breaking PPI read, the pressure on the Fed to pick up the pace of tightening is only mounting. And with higher prices Stocks Drop as Inflation Spike P
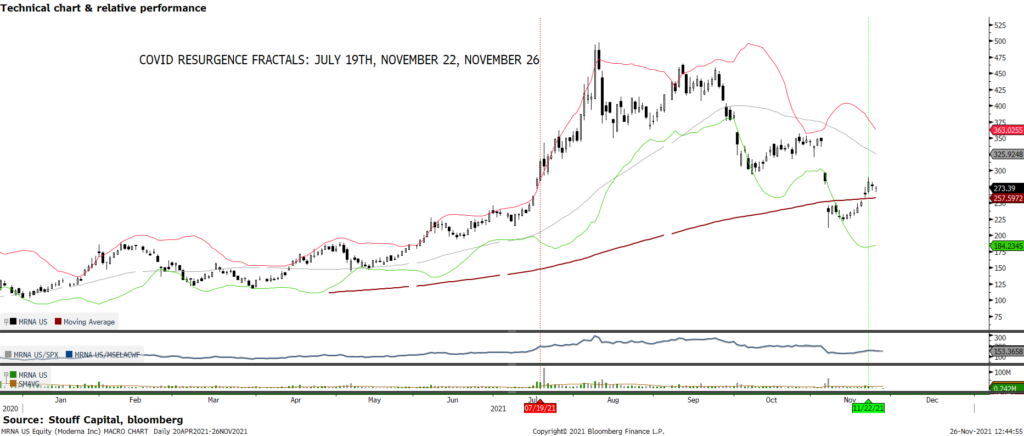
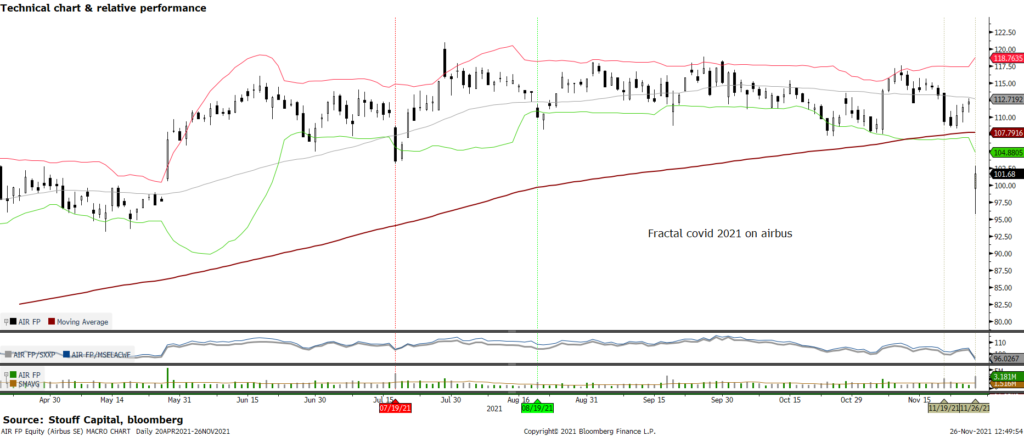
COVID resurgence – Covid is still the most powerful force in the markets, driving market action more than inflation in the short term. There are the following prior fractal dates: (1) November 22, 2021: Covid resurgence – usual suspects: MA US -5%, ABNB -8%, PYPL -4%, SQ -8%, AFRM -10%, UBER -4%, shop -5%. MRNA +9%, (2) November 26, 2021 : new variant from South Africa, B.1.1.529. In 2021, other dates for Virus resurgence are July 19th, surging Covid-19 cases in the U.K. and concern that the spread of the delta variant will halt the economic recovery – this fractal has similarity with Nov 26 as in the middle of holidays (less liquidity). The selling followed a familiar Covid-era pattern. Shares of companies that cater to stuck-inside consumers, like Zoom Video Communications (ZM), and vaccine-makers Moderna (MRNA) and Pfizer (PFE), rose, while reopening stocks like Delta Air Lines (DAL), Ryanair (RYA ID) and Meituan (24551 HK) each down more than 8%. The chart below on Moderna spots the 2 fractals in 2021:
IPO – showing end of cycle behaviour ?
The market for IPO stocks in 2021 will go down in the record books as the hottest on record.
The IPO year started with such notables as Roblox hitting the market, just recently featured a mega-offering with Rivian, and will end with more massive companies squarely on investors’ radar.
As of now, 2021 has seen 372 traditional IPOs and 535 Special Purpose Acquisition Companies, or SPACs, for a total of 907 companies ringing up $266 billion in proceeds. Looming behind a record-breaking run for IPOs in 2021 is a darker truth: After a selloff in high-growth stocks during the waning days of the year, two-thirds of the companies that went public in the U.S. this year are now trading below their IPO prices. Traditional initial public offerings raised more money than ever before in 2021, as startup founders and early investors tried to cash in on sky-high valuations. In the first eight months of the year, IPO shares rose. In November, 2021’s class of IPOs were trading up 12% on average. By late December, they traded 9% below their IPO prices. On the heels of soaring inflation, central banks signaled they will raise interest rates next year, prompting a broad selloff in technology stocks. The allure of many IPOs is that the companies can one day deliver big profits. But they also could flop. Higher available interest rates change the opportunity-cost calculus for investors who are betting on growth companies’ profits far into the future. When rates are near zero, it may make more sense to pay a premium for the potential of big future returns. When rates rise, the proposition becomes less appealing.
COMING EVENTS
GLOBAL CALENDAR
19-Dec-21 HK Hong Kong legislative elections
Feb/Mar 2022 IN India state legislative elections
09-Mar-22 KR South Korea presidential election
27-Mar-22 HK Hong Kong Chief Executive elections
10-Apr-22 FR France presidential / legislative elections
24-Apr-22 FR France presidential / legislative elections, second round
Apr-22 HU Hungary parliamentary elections
May-22 GE Germany state elections
09-May-22 PH Philippine presidential / legislative elections
21-May-22 AU Australian election deadline, 40 out of 76 Senate seats up for re-election
29-May-22 CO Colombia presidential election
03-Sep-22 AU Australia election deadline, House of Representatives
02-Oct-22 BR Brazil general elections
30-Oct-22 BR Brazil general elections, second round
08-Nov-22 US US midterm elections
Next week EARNINGS
None
Past events & EARNINGS
EV startup Rivian (RIVN) delivers its first quarterly report as a publicly traded com- pany late Thursday. Analysts polled by FactSet expect a quarterly loss of $1.33 a share, with sales projected at $926.4 million. Wall Street analysts began coverage of the company last week. Most initiated at a buy rating, with a few holds as well. Price targets ranged from $104 to $165, with the mean around $134. The first Rivian R1T truck rolled off the production line in Sep- tember. As of Oct. 31, Rivian had produced 180 units and delivered 156. The company went public Nov. 10. Shares rocketed as high as 179.47 but have since pared back gains. RIVN stock traded about 48% above its IPO price this past Friday
NetApp sees growth, The company (NTAP) reports Q3 results Tuesday. The consensus looks for earnings per share of $1.21, up 15%, on revenue of $1.55 billion, up 10%. NetApp provides data-storage networking and management products.
Data analysis companies Elastic (ESTC), Splunk (SPLK) and Box (BOX) all report earnings. Elastic reports fiscal Q2 results Wednesday, with an EPS estimate for a 16-cent loss vs. a 3-cent loss. The revenue es- timate is $194.6 billion, up 34%. Splunk also reports Tuesday.
The Q3 EPS consensus looks for a 50-cent loss (vs. a 7-cent loss) on revenue of $647 million, up 16%. Splunk is undergoing a cloud transition to a software-as-a-ser- vice business model. Box reports Tuesday. The Q3 EPS consensus is 21 cents, vs. 20 cents, on revenue of $218.6 million, up 12%.
- NOV 22 – A, ZM
- NOV 23 – ADI, ADSK, AEO, BBY, BURL, DELL, DKS, DLTR, GPS, HPQ, JWN, PLAN, VMW
- NOV 24 – DE, NETI, QADB
- NOV 25 – Market Closed
- NOV 26 – BTTX, KD
Consumer electronics retailer Best Buy (BBY) reports fiscal Q3 results Tuesday. It also provides its forecast for the holiday shopping season, which could be marred by product shortages due to supply chain problems. Analysts expect EPS of $1.93 on sales of $11.59 billion. That translates to year-over-year declines of 6% in EPS and 2% in sales. Results could get a boost from the launch of the company’s new tech ser- vices subscription program.
Urban Outfitters (URBN) will report Q3 earnings on Tuesday, while Abercrombie & Fitch (ANF), American Eagle Outfitters (AEO) and Gap (GPS) report on Wednesday. FactSet analysts expect Urban Outfitters to post EPS of 84 cents, 8% above the year- ago quarter, on a 16% increase in sales to $1.12 billion. Views for ANF are for EPS to fall 13% to 66 cents, while sales pick up 9% to $895 million. Analysts see American Ea- gle EPS surging 74% to 61 cents and sales growing 19% to $1.23 billion. Estimates for Gap are for EPS to double to 50 cents and sales to climb 11% to $4.43 billion.
Zoom Video’s growth cools, Zoom Video Communications (ZM) reports Q3 earnings late Mon- day. Analysts expect EPS of $1.09, up 10% from a year earlier. Reve- nue will grow 31% to $1.02 billion, analysts estimate.
VMware gives update
VMware (VMW) reports Q3 earn ings Tuesday. Dell Technologies (DELL) spun off the enterprise software maker on Nov. 1. Analysts estimate EPS of $1.54, down 7% from a year earlier. Revenue will rise 8% to $3.1 billion, analysts estimate.
Anaplan looks to grow, (PLAN) reports Q3 earnings late Tuesday
Discount retailers Dollar Tree (DLTR) and Burlington Stores (BURL) report Q3 earnings on Tuesday. Wall Street expects Dollar Tree to earn 96 cents per share, down 31%, as revenue rises 4% to $6.41 billion. Burlington is expected to earn $1.25 per share, a 331% jump, on revenue up 34% to $2.23 billion. Both retailers report as the economy’s rebound runs up against disruptions in the supply chain that have caused product delays and pushed shipping costs higher.
Deere Gives Post-Strike Report
Farm equipment maker Deere (DE) is ex- pected to report 63% higher Q3 profit of $3.89 a share on Wednesday. Meanwhile, revenue is seen jumping 22% to $10.57 billion. The strong results are coming amid the conclusion of a heated conflict with workers over pay and benefits. The com- pany and workers agreed to end a strike after forging a new six-year contract.
Dick’s Sporting Sees Growth
Dick’s Sporting Goods (DKS) will report Q3 results before the market opens Tuesday. FactSet analysts see earnings edging up 1% to $2.03 per share with sales up 3% to $2.48 billion. Supply chain shortages coupled with rising inflation have been big issues for retailers in the third quarter and heading into the important holiday shop- ping season.
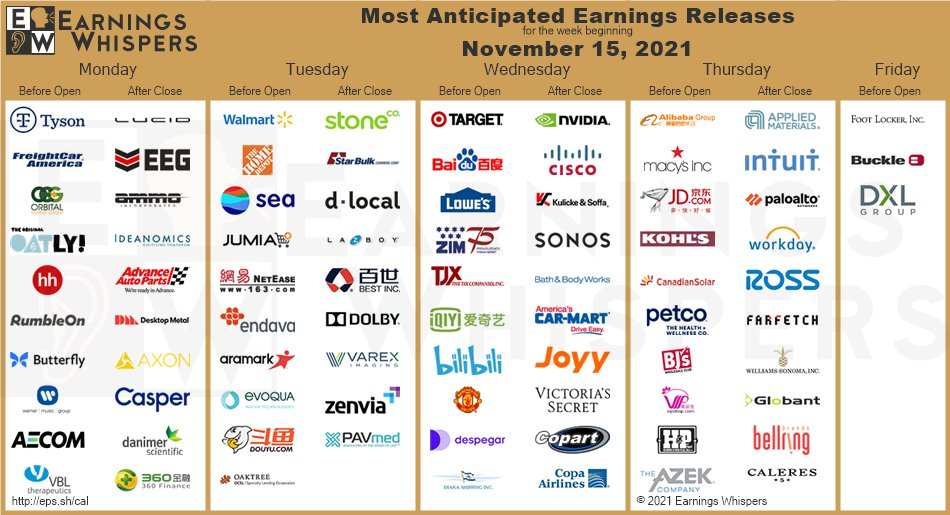
Nov 15 – Advance Auto Parts, Lucid Group, Tyson Foods, and Warner Music Group release quarterly results
Nov 16 – Walmart reports third-quarter fiscal-2022 earnings before the opening bell. Shares of the retail behemoth have trailed the S&P 500 by 21 percentage points this year, despite Walmart raising full-year guidance, Home Depot and TransDigm Group report earnings
Nov 17 – Cisco Systems, Lowe’s, Nvidia, Target, and TJX Cos. announce quarterly results; NVIDIA Corporation (NVDA) plans to post earnings and revenue for its third quarter in fiscal year 2022 after the stock market closes on Wednesday, November 17. Third-quarter earnings are forecast to grow 50.7% year-over-year to $1.10 per share, up from $0.73 per share in the same quarter a year ago. Third-quarter revenue is expected to rise 44.2% year-over-year to $6.82 billion. Analysts have slightly increased earnings estimates over the past three months.
Nov 18 ~ Alibaba Group Holding, Applied Materials, Intuit, JD.com, Ross Stores, and Workday hold conference calls to discuss earnings
Nov 08 ~ Virgin Galactic (SPCE) will report Q3 results after the market closes Mon- day. Analysts expect a loss of 28 cents per share vs. a loss of 34 cents in the year-prior on revenue of $1.4 million. In October, Richard Bran- son’s commercial space company said that it would delay the start of commercial flights until Q4 of 2022 as it starts its lengthy enhancement and refurbishing program.
Nov 09 ~ Cryptocurrency exchange Coin- base (COIN) reports Q3 earnings on Tuesday. Wall Street expects the company to earn $1.73 per share, on revenue of $1.57 billion. The results follow Coinbase’s warn- ing, in August, of lower trading volume and active users for the quarter, after a drop in crypto prices and trading action. Bitcoin has since rebounded. Coinbase
in September halted plans for a lending program after pressure from the Securities and Exchange Commission. But it also teamed up with Meta Platforms (FB) to help with storage services for the social-media company’s new dig- ital crypto wallet.
NOV 10 – AFRM, APP, BMBL, BROS, BYND, COMP, DIS, FBRT, FICO, FIGS, FOUR, GDRX, GTII, ME, ML, MQ, MRVI, OLPX, OPEN, PHAT, PROG, RDW, RELY, SLVM, SOFT, TASK, WISH
NOV 11 – ACHR, ARRY, AVIR, BLNK, BTTX, CELH, CMO, LIDR, OGN, PHUN, TPR, YETI
NOV 12 – BKKT, CIFR, GTLB, IRNT, MARA, MIR, WRBY
Nov 11 ~ Hut 8 Mining (HUT), a digital-asset miner, reports earnings on Thursday.
IPO EARNINGS COMING: Affirm Holdings (AFRM) reports fiscal first quarter earnings late Wednesday. Analysts expect the company to report a loss of 35 cents per share, vs. a 22-cent loss in the year earlier period. Revenue is expected to climb 43% to $248.7 million. The consumer financing firm launched its initial public offering in January. It’s a leader in the buy now, pay later trend. Upstart Holdings (UPST) reports Q3 earnings Tuesday. Analysts estimate EPS of 33 cents, up 57% from a year earlier, with revenue growing 225% to nearly $215 million. Upstart uses artificial intelligence tools to provide consumer credit analytical services to banks. Palantir Technologies (PLTR) reports Q3 earnings on Tuesday. The maker of enterprise software is expected to report a 4-cent profit, down a penny from a year earlier. Revenue will climb 33% to $385 million, analysts estimate.
Toast (TOST) reports Q3 earnings Wednesday. Analysts expect the company to report a 27-cent loss on revenue of $433.6 million. Toast launched an initial public offering in September. Toast provides a financial technology services platform for the restaurant industry. AppLovin (APP) reports Q3 earnings late Wednesday. Analysts expect the company to report an adjusted EPS of 38 cents on $697.8 million revenue, says S&P Global Market Intelligence. AppLovin launched an IPO in April. It’s a marketing software developer and provides tools for monetizing mobile apps. PubMatic (PUBM) reports Q3 earnings late Tuesday. Analysts expect profit to fall to 9 cents a share from 25 cents a share in the year-earlier period. The digital advertising firm’s revenue will climb 39% to $52.5 million, analysts estimate. Semrush Holdings (SEMR) reports earnings early Wednesday. The consensus looks for 3 cents a share loss on revenue of $47.5 million, up 48%. The internet company held its IPO in March, Cricut (CRCT), a recent IPO, reports earnings late Wednesday. The consensus looks for earnings of 16 cents on revenue of $267 million for the maker of computer con- trolled cutting machines. Global-e Online (GLBE), an e-com- merce company, reports quar- terly results late Tuesday. The consensus looks for a 1-cent profit on revenue of $55.7 million. The company held its IPO in June.
Figs (FIGS), a health care apparel brand, will report Q3 results after the market closes Wednesday. Analysts expect the recent IPO to report EPS of 3 cents on revenue of $98.9 million.
NOV 1 – ANET, BEN, CAR, CEI, CHGG, CLX, FANG, GXO, HOLX, IVT, LXU, MOS, O, ON, PCG, RIG, RRX, SBAC, SPG, WFRD, WMB, ZI
NOV 2 – AKAM, AMC, AMED, AMGN, APO, APPS, ATVI, AYX, BHC, BLMN, BXC, CHK, CMI, COP, COUR, CRSR, CTLT, CZR, DD, DVN, EL, EPD, ESPR, ETN, EXAS, FMC, FRSH, GNRC, GPN, GRBK, IDXX, ISEE, KKR, LPSN, LYFT, MDLZ, MLM, MPC, MTCH, NRZ, OVV, PFE, PRU, RL, ROK, RPAI, SABR, SNCY, TMUS, UAA, VAL, VRTZ, WU, ZBRA, ZG
NOV 3 – ALB, ALL, ALTM, APA, BKNG, BWA, CDW, CF, CHNG, CLR, CTRA, CVS, CWH, DAR, DISCA, DXC, EA, EMR, EQIX, ET, ETSY, EVA, EVH, EXC, FLT, FSLY, FSR, FYBR, GDDY, HUBS, HUM, HZNP, IONS, LHCG, LUMN, MAR, MET, MGM, MGNI, MPLN, MRO, MTTR, NCLH, NFE, NYT, ONEM, PCRX, PTC, PXD, QCOM, QRVO, ROKU, RRD, RVLV, SBGI, SBRA, SKLZ, SMG, SPR, SPWR, SRPT, SWN, TRUP, TSP, TTWO, TXG, UTHR, VMEO, VVV, ZD
NOV 4 – ABNB, AES, AIG, ALLO, AMN, APD, ATUS, AVIR, BALY, BDX, BE, BIGC, BILL, BLDR, BLI, BLL, BLUE, BRPM, CFLT, CI, COLD, COMM, CTXS, CVNA, DBRG, DBX, DDOG, DEN, DNB, DOCN, DUK, ED, EPAM, EXPE, FATE, FIS, FND, FSLR, FTNT, GBT, GEO, GH, GTN, HBI, HEAR, HTA, HWM, IAC, IHRT, ILMN, HYNT, K, LITE, LNG, LTHM, LYV, MCHP, MNDT, MNST, MP, MRNA, MRTX, NET, NKLA, NLOK, NRG, NTLA, NVAX, OHI, OPCH, OXY, PAE, PCOR, PENN, PH, PINS, PLNT, PRCH, PTGX, PTON, PWR, QDEL, RDFN, REGN, RKT, RUN, SHAK, SQ, SSYS, SWKS, TGNA, UBER, UNIT,
NOV 5 – ADMA, ADMS, BBIO, CNK, CSOD, D, DISH, DKNG, DNMR, ELAN, EOG, FLR, GT, HRC, JCI, KDMN, NOG, OCGN, OCUL, PNW, SHPW, SWX, TELL, TSE, VER, VST, WYNN, XLRN, XPOb
MONDAY OCTOBER 25
German IFO Business Climate: drop to 97.1 from 98.8, as manufacturing remains depressed due to supply chain disruptions.
TUESDAY OCTOBER 26
OCT 26 – MSFT, GOOGL
US New Home Sales: We forecast a 2.1%M increase in new home sales in September to a 755k unit pace following a 1.5%M increase in August.
US Consumer Confidence Index: We expect Conference Board Consumer Confidence in October to hold fairly steady, increasing by just 0.2 points to 109.5, after dropping for three consecutive months.
WEDNESDAY OCTOBER 27
US Durable Goods Orders: forecast that durable goods orders in September declined by 0.8%M vs. +1.8%M in August.
Canada BoC Rates Decision: BoC reducing the pace of its asset purchases to C$1 billion/week, while updated forecasts should show lower growth this year, offset by higher growth in 2022 and 2023, which should on balance keep forward guidance unchanged.
Brazil COPOM Rates Decision: The central bank should accelerate the hiking pace to 125bp, bringing rates to 7.50%, on the back of the recent fiscal development with the breach of the spending cap.
THURSDAY OCTOBER 28
Japan BoJ Rates Decision: BoJ to maintain the status quo in terms of monetary policy.
Japan Retail Sales: retail sales to decline by 2.9%Y in September.
ECB Rates Decision: uneventful meeting ahead of two special meetings to prepare the December decision, where we expect PEPP wind-up on schedule, to be replaced by a more flexible APP.
German CPI: expect headline CPI to rise to 4.4%Y on the back of rising energy inflation.
US GDP: 3Q21 real GDP at 2.3%Q annualized growth vs. +6.7%Q in 2Q21.
FRIDAY OCTOBER 29
Japan Unemployment Rate: expect the unemployment rate to be at 2.9% in September.
Japan Industrial Production: expect industrial production to decrease by 3.8%M in September.
French GDP: 1.9%Q pick-up after a weak 2Q21, as most of the reopening happened in 3Q. Both consumption and investment should come in strong.
Eurozone GDP: Due to a slowdown in activity on supply-side issues, expect a 2%Q pick-up in 3Q21, with the pace of growth thus having peaked in 2Q21.
OCT 20 – ABT, ANTM, BIIB, BKR, CCI, CEI, CFG, CSX, IBM, KMI, LAD, LRCX, LVS, MKTX, NDAQ, NEE, OMF, PPG, SLG, TER, THC, TSLA, UMPQ, VZ
OCT 21 – AAL, ALLY, AN, AXTA, BX, CMG, CROX, DHR, DOW, FCX, GTLS, HRI, INTC, IQV, KEY, LUV, MAT, NUE, POOL, SAM, SIVB, SNAP, T, TSCO, UNP, VLO, WHR
OCT 22 – AXP, CLF, HCA, HON, ROP, SLB, STX, VFC
MONDAY OCTOBER 18
Industrial Production. The Federal Reserve will release its monthly industrial production report for the prior month at 8:30 a.m. Eastern. It measures the physical output of the nation’s factories, mines and utilities.
TUESDAY OCTOBER 19
Netflix Company (NFLX) will report Q3 results late Tuesday. Wall Street expects Netflix to post a big gain in subscriber growth thanks to its hit show “Squid Game.” Analysts expect Netflix to add 3.8 million streaming subscribers in the September quarter, vs. the company’s target of 3.5 million new subscribers. Analysts forecast Netflix earnings of $2.57 a share on sales of $7.48 billion. That would translate to year-over-year growth of 48% in earnings and 16% in sales. For the December quarter, analysts think Netflix will add 8.45 million new subscribers.
United Airlines (UAL) reports Q3 earnings on Tuesday, while Southwest Airlines (LUV) reports on Thursday. Wall Street expects United to lose $1.59 per share, as revenue jumps 204% to $7.56 billion on a rebound in travel demand. Southwest is expected to lose 27 cents per share, with sales up 155% to $4.58 billion. The companies will report as the industry deals with rising fuel costs and hiring challenges, and after Southwest canceled scores of flights this month. Alaska Air (ALK) also reports during the week.
Housing Starts and Building Permits. The Commerce Department will release this monthly report at 8:30 a.m. Eastern. Broken down by region, the report measures the number of residential units on which construction began last month. Building permits are permits issued in order to begin excavation. An increase in housing starts and building permits usually occurs a few months after a reduction in mortgage rates.
WEDNESDAY OCTOBER 20
Biogen earnings – (BIIB) will report Q3 results before the market opens Wednesday. The next key catalyst for the stock will be a Medicare national determination on coverage for Aduhelm. As most Alzheimer’s patients are covered by the government-backed program, that decision will mean even more to Biogen’s sales than the recent pushback from private payers. With so much negative media coverage and approval backlash, it’s reasonable to worry that the Aduhelm brand could be permanently harmed ?
Tesla earnings – (TSLA) will report Q3 results before the market opens Wednesday. For the third quarter, Wall Street expects $1.54 in per-share earnings from $13.7 billion in sales. In the second quarter, Tesla earned $1.45 a share from $12 billion in sales. Tesla doesn’t provide guidance, creating the possibility of wild post-earnings trading in unexpected directions. Things should be better than analysts project. Tesla delivered a record 241,300 vehicles in the third quarter, up from 201,250 in the second quarter. That’s a 20% increase. Tesla’s average price per car in the second quarter amounted to roughly $49,000, and while that number can change, 40,000 more vehicles could easily mean about $2 billion more in sales. Tesla delivered a record number of cars in China during the third quarter — almost 74,000, up about 20% compared with the second quarter. The cars Tesla produces and sells in China have higher margins than those made there and exported to Europe. With Tesla delivering about 12,000 more vehicles in China during the third quarter compared with the second quarter, profit margins could hold up. Together, that means the bar for Tesla is much higher than it looks. That’s particularly true because its stock has gained about 30% over the past three months, closing the week at $843.03 — even as the S&P 500 added 2.6%. That means Tesla will likely need a huge beat to give the stock a jolt, something close to $2 a share.
Semiconductor equipment maker ASML (ASML) plans to release its Q3 results early Wednesday. Analysts expect the Dutch lithography gear specialist to earn $4.61 a share on sales of $6.19 billion. That would translate to year-over-year growth of 54% in earnings and 33% in sales. ASML is benefiting from heightened capital spending by chipmakers on new equipment to increase capacity during the current chip shortage.
THURSDAY OCTOBER 21
Index of Leading Economic Indicators. The Conference Board will release this monthly report for September that is a compilation of economic indicators including: jobless claims, money supply, new orders, building permits and stock prices. It is a good predictor of patterns in the economy.
One of our US quantamental Longs (FCX) will report Q3 results after the market closes on Thursday. Freeport should see a significant increase in copper and gold volumes, in addition to ramping volumes at Lone Star and the restoration of mining and milling operations at Chino in North America. As major project capex declines in 2022+ (and 2024+ in particular), we model a major inflection in the company’s excess cash flows. The company recently announced a performance-based payout structure whereby it will target returning 50% of available cash flows to shareholders.
(T), kicks off the telecommunication earnings season Thursday. Analysts estimate EPS of 78 cents, up 2.6% from a year earlier. Revenue is expected to fall 1% to $41.7 billion. AT&T stock recently hit a 10-year low. Telecom stocks have been pressured by in- tensifying wireless competition as cable TV firms gain share.
FRIDAY OCTOBER 22
(SLB) will report Q3 earnings on Friday.
Tenet Healthcare (THC) is due to report Q3 results Wednesday, followed by HCA Healthcare (HCA) on Friday. The impact of the summer Covid wave on elective procedures is uncertain. Analysts expect Tenet EPS to jump 70% to $1.09. Revenue should grow 6% to $4.83 billion. HCA profit is seen more than doubling to $3.92 as revenue climbs nearly 9% to $14.47 billion.