During the past 18 months, we have shown, for information purposes, a theoretical performance of our recommended trades, long-only model portfolio of global stocks, and absolute return model portfolio. The performance has been quite good (from May 2018 to October 2019) and certainly demonstrates that our trading recommendations are making money in a very conservative manner. For 2019, as of Friday 11th, October, the return of our global equity absolute return portfolio is up +8.47% (see here). The bulk of the performance is attributed to European equities with nearly a 5% contribution.
Our primary goal through our radical transparency has been to continue explaining our process through the monthly letters (see here), the quantamental and purely quantitative portfolios (see here) and [quite unique] the divulgation of our main convictions through real-time trades. After one year of total transparency, we have decided to limit the access Only to the direct investors in the strategy managed by Stouff Capital or the subscribers of our research. Those who would be interested to get a pricing for this tactical research can write to [email protected]. We will continue publishing our main top down convictions on the public website www.stouffcapital.com (See here).
Since we launched our website in May 2018, our philosophy has been (as it was when we were managing the Pictet Trading Strategy from August 2013 to March 2018) to back our convictions by real-time trades and be assessed by a daily marked to market P&L. These trades can be classified in 3 styles: allocation trades, tactical trades and high conviction single stocks trades.
Allocation trades are chosen out of our various quantitative portfolios (low vol/high earning growth, U2 [unloved & undervalued], IPO) and quantamental regional portfolios (SC US long & short list, SC European Long & Short stock list, SC Asia & Japan long & short portfolios, New ESG portfolio created & managed by Julia). The difference between the quantitative and quantamental portfolios is that pure quantitative lists are systematically constructed only by algos and rebalanced at least once a month, while quantamental are constanly updated based on the mix of algos and fundamental convictions.
Tactical trades are sent when our quantamental process identifies local or major inflexion points in the ongoing trend.
Last but not least, we launch single stocks high conviction trades based on a mix of quantamental scoring (6 factors model weighted by the current market regime) and a list of technical signals which should improve the odds of success.
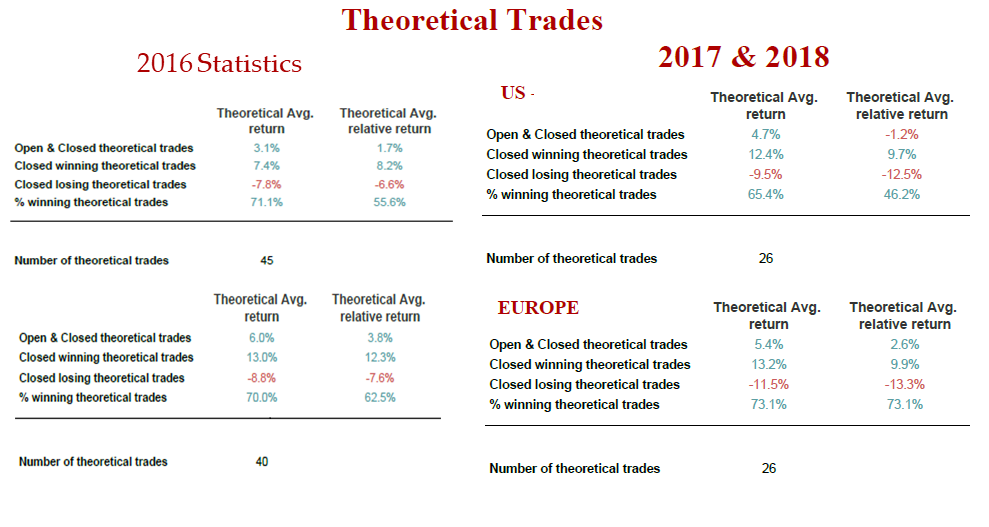
From August 2013 to March 2018, our trades had produced a gross 38.03% return and a win ratio between 60% and 80% per year (see tables on the right for the 2016 to 2018 statistics). Since we are independent we have kept a similar ratio. While our return is up around 10% in the last 15 months and up 8.47% year to date, our win ratio is close to 64%. The winning trades have produced +8% alpha. What’s more, this performance has been achieved through a low net delta oscillating between -10% and +30% with an average of +20%, and with a low gross exposure around 200%. It should be noted that this performance is based on the trades sent by mail to our members or subscribers and does not take into consideration any commissions or any fees (management or performance). If you wish to receive these trades in real-time, send us a mail at [email protected].
Review of the last 12 months
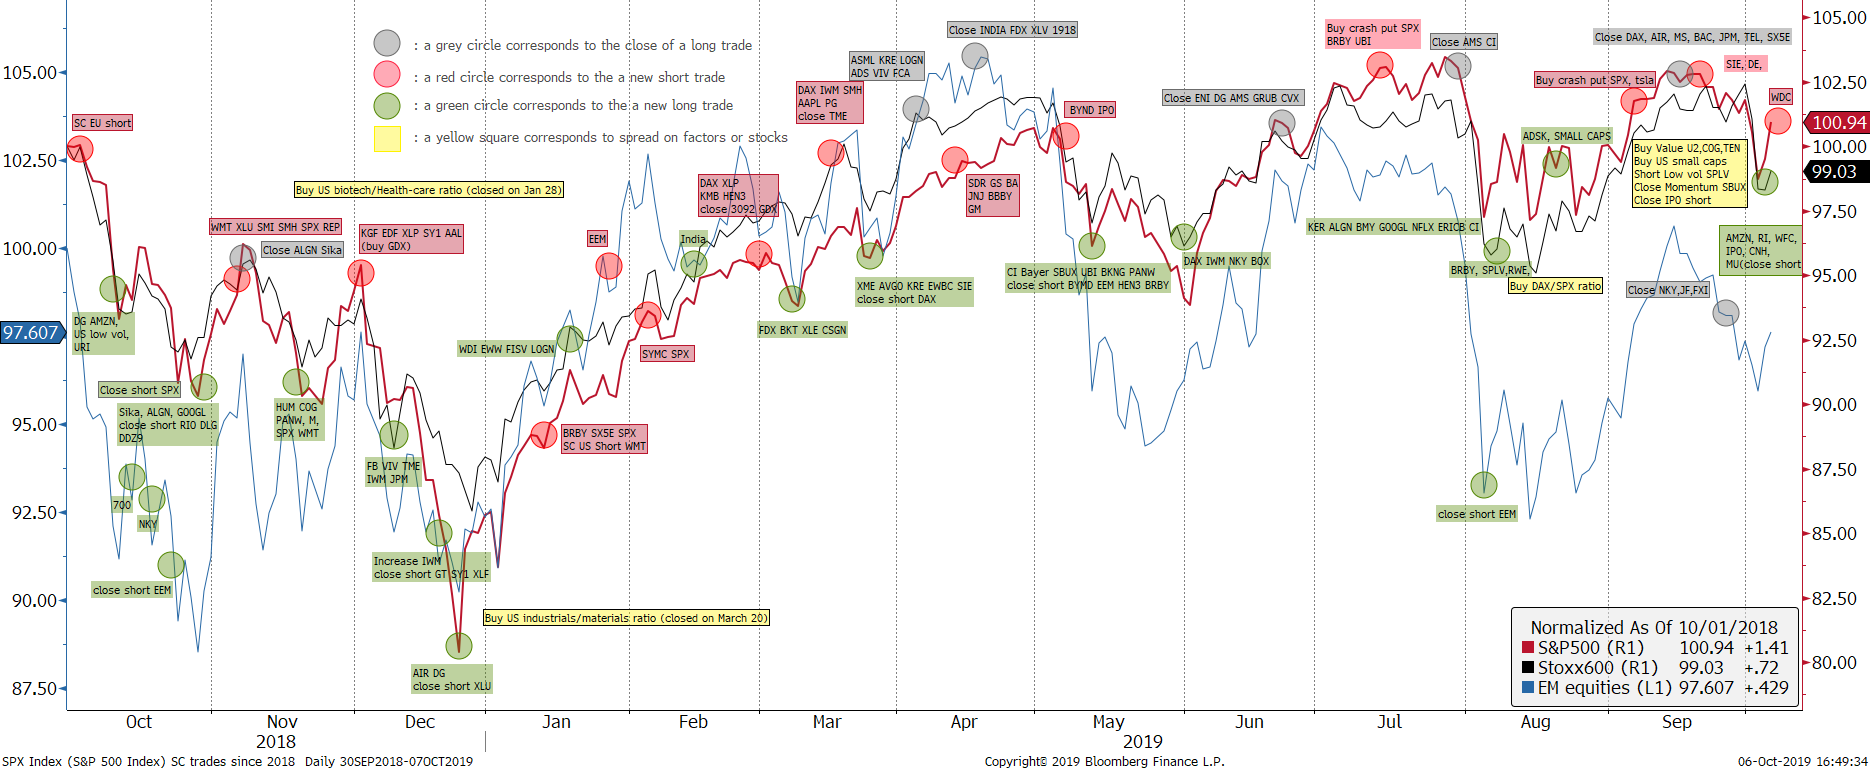
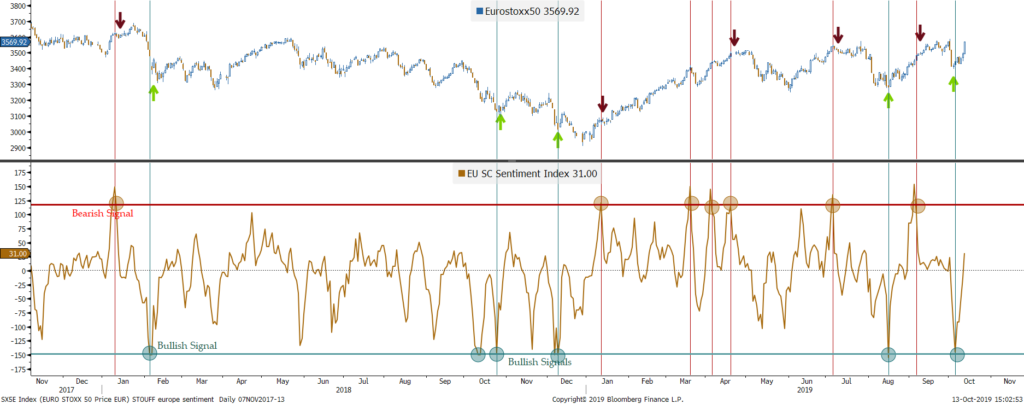
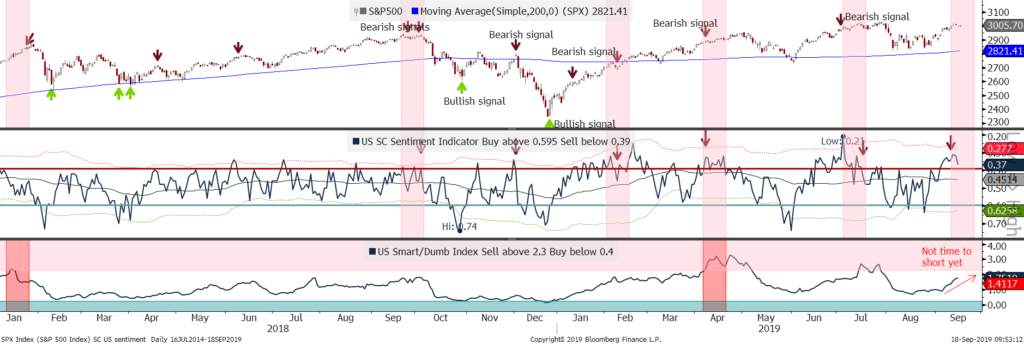
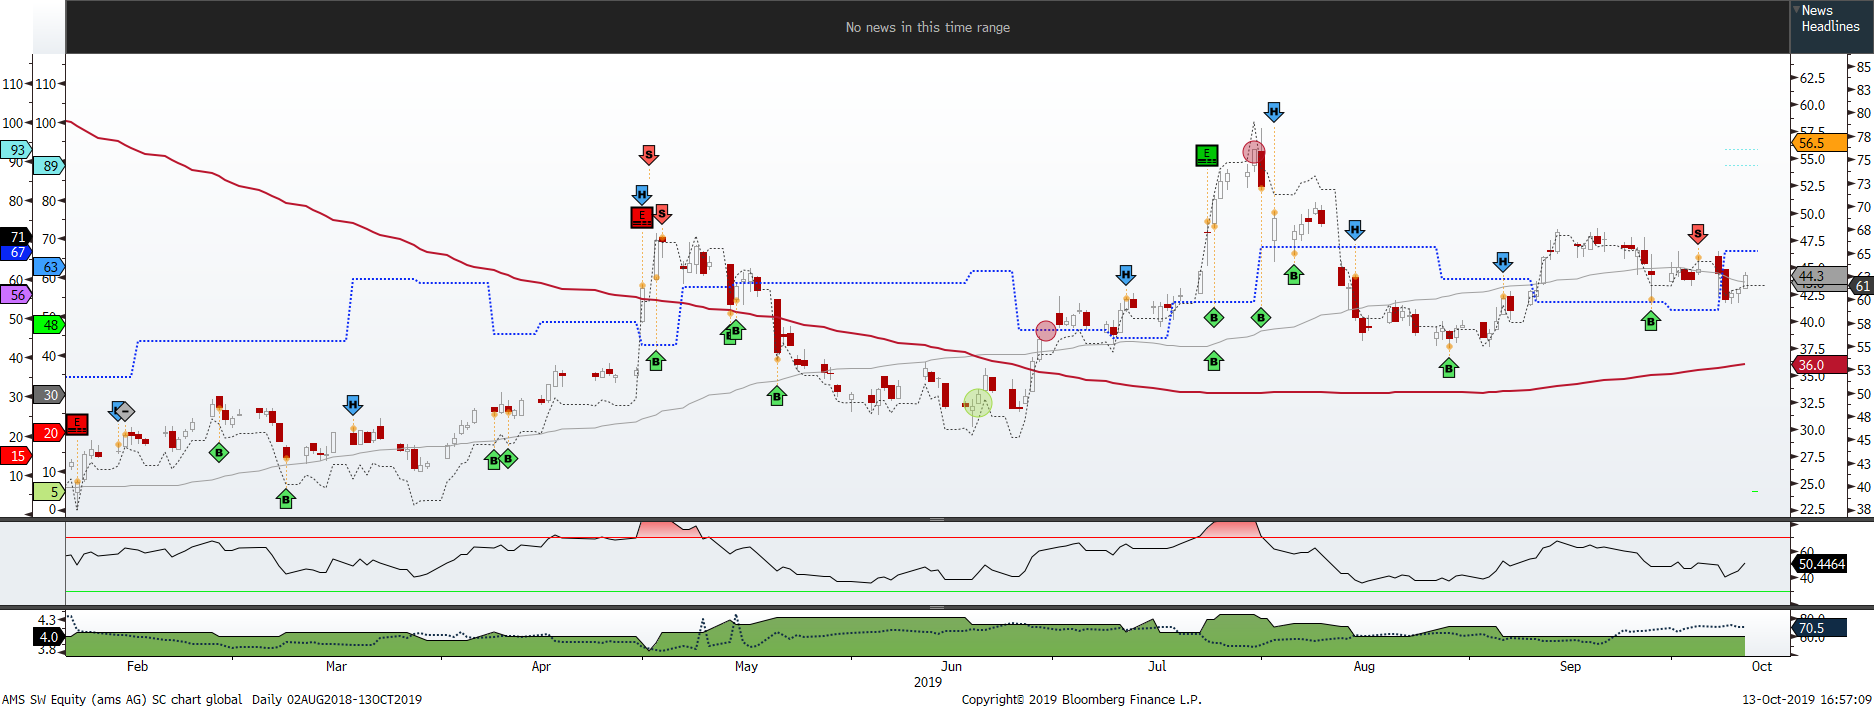
The chart above shows the various trades sent since September 2018. Shorts are coloured in red, longs in green, the close of longs in grey while pair trades are yellow coloured. One can observe that same coloured trades are clustered around specific periods. Part of the good performance comes from the fact that red and grey are mostly present in the local tops while Green in the local bottoms. While past performance does not guarantee future returns, we justify this efficient timing by the predictability of our Contrarian Sentiment models in this market environment. Indeed, while our process is definitely based on momentum [in price but also fundamentals mainly through earnings momentum], our quantamental contrarian approach helps us master inflexion points. For instance, the charts below shows how our European & US SC sentiment indicator should be used to time the market. We made 3 major market calls in the last 12 months: (1) In december 2018, we make a bullish call while equities are in a panic mode (please find our call which has been posted on our public website here); (2) At the start of May 2019, we become net short as explained in our blog here , based mainly on our contrarian approach as explained in details here ; (3) To the contrary, we become bullish in June as the consensual bullish market sentiment that we saw until the end of April switched to a very bearish one. We have stayed constructive on global equities since then as we explain in our last public view https://marketing.stouffcapital.com/views-july-2019/.
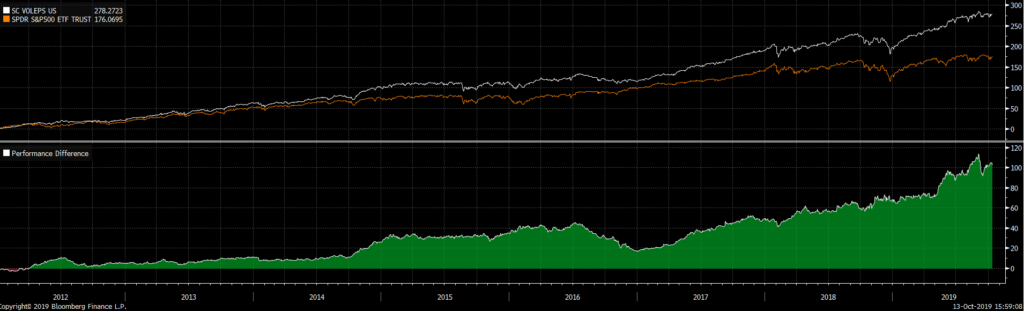
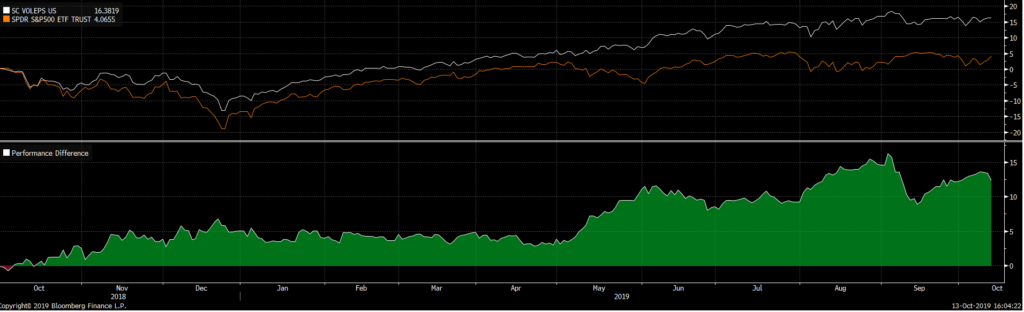
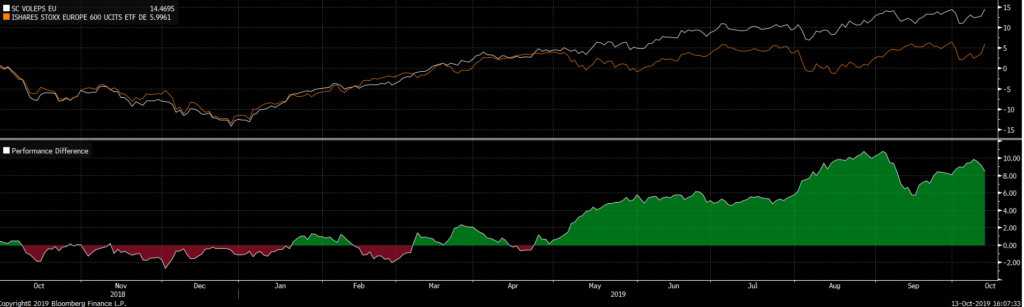
Besides our market calls which calibrates the ratio of bullish versus bearish trades in our portfolio, the alpha is generated by the bottom up stock selection. Our process relies on a mix of quantitative and quantamental portfolios. For instance, our quantitative Low Vol / High EPS strategy is built around an in-house systematic process that combines our Earnings momentum grade with a low volatility filter. Needless to say that this strategy is our best-seller as it has outperformed as well the US benchmark by 100% since 2011 and by more than 10% since September 2018, than the European one by more than 8.5% since September 2018 (all 3 charts are shown below).

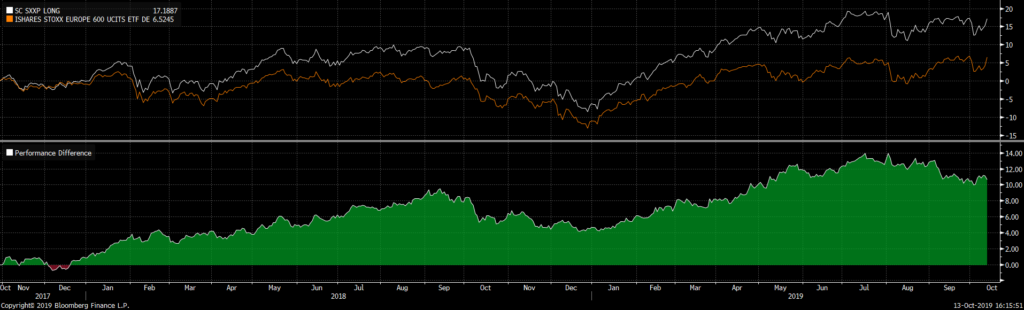
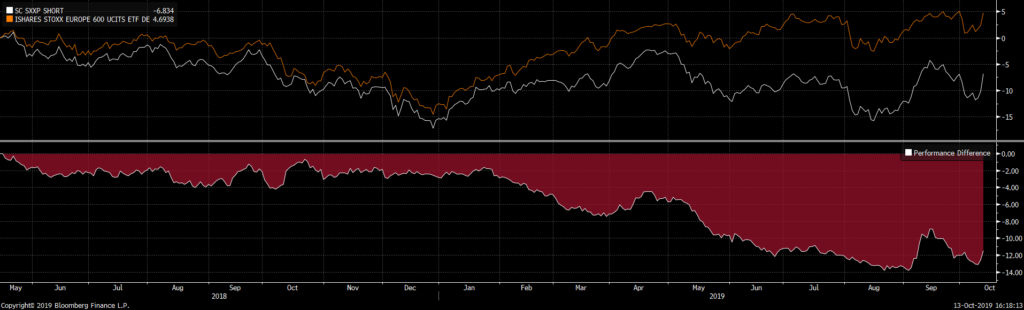
Our Quantamental portfolios have also generated significative alphas. The Long & Short European Quantamental portfolios have produced very strong alphas (Shorts have underperformed by 12% since May 2018 while Longs have outperformed their benchmark by 11%:
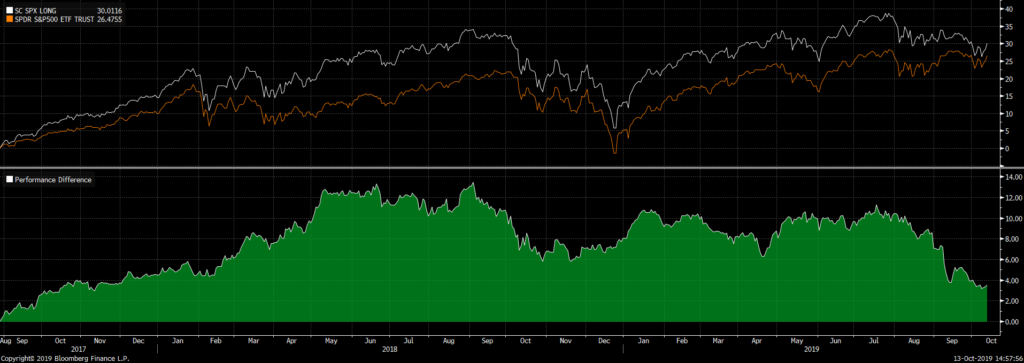
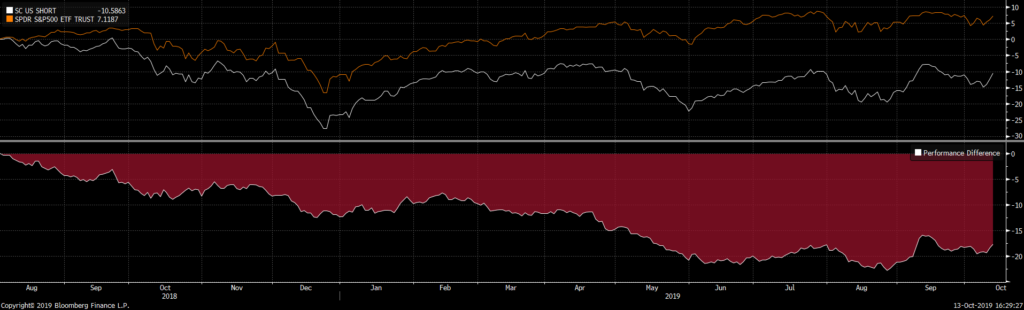
The Short US Quantamental portfolio has produced the highest alpha as quantamental Shorts have underperformed by 18% since August 2018. Only the US Long Quantamental portfolio has recently reduced its alpa from 11 to 4% owing to the rotation from momentum to value.
This is why we have recently added new allocation to Quantamental portfolios that tactically outperform in these periods of rotation towards value: the U2 and the IPO portfolios. For the U2, we consider a large selection of European funds, and look at those sectors and stocks in which those funds are underweight compared to the respective benchmarks. This forms a list of stocks/sectors to which we apply our second criteria; we consider the stocks scoring the highest ‘grades’ in the ‘value’ component of our quantitative stock screening process. Our value grade is made up of a proprietary formula; it is a ranking that takes into account various current and forward earnings, sales and market data designed to provide us with an unbiased holistic value indicator. A high value grade in our quant process (above 60) indicates a stock is ‘cheap’.
Last but not least, we articulate single stock trades when we identify high risk rewards technical signals on our lists of best and worst quantamental names. Here are a few examples to better understand how systematic is our process.
On June 20th, we purchased AMS as a technical signal was supported by a mix of strong quantitative grades. Indeed, our predictive Earnings momentum grade (dotted blue line) rose above 60. Our target was reached in the coming weeks and was the top going forward.
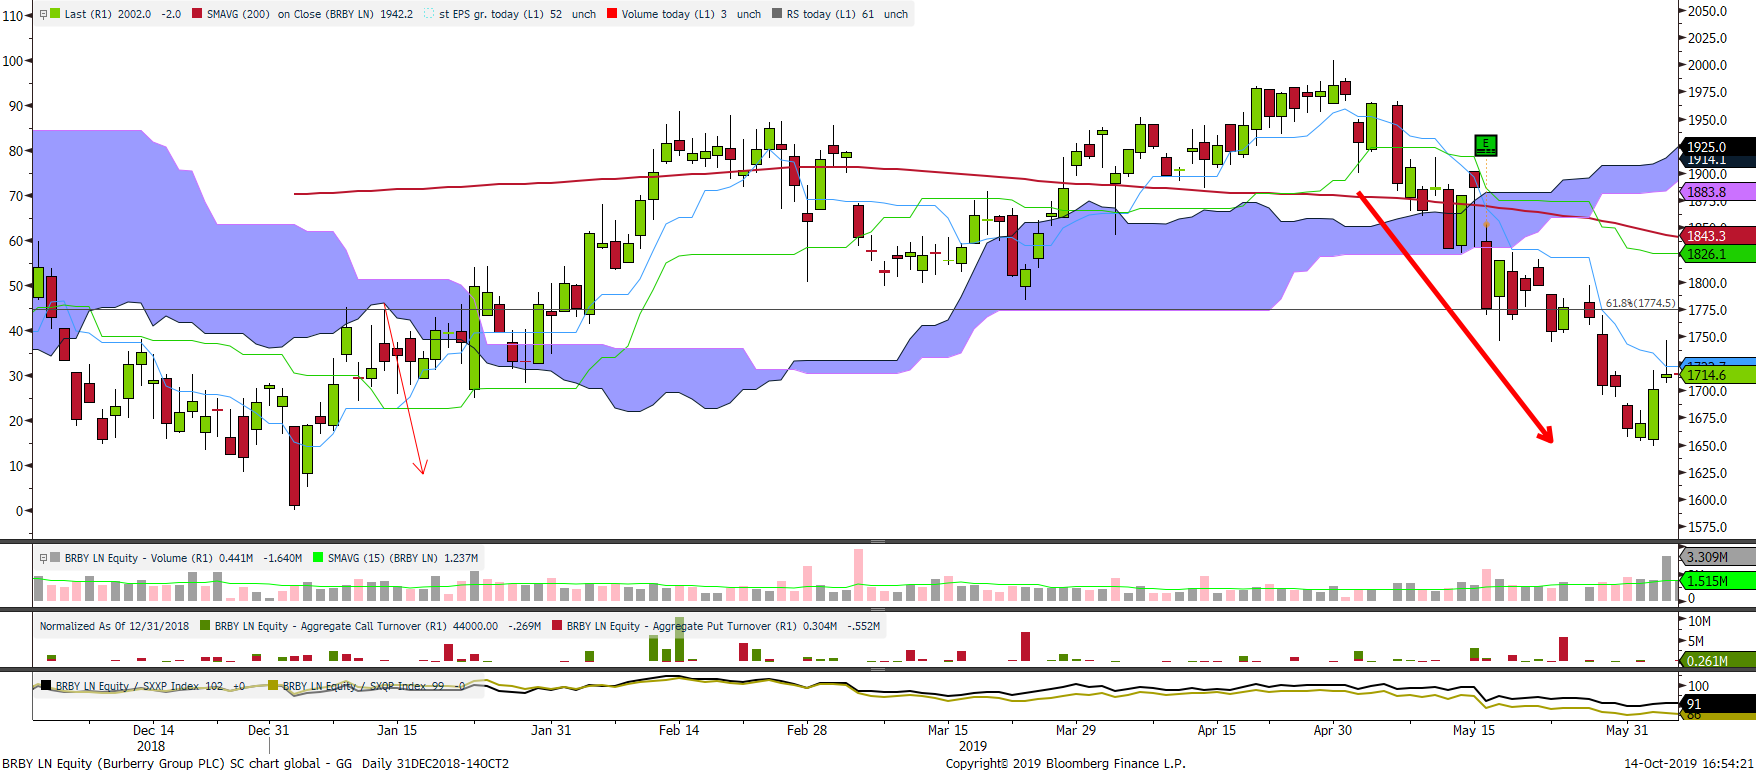
An example of short is on Burberry. We shorted the UK luxury company and closed as its share price reached our target and its mix of quantitative grades rebounded to a neutral state.
Outlook
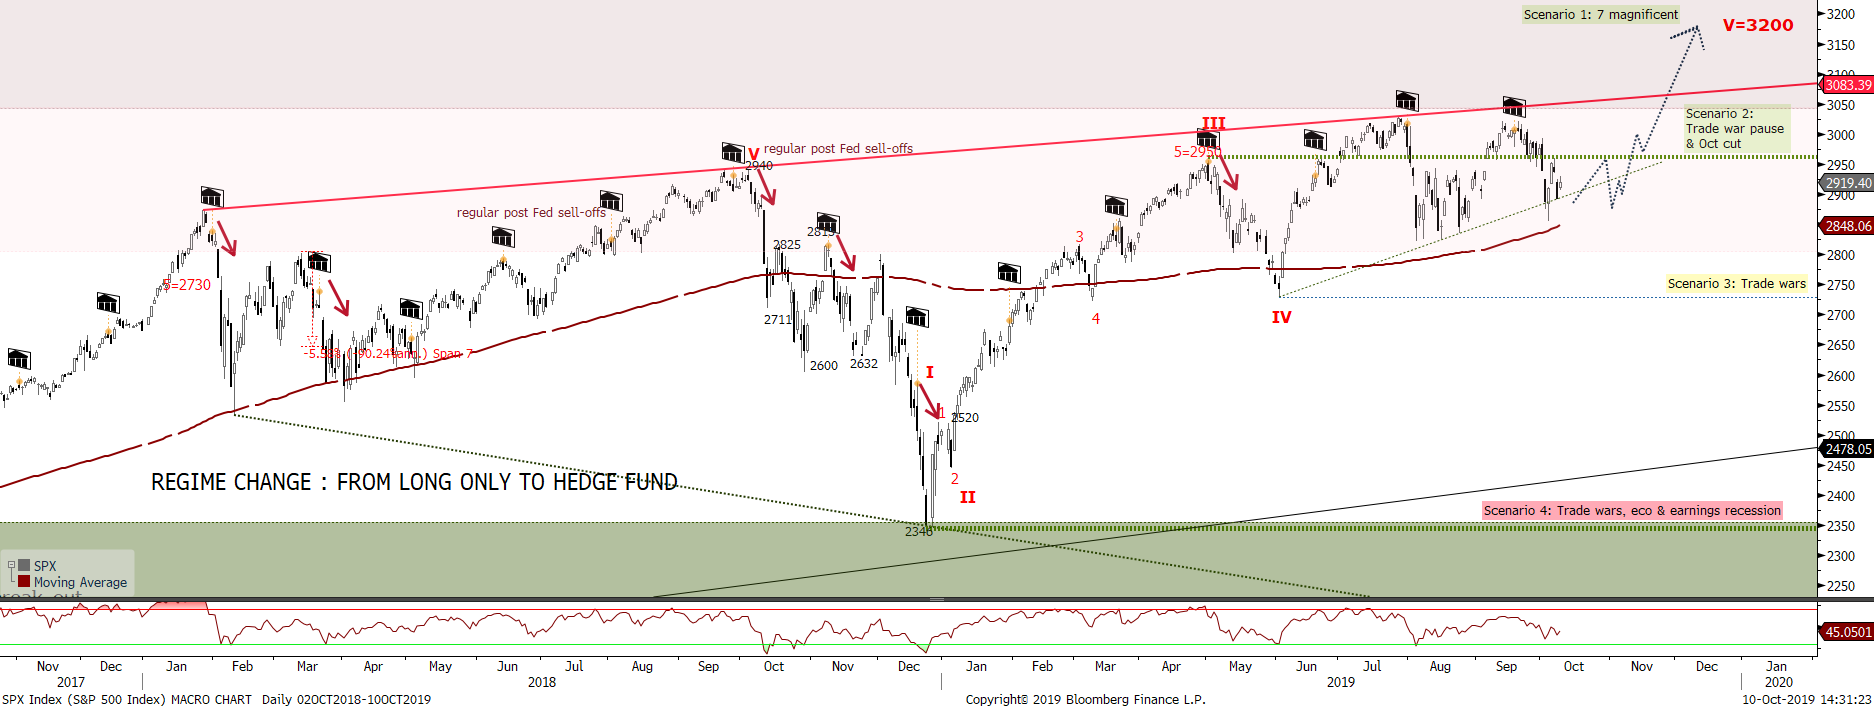
We expect a continuation of the rebound in equities driven by the Central Bank’s new dovishness (Boj and ECB with negative rates, a more dovish Fed). We expect the S&P500 to rhyme with 1998 and breaks out towards 3200 after having consolidated since June.
Following September payrolls’ mixed report, US data has been rather soft (bad PMIs, lower GDP, low CPI). These mixed economic data are nonetheless offset by rising Citigroup Economic surprise and better than expected consumer confidence surveys. As this mixed situation is not preventing the Fed from cutting rates, it is creating a scenario “à la” 1998, when 3 rate cuts propelled equities in a climax buying 2 years later.
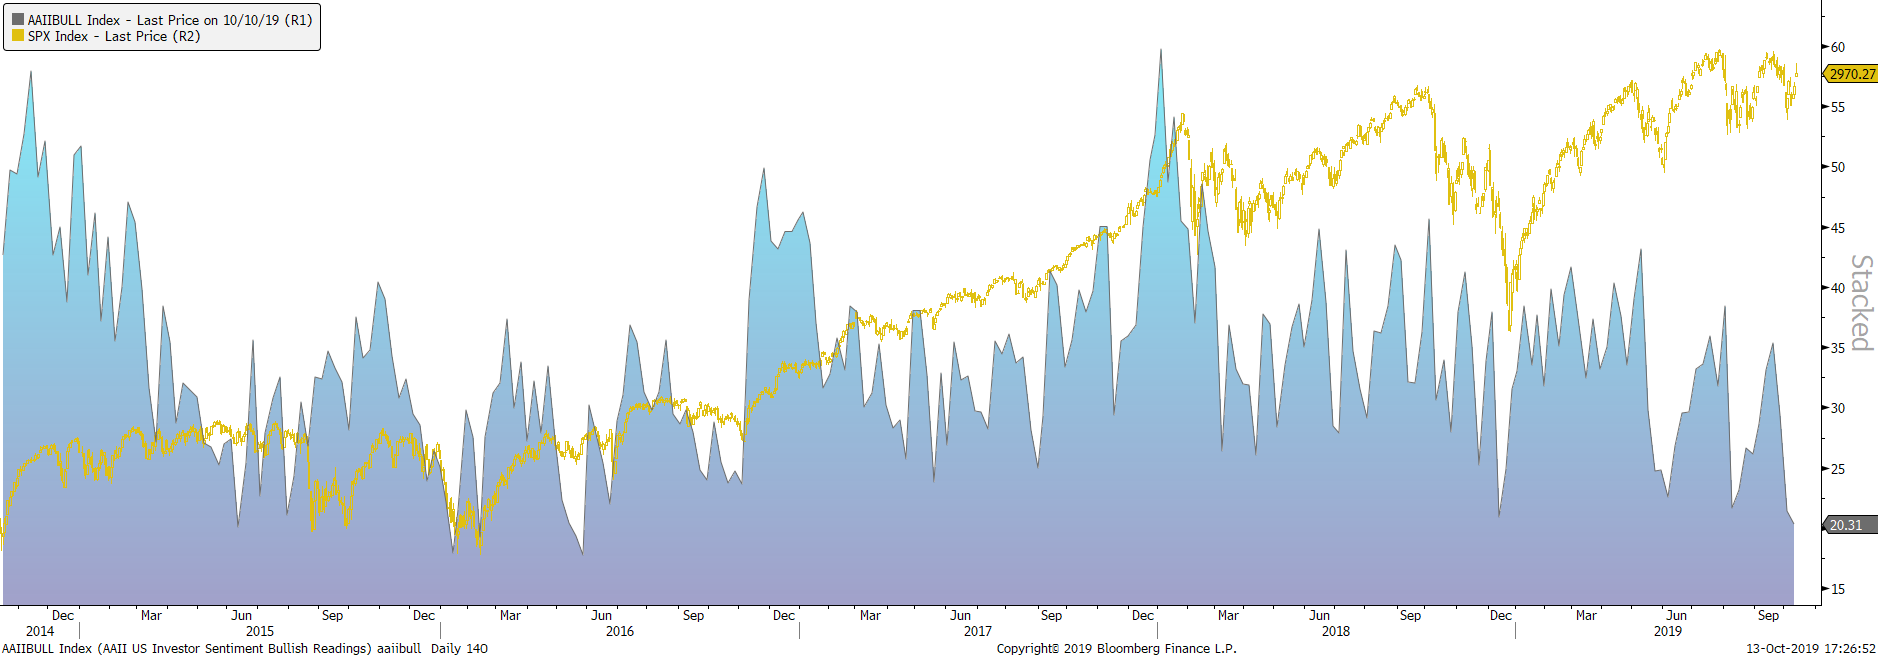
What we have been saying in our recent presentation is that we expect a continuous rise of equities facing a wall of worry or what we define as the most hated bull market of all time. The chart below shows that investors are the least bullish since 2008. Indeed, the blue line is the bullish % of AAII investors and it is at its lowest level in a decade:
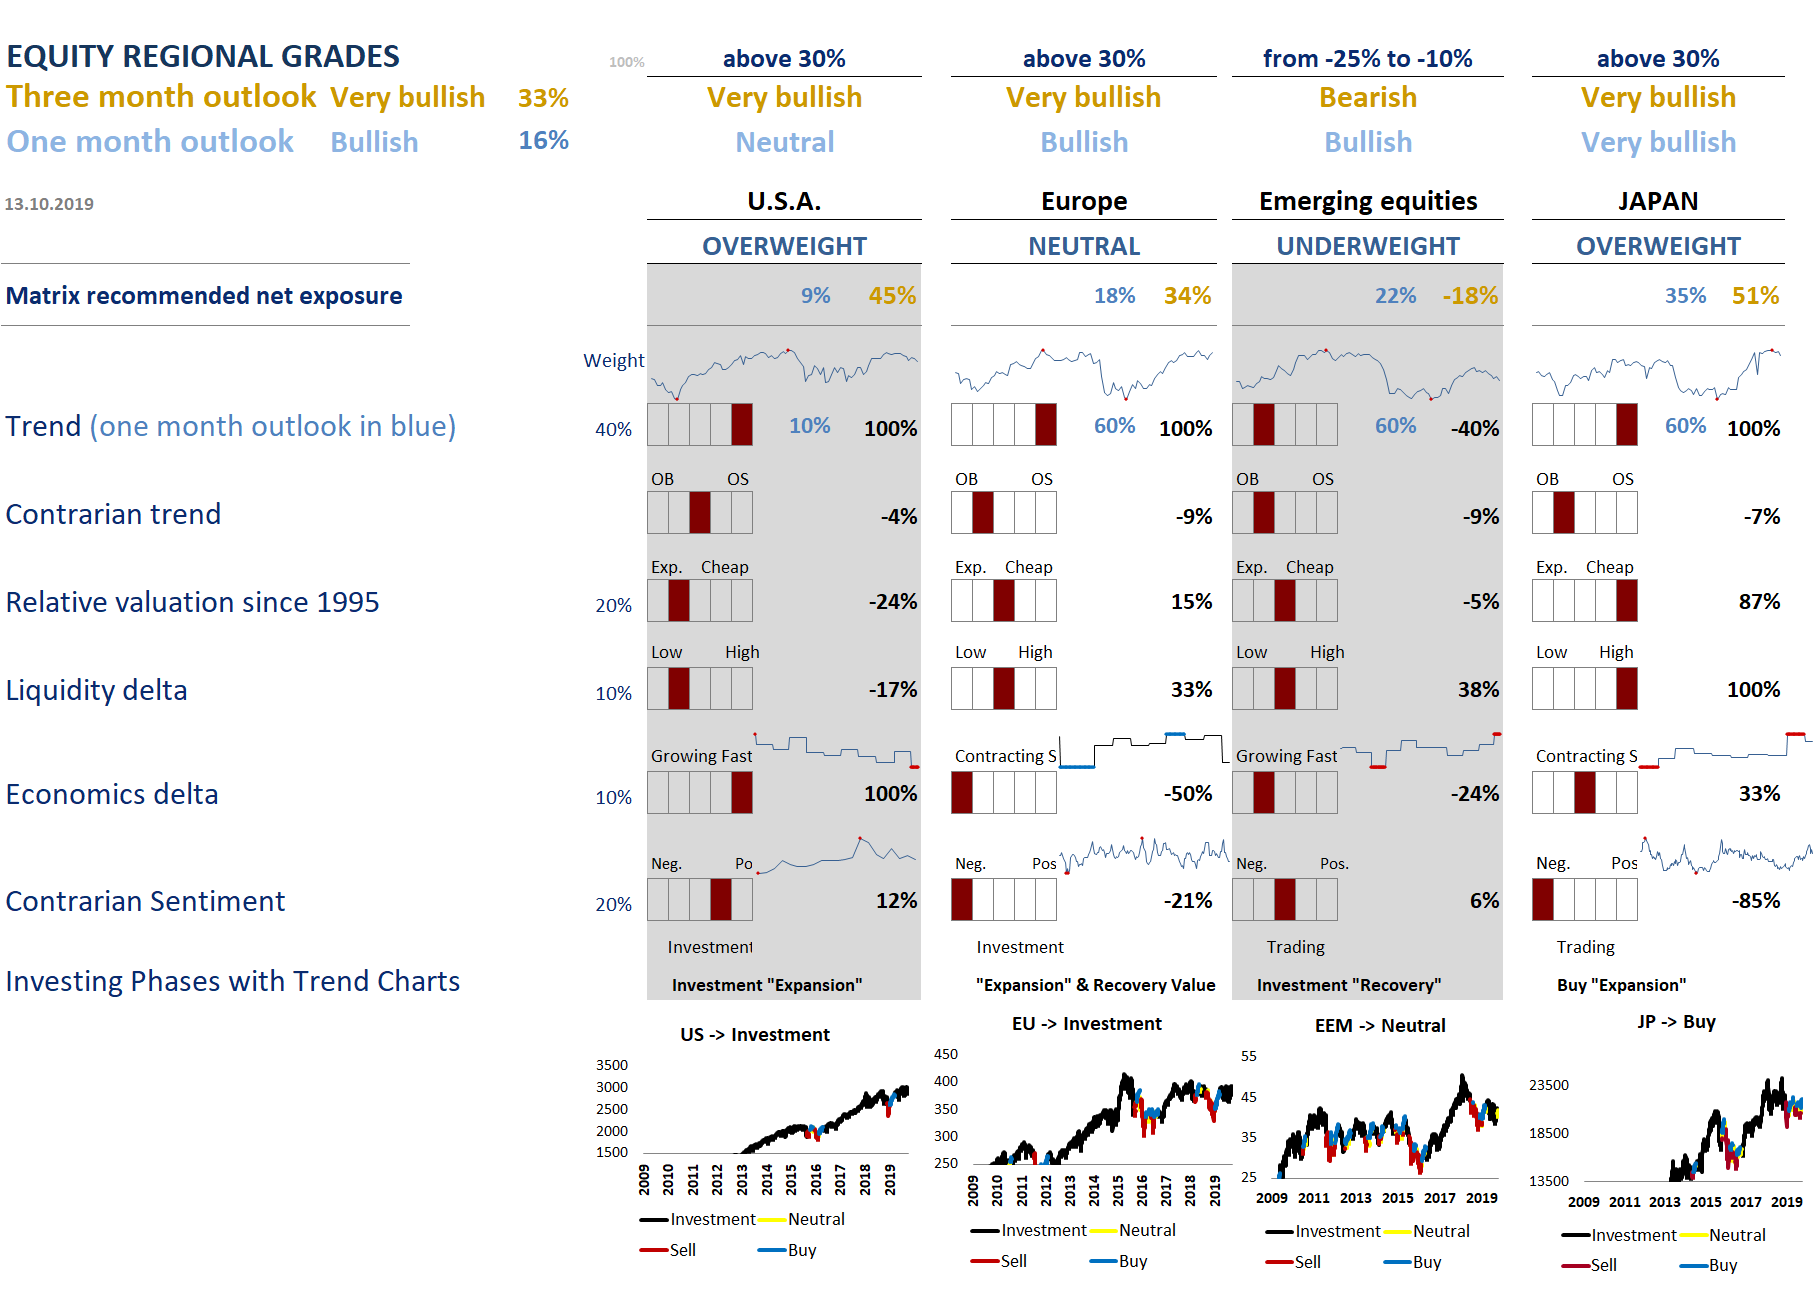
Our Regional Matrix has become even more bullish on one and three months outlooks. Last week, the market was oversold, and the trend was not broken. The equities are probably in the last innings of a structural bull market and should experience a real climax buying before rolling over. We expect the Fed to keep decreasing rates before markets realize that macroeconomic data rebounds. Indeed, an improvement in the data and a stabilization of financial markets would open the door for a real breakout.