Welcome to our regularly updated market letter. In each edition, we provide a comprehensive analysis based on our regional matrix, core convictions, and technical charts. We begin by « Parodos », the introduction, where we outline our investment themes, positioning and strategic views, then continue by delving into the current market focus, offering in-depth analysis of key trends and developments. Next, we present the quantitative factors of our allocation tool The Matrix currently influencing market dynamics, alongside weekly updates from our quantamental portfolios. Given the extensive content of this letter, feel free to navigate directly to the sections that interest you most. We’ve also expanded our collaborative efforts, welcoming contributions from esteemed writers such as AdamS, Yuri, Tey au jasmin or Ozymondias, to enhance the breadth and depth of our analysis.
Stouff Capital SA, 2026
Real time letter September: Fed hiking, “AI Slowing” new fractal, seasonal weakness, extension of Middle east war
Quick links
- Positioning and recent changes
- Our matrix
- S&P500 Charts and trading plan
- Factors
Parodos
From our Algo writer Ozymondias: ” Parodos — The Great Broadening . The world enters the next twelve months not without storms, but with its economic foundations remarkably intact. Global growth endures, carried by a powerful capex cycle stretching from America to Asia, while the great central banks begin to walk divergent paths: a Fed increasingly inclined to stand still, an ECB and BoJ confronting the possibility that normalization must go further. Yet the old threats have not vanished. Energy, rates volatility, and the extraordinary financing demands of the AI buildout now challenge the comfortable assumption that bonds will always shelter portfolios when equities stumble. The cycle survives; the price of capital remains its principal adversary. For equities, however, we remain disciples of the expansion rather than prophets of its demise. We stay overweight global equities, favoring the US, where operating leverage, pro-cyclical policy and AI-driven productivity form a formidable trinity. But the next act should be broader than the first: beyond the hyperscalers toward cyclicals and AI beneficiaries; toward Japan and increasingly Korea; and in Europe toward Banks, Utilities and the emerging AI complex. The age of indiscriminate AI enthusiasm is yielding to something more demanding—an age of diffusion, selectivity and stock-picking. The empire of growth remains standing, but its riches are beginning to spread beyond the palace walls.“
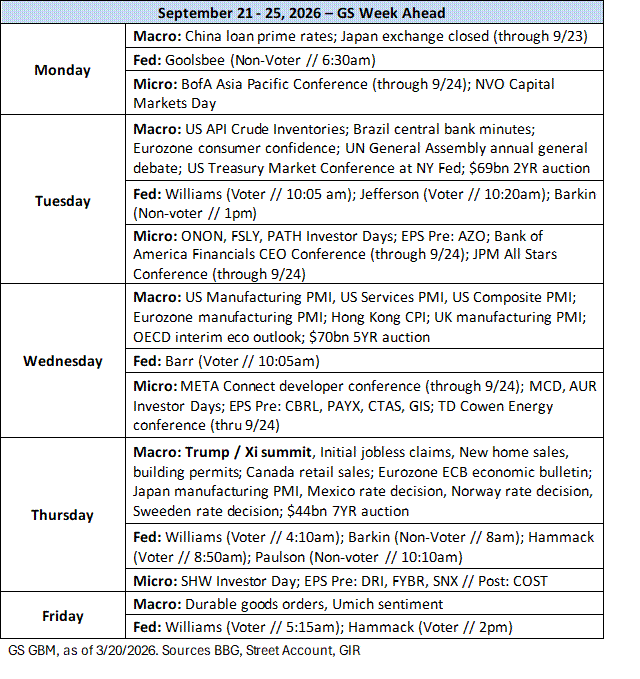
Coming events susceptible to move the market this week can be found here.
Trades recap and Quantamental portfolios
Our regional SC portfolios can be found here. On the top right corner, under Portfolio name, select any of our portfolios (SC SPX long for the US quantamental portfolio, SC SXXP long for the European portfolio, etc…). Then, all the components of the selected portfolio are sorted by sector, with their respective quantitative grades and recent performance measures. These portfolios are updated at least on a weekly basis after the calculation of the quantitative grades of our universe of the most liquid global stocks. First, our algos identify the best companies based on their respective 6 factors, which are weighted with respect to the current market cycle. Then, this purely quantitative crop of the cream is generally halved based on fundamental/ thematic/ risk-reward/ esg or other discretionary purposes.
We have adapted our Long/Short quantitative model to a Long Only focusing on US and Europe. To get access to our last webinar please click here
As of September 08th, our portfolio’s net exposure is +26.34%. US is Neutral at +13.8%. We stay overweight in Emerging markets at +7% for two reasons. First, the AI cycle itself supports Emerging Markets. Roughly 40% of the MSCI EM index is now linked to AI-related industries, particularly semiconductors and hardware. Korea and Taiwan remain central beneficiaries of the memory and compute cycle. Second, the current hawkish repricing in rates and bond yields could reverse in the second half of the year. Unlike 2022, real rates, wage growth and corporate pricing power remain far less problematic. As bond yields stabilize and the U.S. dollar weakens — once geopolitical fears subside — Emerging Markets should benefit significantly (except China that is a short in our Regional Matrix). The recent AI and momentum unwind is probably over. While semiconductors (AI Semis, Memory), hyperscalers and other AI beneficiaries (Optical Networking, Liquid cooling, AI Data centers,Neocloud providers) have experienced meaningful corrections, positioning has largely reset and valuations have become more compelling. We observe through our last Crash AI fractal (July 2026) that optical networking, data centers and neocloud providers are outperforming, especially relative to memory and AI power. We also continue to expect market leadership to broaden during the second half of the year, supported by easing inflation, a less restrictive monetary backdrop and resilient corporate earnings. We believe the current rotation should ultimately create attractive opportunities to selectively rebuild exposure to high-quality AI beneficiaries, particularly within semiconductors, while maintaining our preference for companies with strong pricing power and durable earnings visibility. We get tactically more constructive on Gold miners , after +2 sigma advances among some of the less trafficked metals like Platinum. It looks increasingly likely a short-term low was in place with some runway to the $4500-$4700 neighborhood in the weeks ahead (roughly where the 200-day and some retracement levels converge). The longer-term call will sort itself out in time (it’s still negative in our trend model), but we have no hesitation stepping to the side and letting Gold (and the related equities) rally in the interim.
Main market focus for the near future are enumerated below:
Market focus (fractals) – What’s shaping the markets Today ?
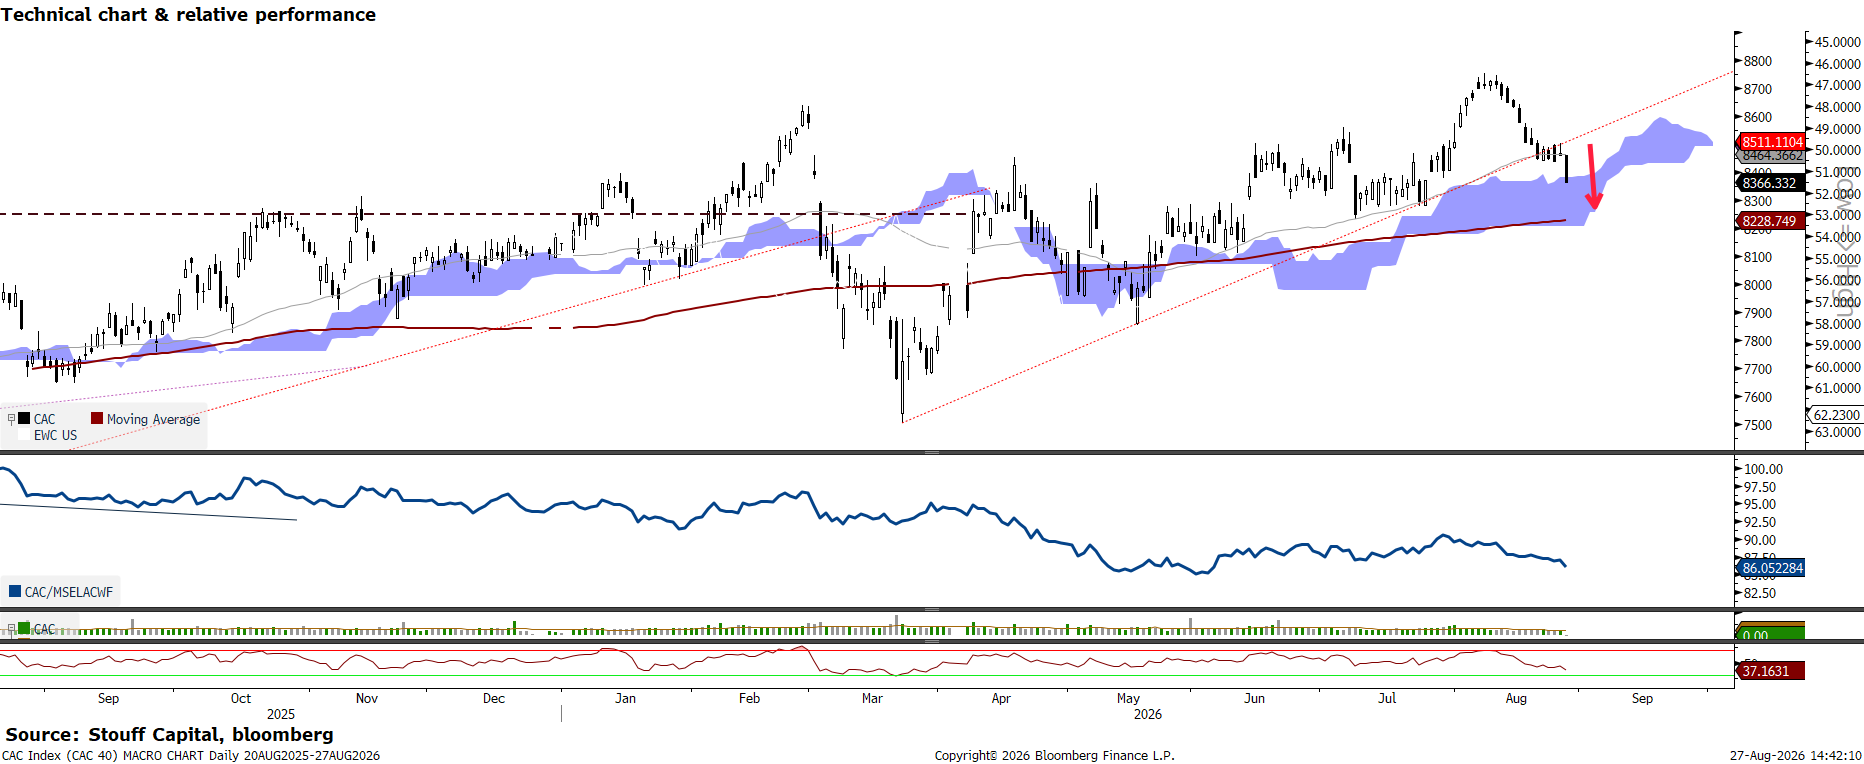
Fractal “France elections” – August 27th – French domestic equities look increasingly vulnerable to a spike in political risk premia ahead of the 2027 presidential elections. While macro tailwinds previously supported domestic stocks, France’s growth outlook remains sluggish, OATs are under pressure, and energy prices are on the rise. French domestics were hit as fiscal and political concerns resurfaced ahead of the first presidential debate which happened on August 27 at 16h30 Rolland-garos time. Feels early to build large directional shorts around an event that is several months away. That said, think France will be capped to the upside. . Weakness among bank stocks weigh heaviest on the French index, with BNP Paribas down as much as 4.5% and Societe Generale as much as 4.9%; Eiffage & Vinci drop *** The gradual heating up of the pre-election campaign comes as a widening of French sovereign spreads over summer has left France with the highest 10yr yield among the large and medium-sized euro area economies
read more on france fractal below by clicking on the arrow:
Polls currently show far-right candidate Marine Le Pen leading, but the risk of a hung parliament (and further fiscal slippage) following a parliamentary election remains elevated regardless of the ultimate winner of the presidential election. We recommend hedging a pick-up in election headline noise with our French Domestic basket, which screens as the most sensitive slice of the market to political risk given its 50% domestic sales exposure (vs. 15% for the CAC 40). Next catalysts include the 2027 Draft Budget Release on Sep 30th, followed by the Socialist Party Primary on Oct 10th and 17th. The correlation of French Domestic vs International stocks to credit spreads tends to pick up during political shocks
GSXEFRDO has underperformed EU peers (SX5E) with Far-Left leader Jean-Luc Melenchon rising in the polls
The 2027 French elections represent a critical pivot, but our economists argue the primary risk is political gridlock and fiscal slippage. Incoming fiscal news has been disappointing: Prime Minister Lecornu recently acknowledged that this year’s deficit target is out of reach, leading GS to raise its deficit forecasts to 5.3% for both 2026 and 2027 (implying zero deficit reduction). With public debt already exceeding 110% of GDP, political gridlock will only exacerbate fiscal pressure. GS’ statistical model continues to show far-right leader Marine Le Pen best placed to win the presidency at 68% probability, though far-left leader Jean-Luc Mélenchon’s odds remain significantly lower than implied by prediction markets (now 14% for Polymarket). But more crucially, the model points to a high likelihood of a hung parliament in legislative elections regardless of the presidential winner, a scenario that would temporarily worsen the structural fiscal balance by 0.2% of GDP and push 10Y yields up by 10bps.
GS Research’s Elections Model Suggests Le Pen Is Currently Best Placed to Win the Presidency
European Daily: France—No Deficit Reduction This Year and Next
The Debt-to-GDP Ratio Is Set to Continue Increasing with GS Research simulations showing a 15% probability that it surpasses 130% by the end of the decade
French credit spreads have been under pressure in August (+8bps for the 10y OAT-Bund) due to a combination of energy, fiscal, and political factors. But we believe the political risk premium could build up further into Q1 2027 as polling accuracy historically improves, similar to what happened in 2017. Historically, election-driven political uncertainty has widened OAT-Bund spreads by up to 30bp, which would push spreads to ~100bp (vs. GS 70bp year-end target and 85bps today). We expect market sensitivity to fiscal uncertainty to remain high given upcoming budget negotiations and uncertainty around campaign economic proposals, and our rate strategists see upside risks to their end of year forecasts.
France has been penalised the most in the current environment
Global Rates Trader: Back to Front-End
2017 is the most relevant precedent, with the bulk of the widening still happening in Q1
10y OAT-Bund under/outperformance against PC1-implied. Indexed at 0, 60d before the 1st round of the presidential election
Global Markets Daily: Early Thoughts about OATs into France’s 2027 Elections
Source: Goldman Sachs FICC & Equities, GIR, as of Aug 2026
While credit markets show caution, equity markets have been cushioned by broader European inflows. In particular, domestic equities have benefitted from extensive fiscal support, insulation from protectionist policies, and favourable FX dynamics. But our economists have now painted a worrying forward picture, with higher energy prices, the recent heatwaves and wildfires, a weakening labour market, and election uncertainty likely to keep GDP growth subdued. Still, our French domestic basket is up 42% since Jan 2025 significantly outperforming international peers (GSXEFRIN +1%), and the regional benchmark (CAC +12%). The latter has proven to be an inefficient hedge for domestic political risk because top weights (LVMH, Schneider Electric, Airbus, etc.) derive most of their revenue globally. Historically, GSXEFRDO is ~1.6x as reactive as the CAC 40 and ~1.9x as reactive as the SX5E on days driven by French political shocks, offering the cleanest equity expression of domestic risk.
French Domestic have outperformed their International peers and the regional benchmark over the past year
Source: Goldman Sachs FICC & Equities, BBG, as of Sep 2026
GSXEFRDO has proven much more reactive than regional benchmarks to recent French political shocks
| Date | Event | GSXEFRDO (%) | CAC (%) | SX5E (%) | OAT-Bund Chg (bps) | OAT-Bund Prior Close (bps) |
| 24 April 2017 | 2017 1st round (relief rally) | 6.46 | 4.14 | 3.99 | -18.5 | 68.7 |
| 10 June 2024 | Snap election announcement | -3.05 | -1.35 | -0.69 | 7.8 | 47.8 |
| 14 June 2024 | Snap election — worst week close | -3.17 | -2.66 | -1.95 | 7.1 | 69.6 |
| 01 July 2024 | 1st round 2024 results | 2.15 | 1.09 | 0.73 | -5.7 | 79.8 |
| 05 December 2024 | Day after Barnier fell | 1.89 | 0.37 | 0.66 | -5.6 | 83.8 |
| 08 July 2026 | Le Pen cleared to run 2027 | -2.49 | -2.18 | -1.82 | 3.7 | 79.8 |
| 27 August 2026 | 2027 presidential debate (Medef) | -3.1 | -1.68 | -0.71 | -0.3 | 85.5 |
| Average | Move per 10bps OAT-Bund widening | -3.89 | -2.45 | -2.09 | ||
| Sensitivity | Compared to GSXEFRDO | 1.0x | 1.6x | 1.9x |
Source: Goldman Sachs FICC & Equities, BBG, as of Sep 2026
Despite the recent sell-off, GSXEFRDO trades near the upper end of its 5-year valuation range and 40% above its 2024 trough, implying limited political risk is currently priced in. Historically, GSXEFRDO’s correlation to credit spreads has spiked during periods of political uncertainty with basket selling off by ~ 4% for every 10bps of OAT widening (vs. 2.5% for CAC). Because timing headlines early in the race is difficult, we recommend using late Q4 2026 or Q1 2027 options to capture the acceleration in the fiscal and election calendars, and we favour pair trades for delta-1 implementation. We recommend using GSXEFRDO as a funding leg against three long themes: 1/ EU Renewables (GSXERNEW) to capture structural electrification and energy mandates; 2/ German Fiscal (GSXEGFSC) to play cross-border policy divergence following the rollout of Germany’s fiscal plan; 3/ French International (GSXEFRIN) to isolate pure domestic political risk while maintaining country-neutral exposure.
GSXEFRDO valuation sits at the upper end of 5y range and looks vulnerable to a spike in political noise
Source: Goldman Sachs FICC & Equities, Marquee, as of Aug 2026
Relative positioning on the long German Fiscal vs Short French Domestic trade is attractive post the summer de-gross
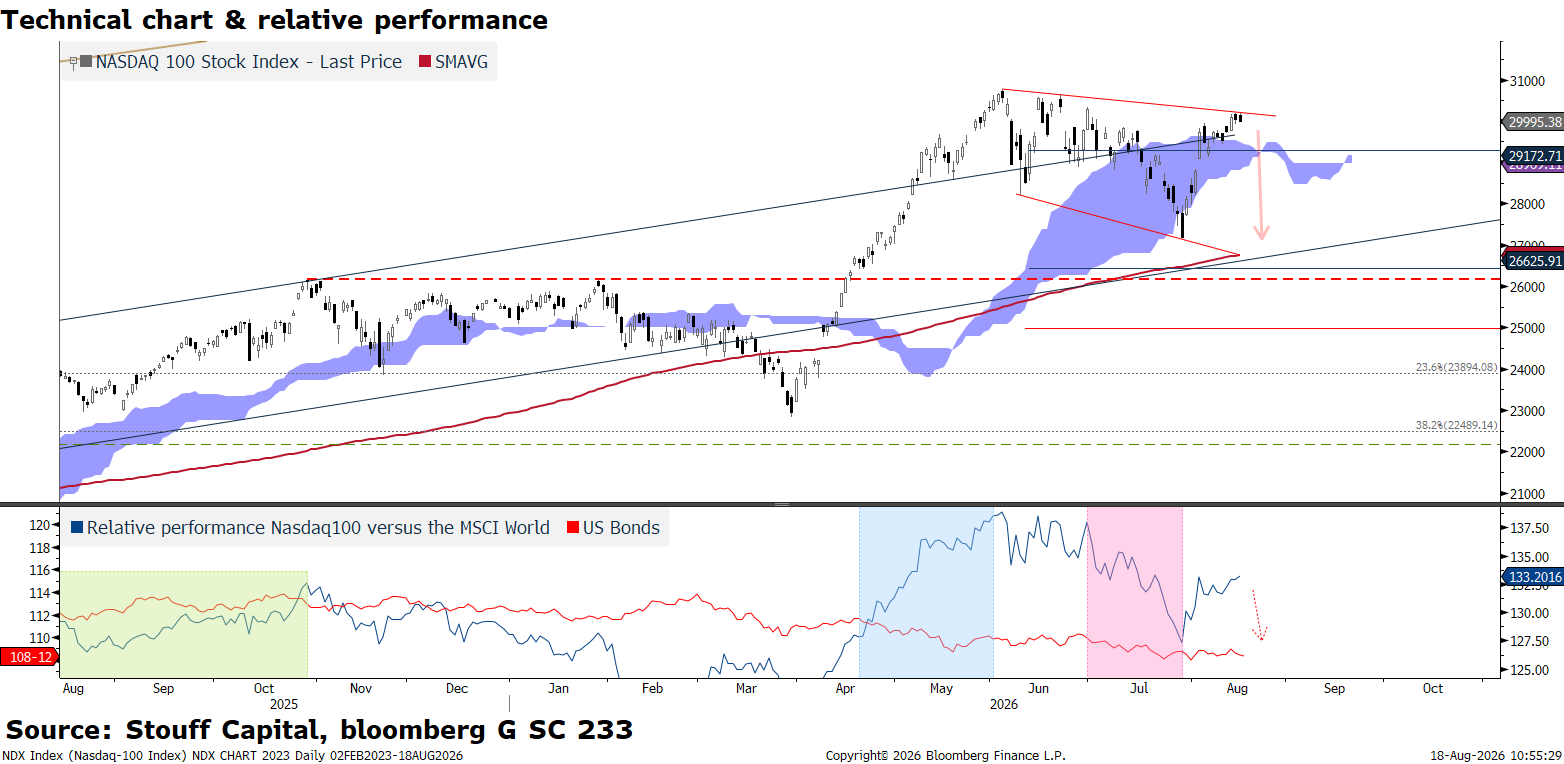
Fractal “AI” – Here we present the various fractals related to AI like the September 13th “AI Slow” fractal (Dario Amodei’s call to “pace the frontier,” backed in varying degrees by Altman, Musk and Hassabis, has hit the Asian AI complex hard. SoftBank was down double digits and the broader complex weaker. if safety and alignment concerns force the frontier to slow, regulation becomes another reason to compress AI multiples and potentially question the durability of capex), or the July 2026 Crash – Following the July bottom, the AI complex’s bounce stalled out, prompting questions as to whether the correction was purely technical or fundamentally driven. Please click on Thomas report here. The chart below of the Nasdaq100 shows a lower high while SPX made an all time high. This shows tech stocks are underperforming the market and we sold it on August 18th:
Slow AI Sept 13th fractal
🤖 The AI Complex: From Technical De-risking to Fundamental Discernment
Important events to analyse fundamentals going on: Aug 17th Anthropic PBC is on track to generate annualized revenue of more than $65 billion based on its current performance, up more than sevenfold from its pace at the end of last year. August 20: model economics keep improving fast. Qwen3.8 is another example increasingly useful intelligence from increasingly small/cheap models. That is very bullish for AI adoption and the broad market, but less obviously bullish for everyone selling tokens/model access. Moats get harder to defend. Same argument for parts of the picks and shovels chain… think whole space keeps de-rating as EPS moves up.
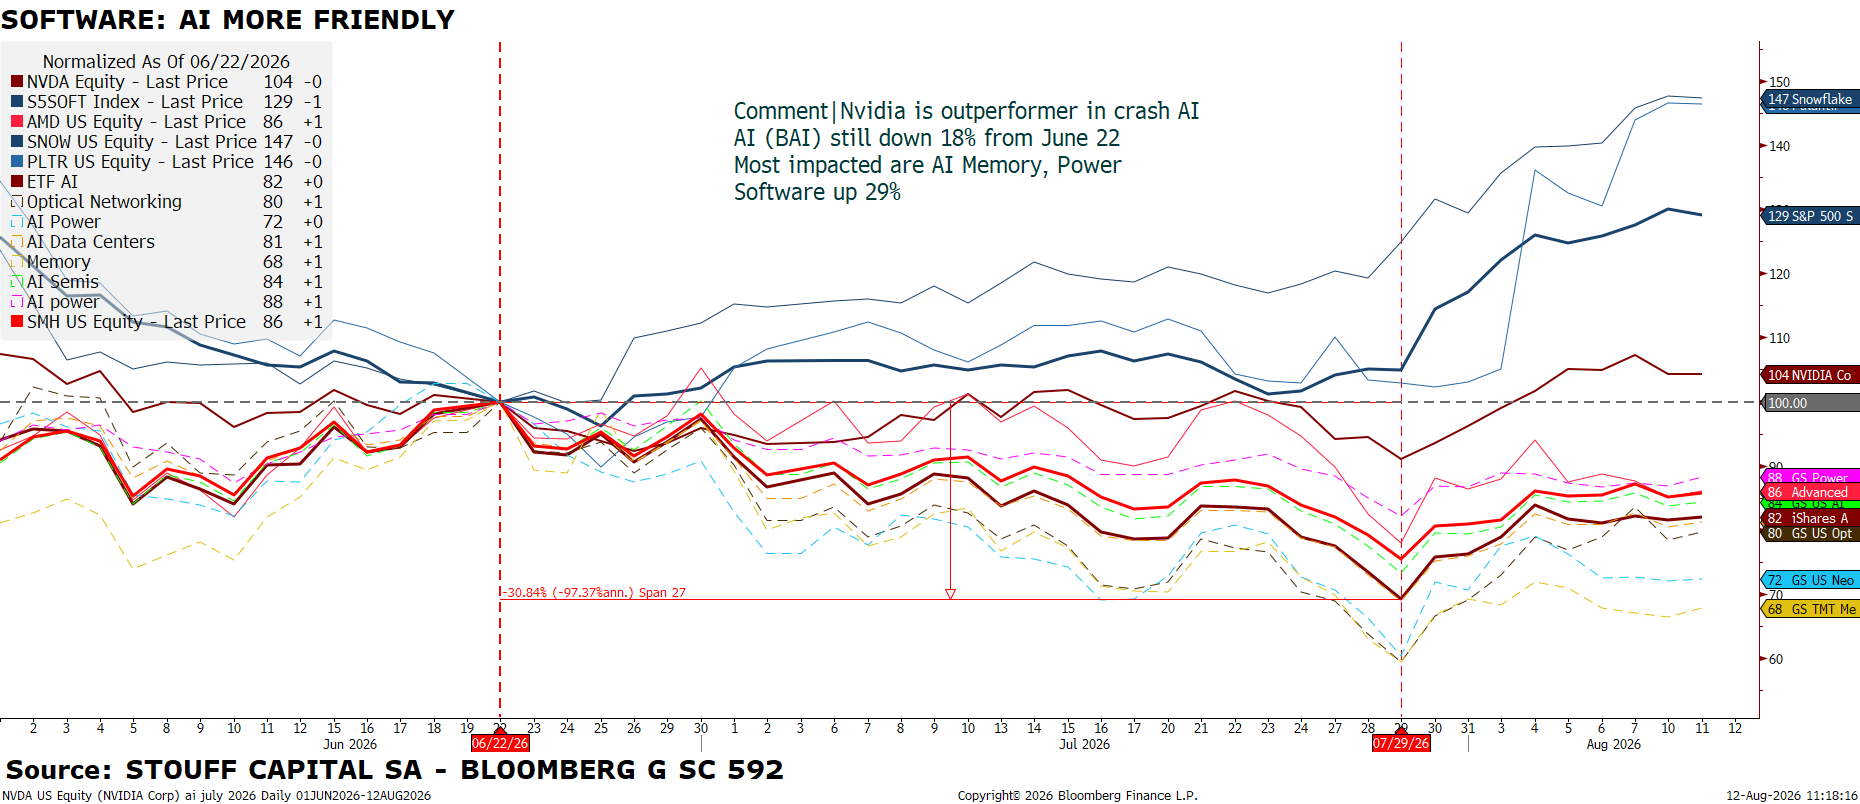
During the July sell-off, all AI themes were sold aggressively at similar rates relative to their volatility. However, the subsequent rebound reflects growing investor selectivity. The 1 st group includes many of the prior momentum names, Semis in particular, that flushed into the Situational Awareness lows of late-July and have now bounced w/ their long-term uptrends intact.
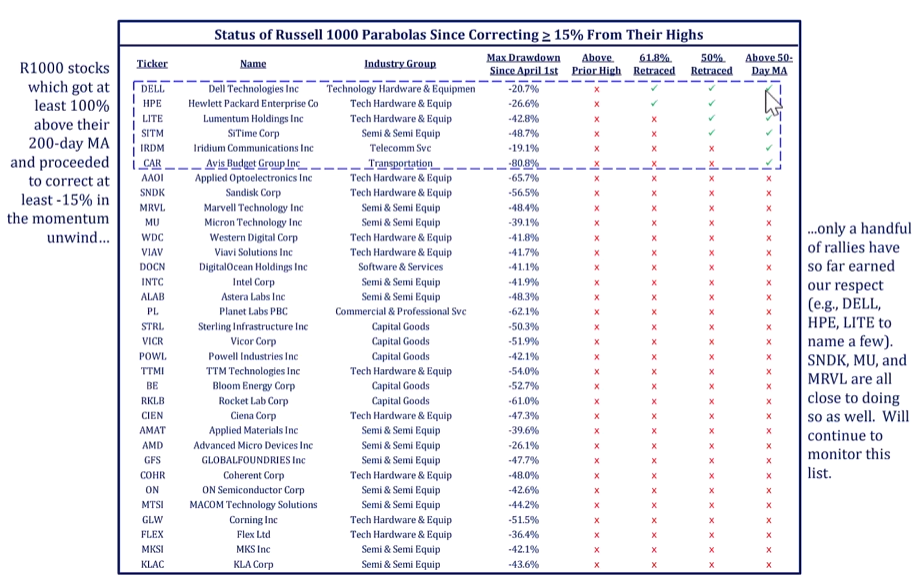
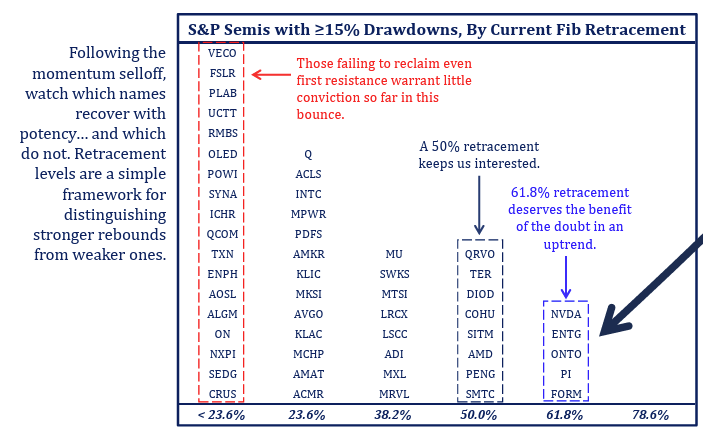
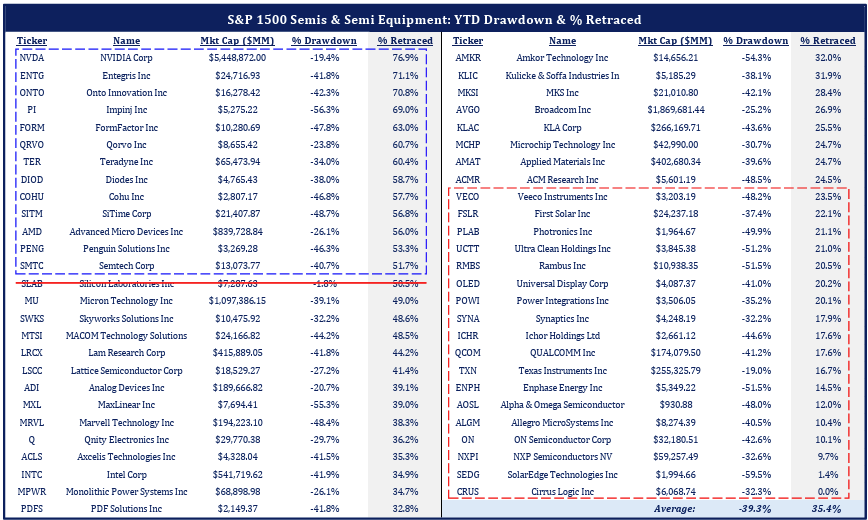
Give deference to the names that have already retraced a majority of their decline (e.g., 61.8%) and have quickly reclaimed the flag of leadership (DELL, ONTO, NVT, LITE, KEYS, ENTG, etc.). Be more alert with those that remain below the 50-day MA or that haven’t rallied with much relative gusto… if we had to guess, they chop around without much direction from here. The 2 nd group is the batch of structurally weaker charts that have rallied over recent weeks as part of the anti-momentum cohort – think ACN, ADBE, BAH, CRM, FICO, IBM, etc… overbought conditions in downtrends are often a good signal to step away, and we’d advise doing so there.
| Theme | Asset Ticker | Drawdown (Peak to Trough) | Bounce (% Up from Trough) | Distance to Peak | Up Move / Vol Ratio |
| Optical Networking | GSXUOPTI | -41% | +32% | 28% | 0.43 (Strongest Rebound) |
| Neocloud Providers | GSXUNEOC | -40% | +20% | 39% | 0.30 |
| AI Data Centers | GSTMTDAT | -31% | +17% | 24% | 0.30 |
| AI Semis | GSCBSMHX | -27% | +14% | 20% | 0.21 |
| Liquid Cooling | GSXUCOOL | -18% | +10% | 11% | 0.27 |
| Memory | GSTMTMEM | -41% | +12% | 51% | 0.17 (Lagging) |
| AI Power | GSENEPOW | -18% | +6% | 15% | 0.17 (Lagging) |
Fundamental Shift: Emerging Themes in Tech
- Software & The “Inference Economy”: Investors are turning to model-agnostic and bottleneck-agnostic software beneficiaries of AI adoption. Key names in security, data infrastructure, and tools include
SNOW,DDOG,PLTR,CRWD,PANW,OKTA, andTWLO. - Memory Dynamics: Memory (DRAM, NAND, HDDs) is shifting from a price-driven upside narrative (earnings revisions) to a debate over long-term stability, long-term agreements (LTAs), capital returns, and multiple expansion.
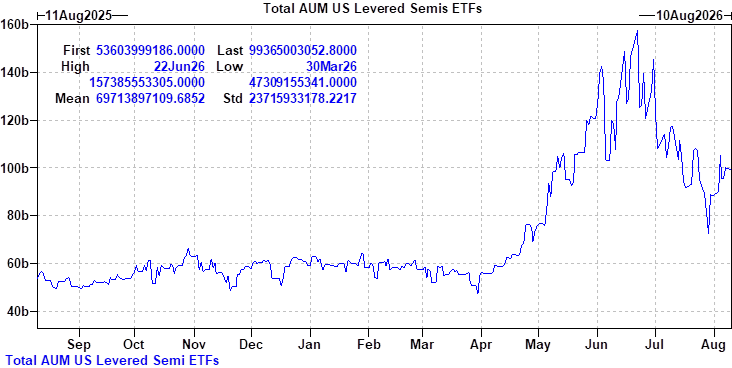
- Levered ETF Technicals: In U.S. Semis levered ETFs, total AUM sits near ~$99B (down from a high of $157B). While retail “bought the dip” in early July (adding ~$15B of excess length), the August rebound has been driven purely by mark-to-market spot gains, accompanied by net share redemptions and selling into the rally.
Our AI fractal Exposure score :
Here we show the 50 companies with the strongest total thematic exposure, taking into account breadth and materiality.
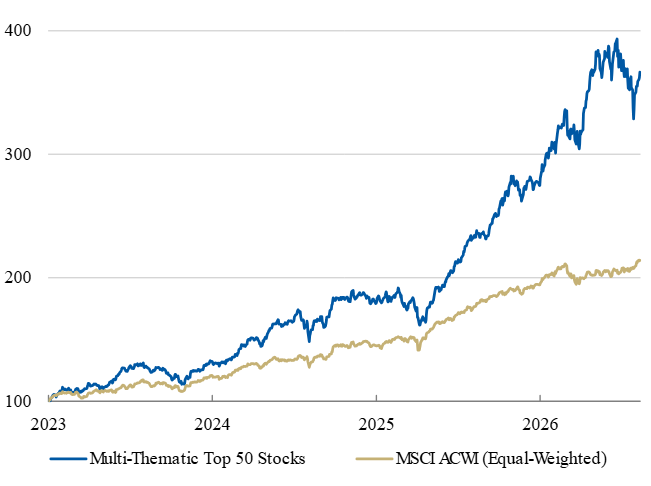
Exhibit 1: Global companies with the greatest Multi-Thematic exposure (OW-rated, MC>US$10bn)

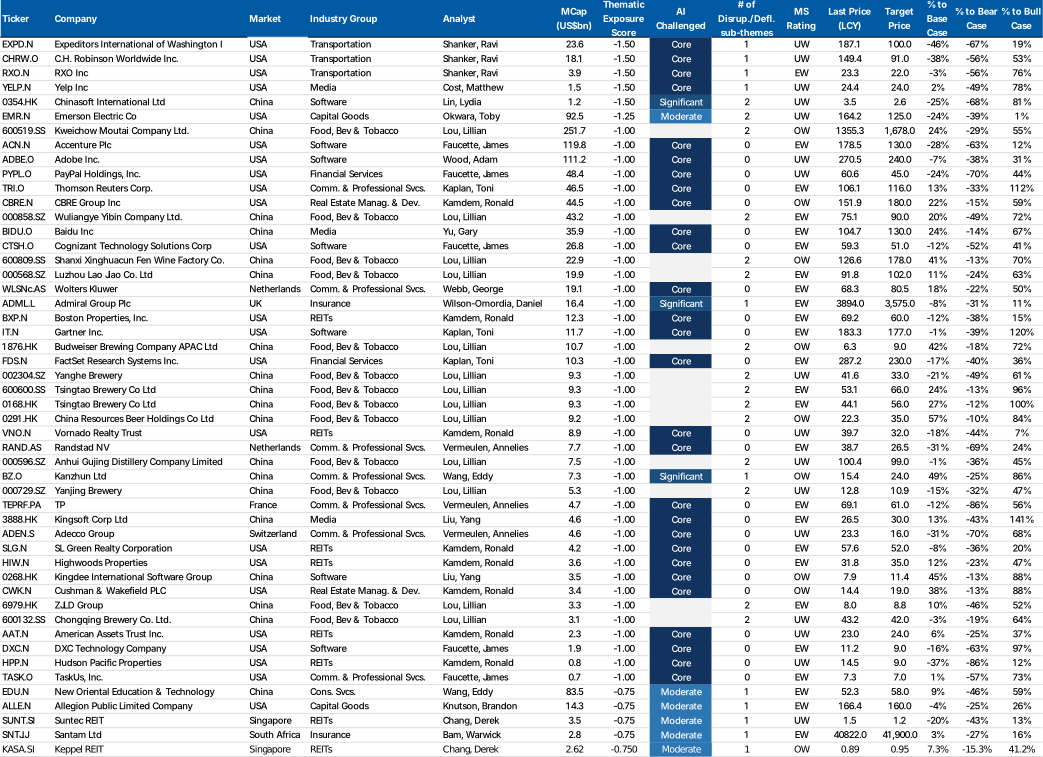
To the contrary, AI Challenged stocks have lagged materially since the start of 2023. Here we screen for companies with a materiality of Core-to-Thesis, Significant or Moderate exposure to the AI Challenged category. On a US$ total-return and equal-weighted basis, the group is up 50% versus 105% for MSCI ACWI (2% versus 24% in the last 12 months), with underperformance accelerating from late 2025. This occurred as more powerful AI models continued to emerge, but importantly as enterprise adoption started to accelerate via AI coding and co-work functionality.here we show the top 50 companies most-challenged by AI and thematic disruption.
Exhibit 2: Thematically Challenged – Top 50 stocks by combined AI Challenged materiality and Disrupted/Deflationary exposures
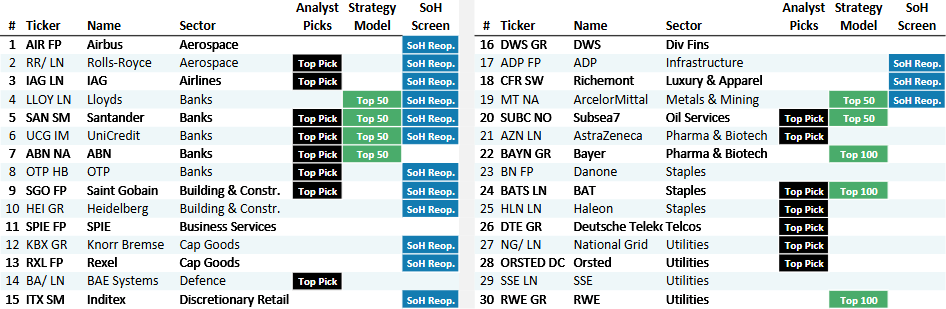
Fractal AI – idiosyncratic drivers outside of AI in Europe
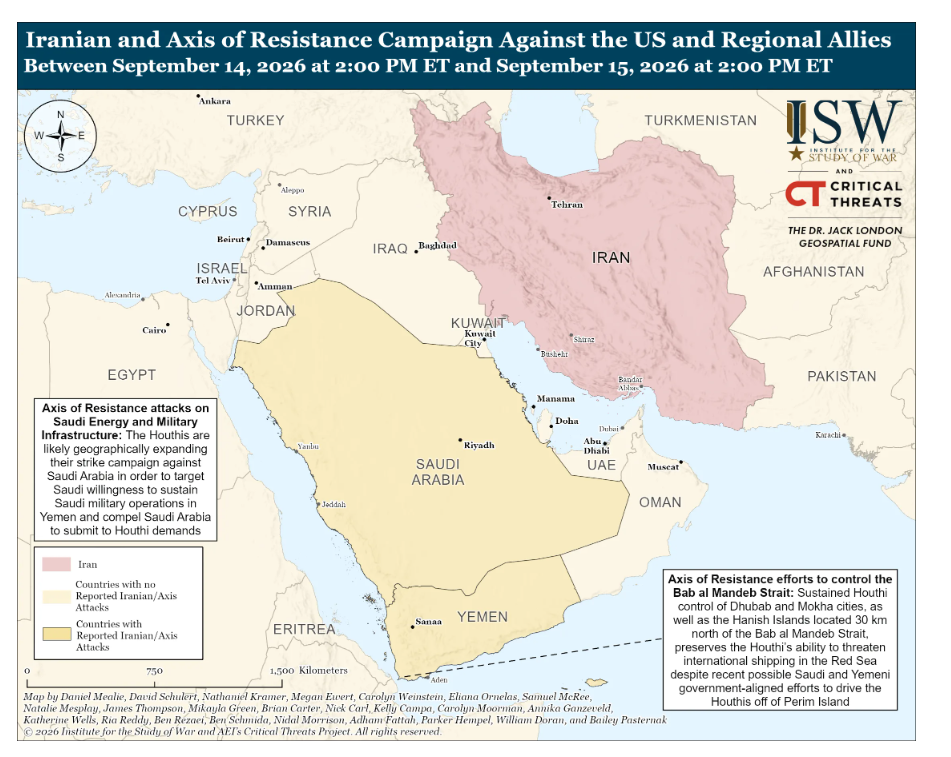
Fractal “Clash of Civilization” – Iran War fractal – Sept 15th: Distillates have gone vertical again and physical markets remain incredibly tight. Saudi’s East-West pipeline disruption forced the suspension of Yanbu loadings and cancellation of some European cargoes, with European physical crude trading north of $130 in places yesterday. Despite all that there are reports of more visible signs of cargoes moving through the strait. “ Iraq’s seaborne crude oil exports from its southern Gulf terminals averaged 3.16 million barrels/day in the first 10 days of September, nearing the prewar levels of 3.335 million b/d recorded in February” . China increasingly feels like an important potential catalyst. Araghchi is in Beijing for talks with Wang Yi today, while Bessent meets He Lifeng this weekend ahead of the planned Trump-Xi summit on September 24. Iran is expected to feature in those discussions. China has meaningful economic leverage with Tehran and a direct channel into Washington: if Beijing wants to use both, that creates a credible bridge toward an off ramp. Feels like the key potential diplomatic pathway to watch.
Sept 8th: US and Iran kinetic activity continued this weekend as both sides traded attacks on ships. US military struck 3 Iranian oil tankers Saturday in response to alleged ballistic missile attacks by IRGC against US warships. Iran retaliated by targeting six additional ships, including three oil tankers in the Strait of Hormuz, and three others they claimed were affiliated with US. Oil rally accelerated Tuesday after Houthi missile and drone strikes targeted Saudi Aramco facilities, causing temporary halt in some operations, wounding over 70 people. Elsewhere, Iran, Oman finalizing agreement to establish temporary safe shipping route through Strait of Hormuz to manage energy transit.
• Regional escalation: Houthi attacks on Saudi energy facilities raises fears of wider regional escalation (FT)
• Iran-Oman: Iran threatened US with economic warfare, plans to declare new Gulf restricted zone and announce SoH deal with Oman (Bloomberg)
• Naval blockade: US naval blockade strangles Iran’s crude export revenue as offshore stockpiles dwindle (link)
• Latest forecast: Goldman Sachs said oil may rally to $120 a barrel if attacks on shipping in Middle East increase (Bloomberg)
• Hormuz traffic: Hormuz traffic fell to seven commodity vessels on Monday (Reuters)
We use the following fractal denominated Iran War. The lists below identify stocks that have out (under)performed in all three phases of the year … 12/31 to 2/27 (pre-war), 2/27 to 3/30 (during the war), and yesterday (the potential off ramp / TACO / etc.). 50 names in the Russell 1000 pass the test, and while it’s an eclectic list, it’s a good starting point at identifying durable leaders in a tricky environment. Paired with our factors, we like Netflix, Ross Stores, PNC, Alcoa, Lumentum. We run the same methodology but also for names underperforming all three phases of the year (95 stocks). Then , we look at the ceasefire fractal on April 8th: Stocks that benefited from the war (energy, commodity chemicals, defense contractors) got sold (HF profit taking) while highly shorted consumer discretionary (including housing-linked names) saw the most consistent covering. Long Only community buys what was working before the war started…memory, semi cap, optical, and keeping a close eye on Mag 7 complex.
See more details on the fractal for Iran
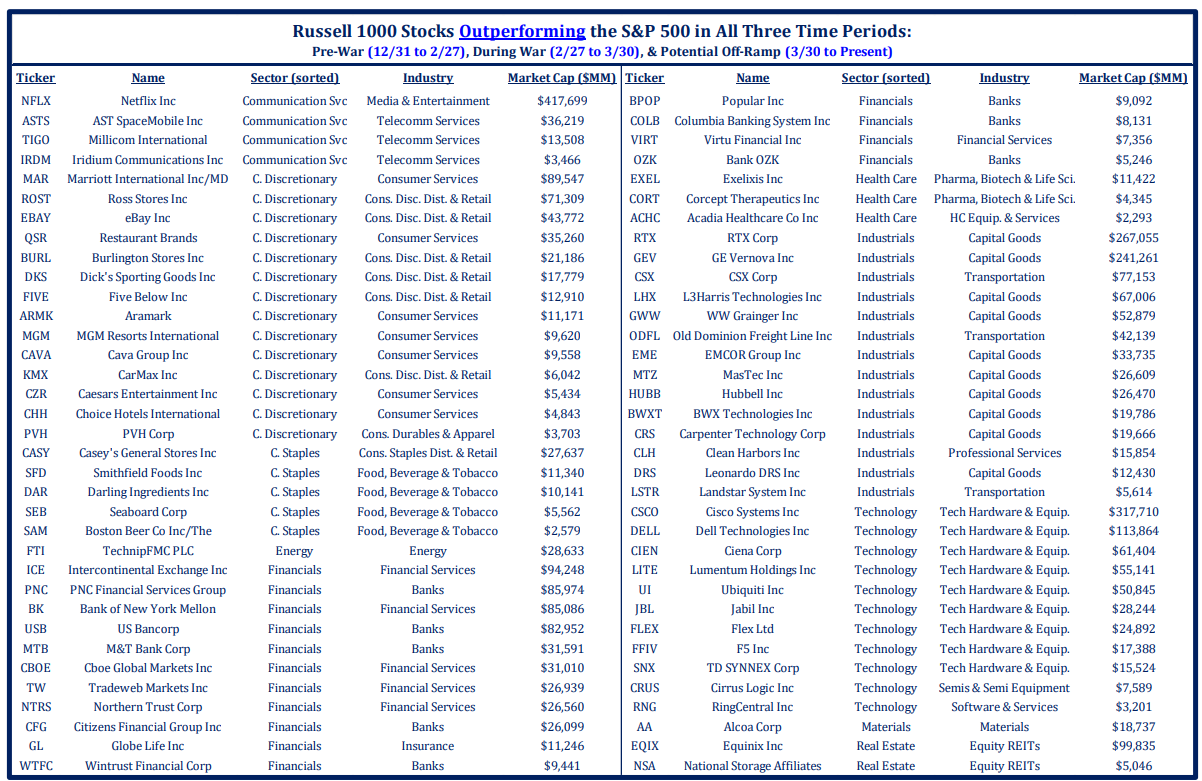
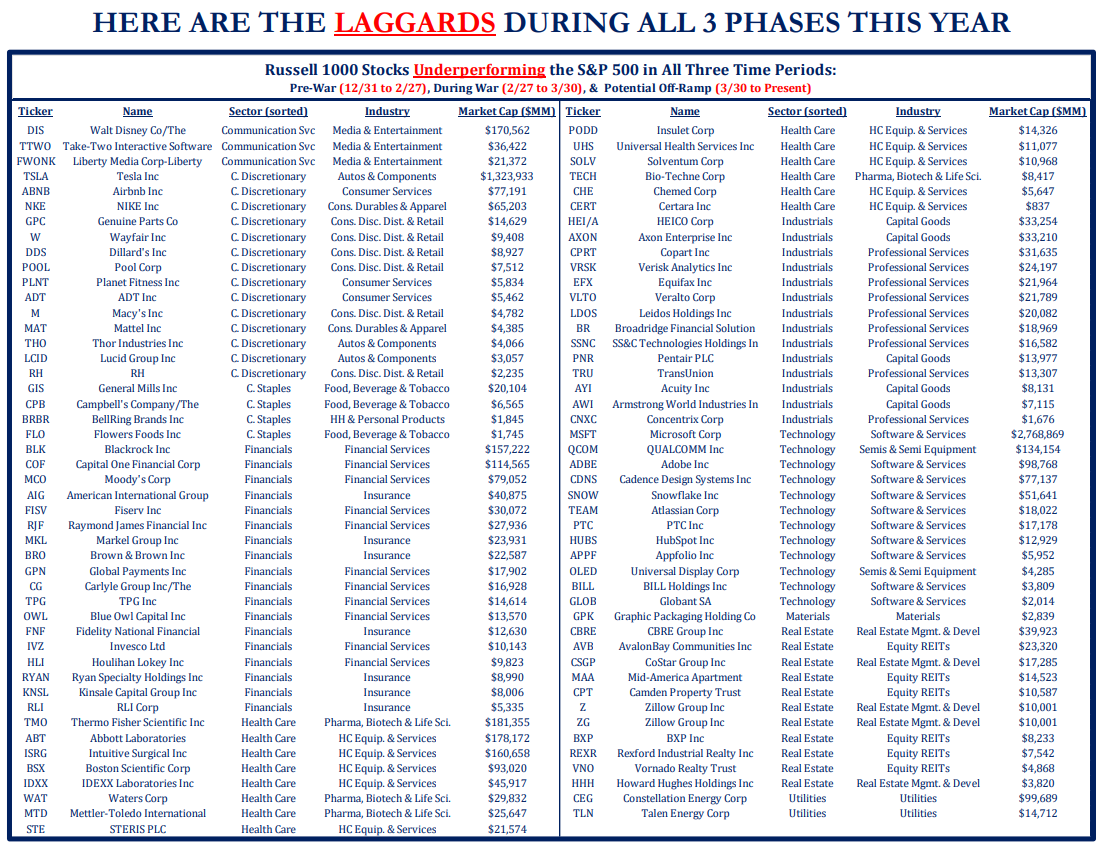
update april 8th: ceasefire taco –> what is doing well – back to pre martch pattern
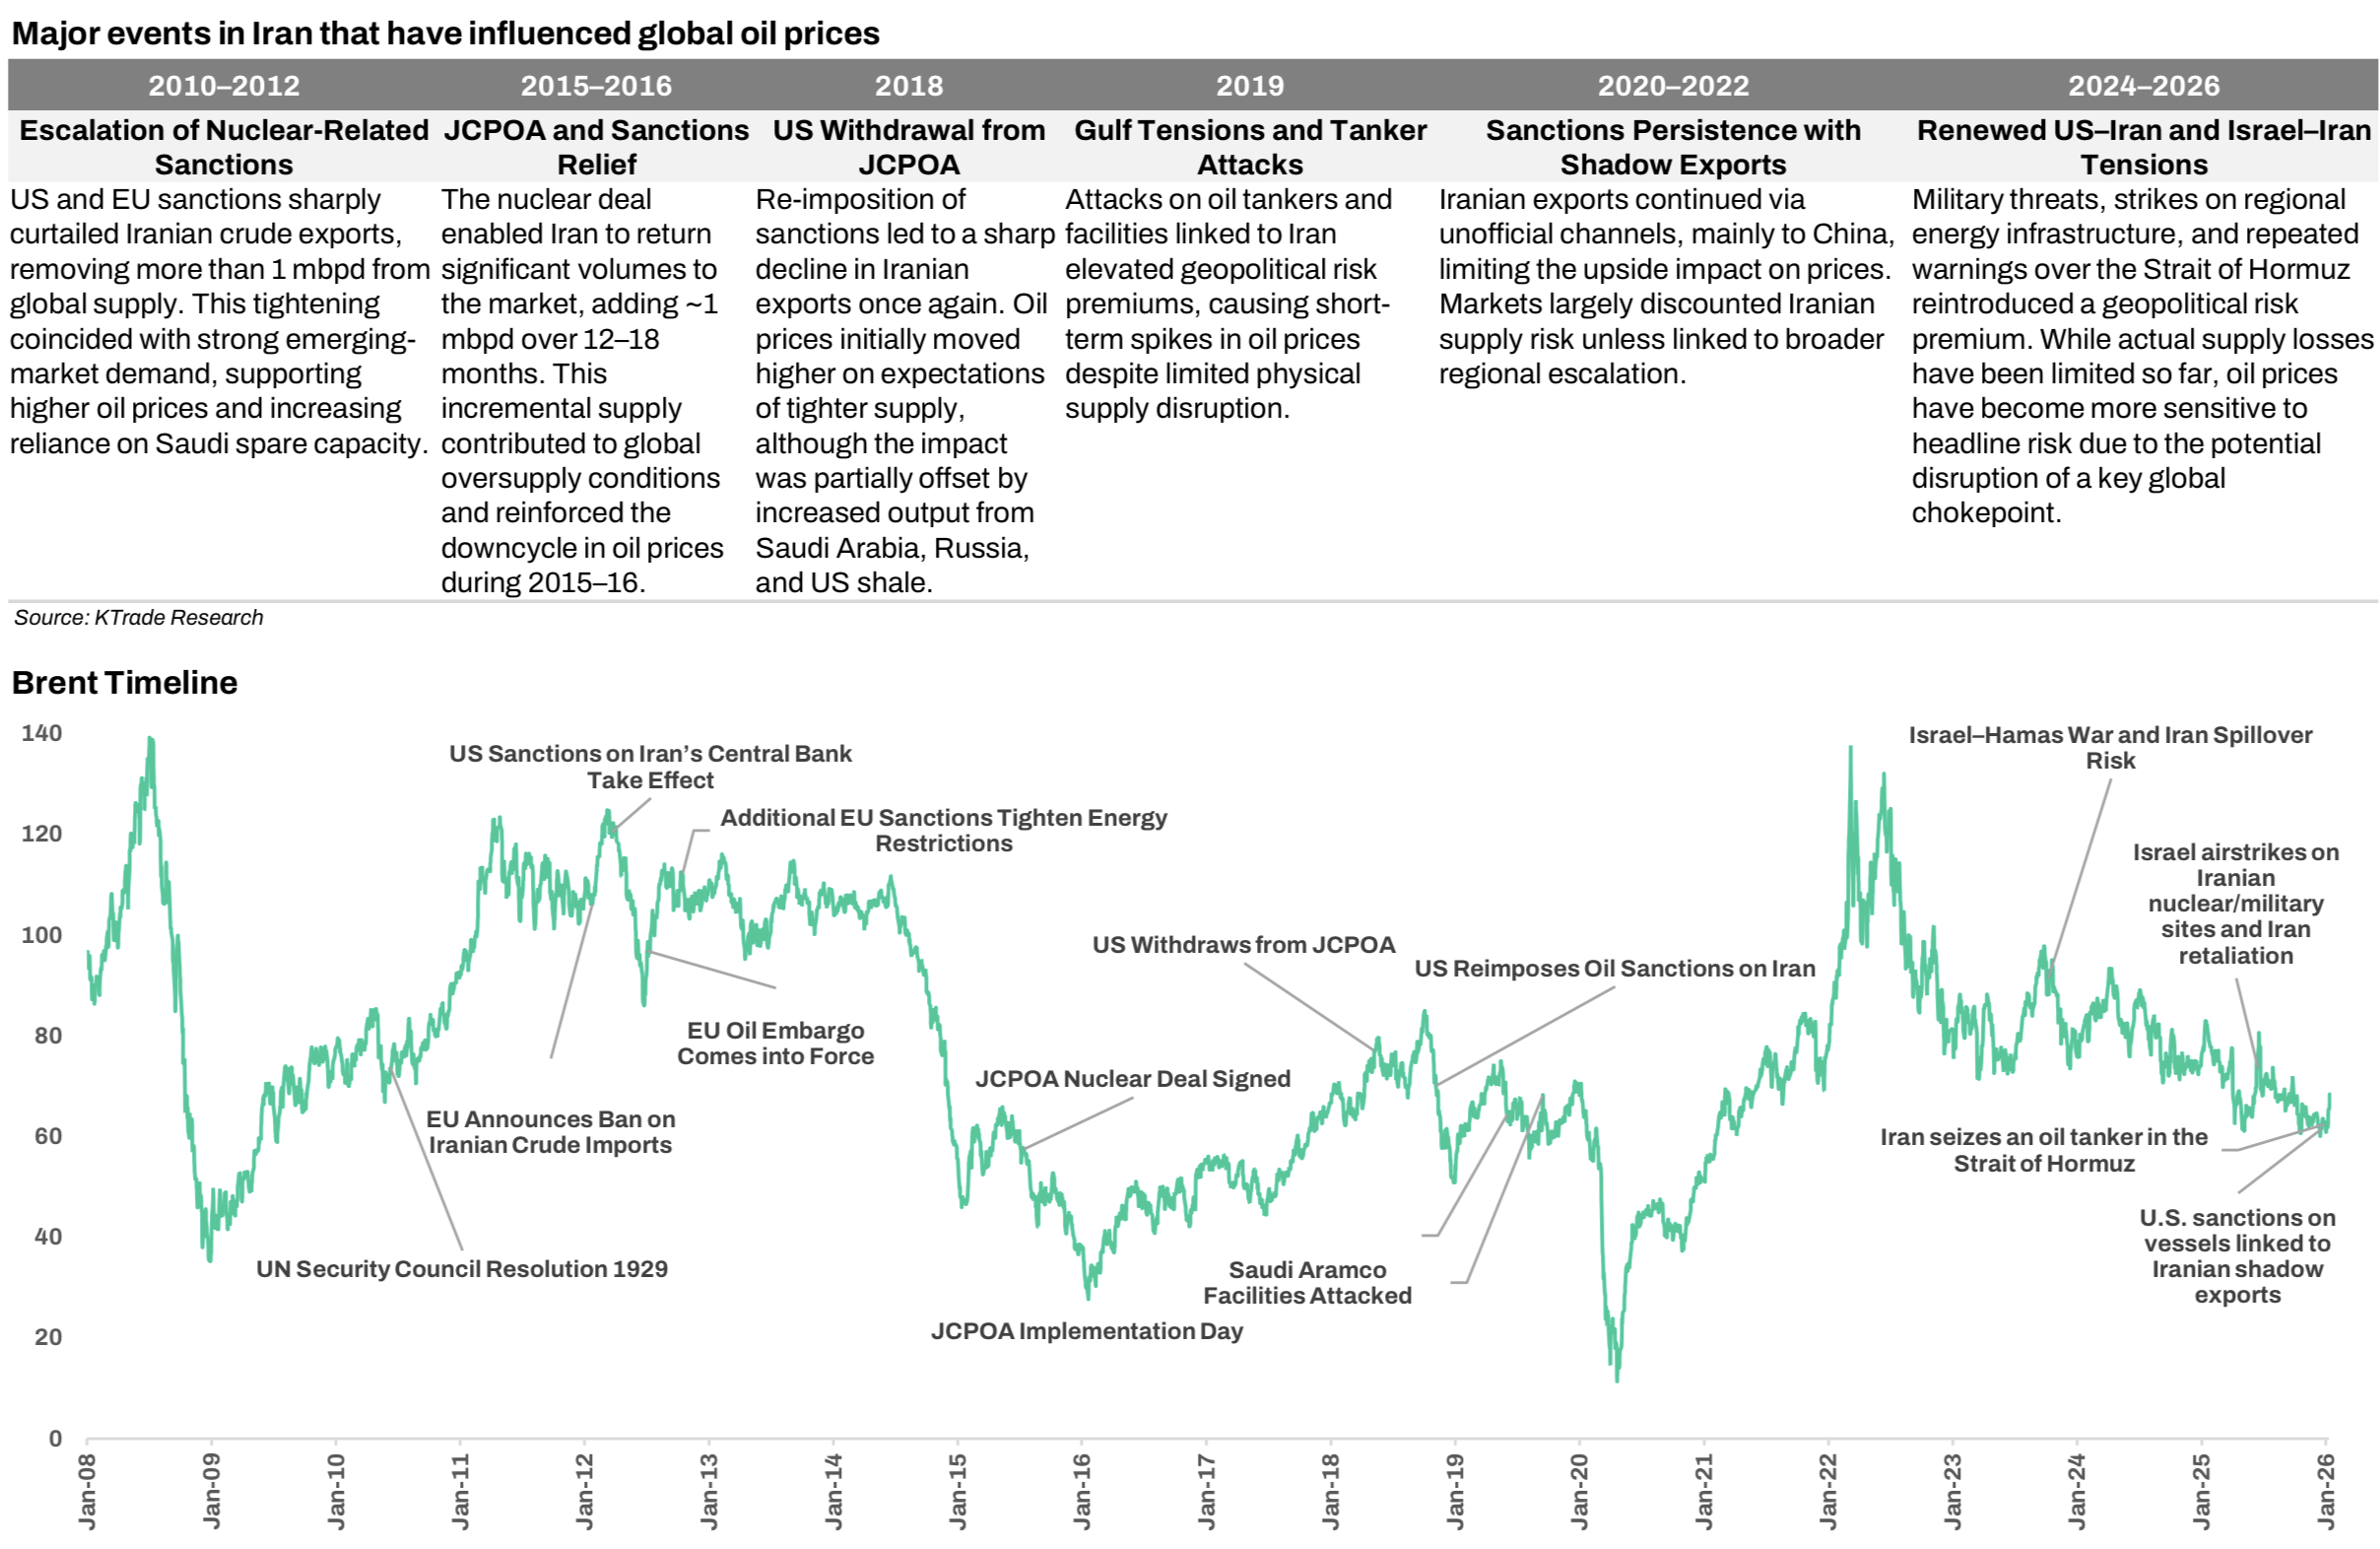
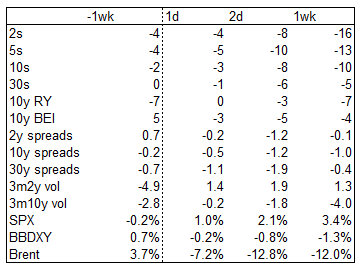
The last US strike on Iran was Sunday June 22, 2025. From 13 June 2025, Israel launched a series of strikes against Iran’s nuclear program, ballistic missile sites, and energy facilities, stating its aim was to stop Iran developing a nuclear weapon (Iran says it has not been developing a nuclear weapon). In response, Iran launched missiles and drones against Israel. Most of Iran’s missiles and drones against Israel were intercepted. The United States also conducted strikes on 22 June 2025. In response, Iran launched missiles against a US military base in Qatar. In the right hand table, here are moves across UST yields, spreads, vol, SPX. From 1wk prior to the strikes to 1d, 2d, and 1wk after – The market buildup in 2025 started earlier in the month, with Israel striking on Jun 13. After the US strike, the flight-to-quality reflex faded quickly as a ceasefire came through on Jun 24, and the hit to spreads unwound as vol selling re-emerged. Curve continued to bull-steepen, but more on Fed dovishness
The below chart shows the impact of the 2 strikes on the DAX (max down 3%), the S&P500 (down 2%), dollar DXY up slighty from 13th to 25th, crude oil up 10% before falling 15% after the US strike. Nikkei stayed very strong. Bitcoin was down 55 from 13 to 25th before rebounding very strongly.
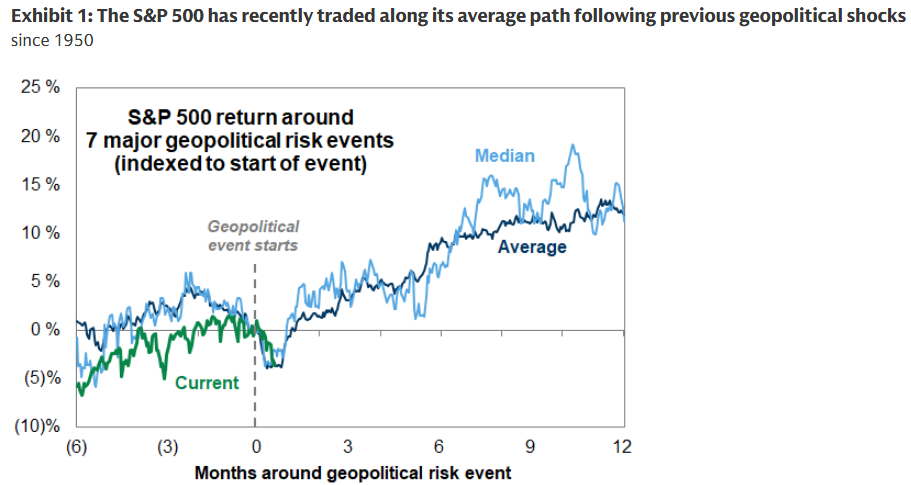
here is below the immediate returns after the launch of the war:
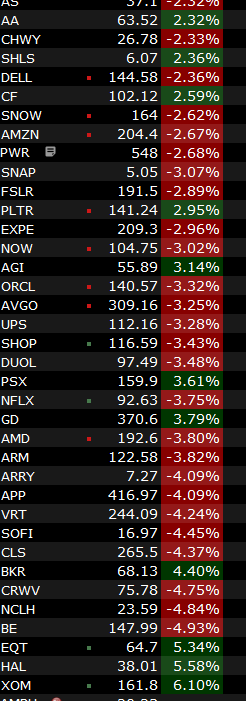
Stock Market And Iran War – The stockmarket displayed such resilience in recent geopolitical blowups. On June 13th, 2025, when Israel began a bombing campaign againstIran’s nuclear and military sites,the S&P 500 fell 1.1%to 5,976.97 and dipped as low as 5,943.23. By the time the 12-dayconflict ended,the indexwas upnearly 2%. OnJune23, after the U.S. bombedIran’s nuclear plants, the S&P 500reversed higher and closed with a1%increase.
In January, the U.S. capture ofVenezuelanleader Nicolas Madurobrought muted investor reaction.The S&P 500 rose 0.6% and theNasdaq added 0.7%on the Mon-daythat followedtheweekendop-eration. The event didn’t alter thestockmarket’s dull trend.
Covid ressemblance: In April 2020, oil markets experienced a shock that most investors had never seen: roughly 20 mb/d of demand vanished as Covid froze global mobility. Prices didn’t just fall; they broke, culminating in the once-impossible – negative oil prices. This week, we are staring at a shock of comparable size, but with the sign flipped. The Strait of Hormuz – through which roughly 20 mb/d of crude and refined products normally flows – has been effectively closed since last weekend. The duration may prove far shorter than Covid. But the initial magnitude of the impact is similar: the world is suddenly “short” a volume that, in normal times, would dwarf almost any supply/demand imbalance we debate.
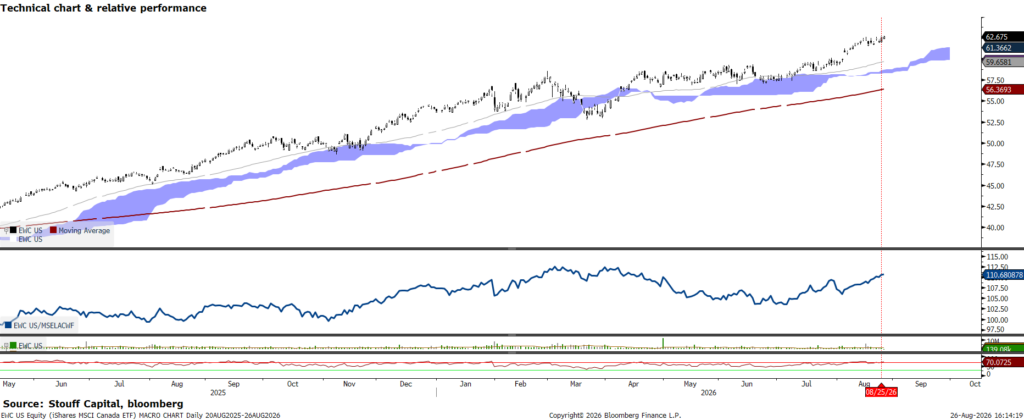
Fractal “Clash of Civilization” – CANADA trade war . RETALIATORY TARIFFS: Canada is matching Trump’s weekend tariff escalation with a sweeping package of counter tariffs that directly targets U.S. steel, aluminum and downstream manufacturing. Prime Minister Mark Carney will double Canada’s existing counter-tariffs on U.S. steel and aluminum to 50%, while adding new 50% duties on U.S. furniture, clothing, electronics, smartphones, and gaming consoles. Overall, the retaliatory levies cover roughly $20B in annual imports. The measures take effect on September 8 and represent a sharp reversal in Carney’s earlier conciliatory stance after trade talks between Canada and U.S. collapsed on Friday. Publicly traded companies in the space include ArcelorMittal (MT), Cleveland-Cliffs (CLF), Nucor (NUE), Steel Dynamics (STLD) and U.S. Steel (X). Publicly traded companies in the aluminum space include Alcoa (AA), Kaiser Aluminum (KALU), Rio Tinto (RIO), Century Aluminum (CENX), and Constellium (CSTM).
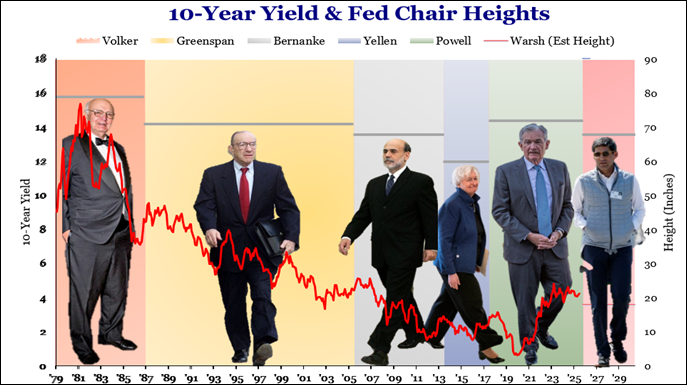
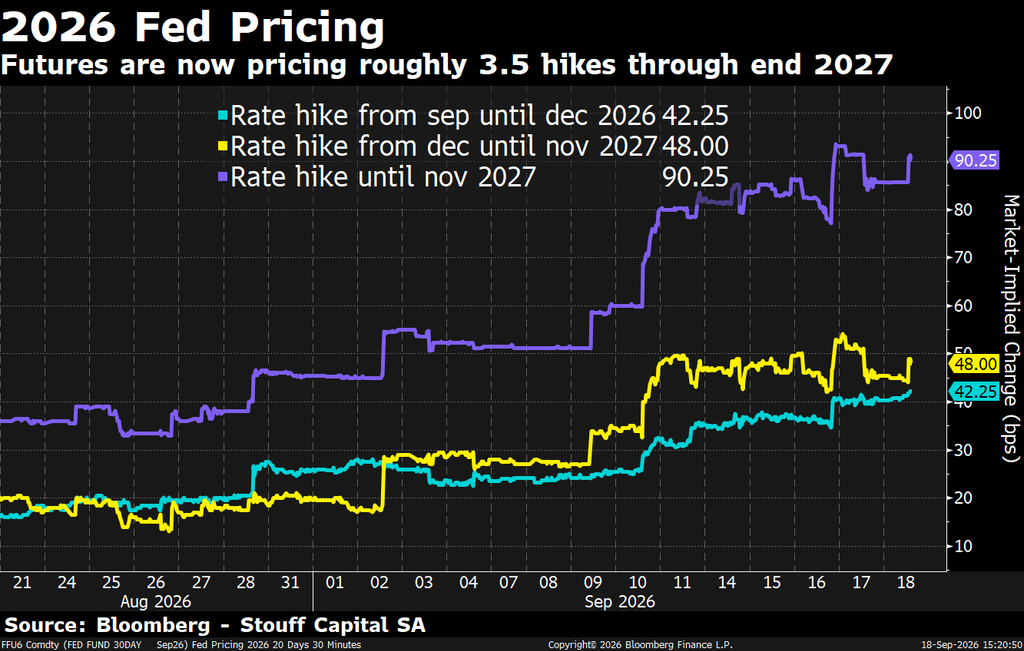
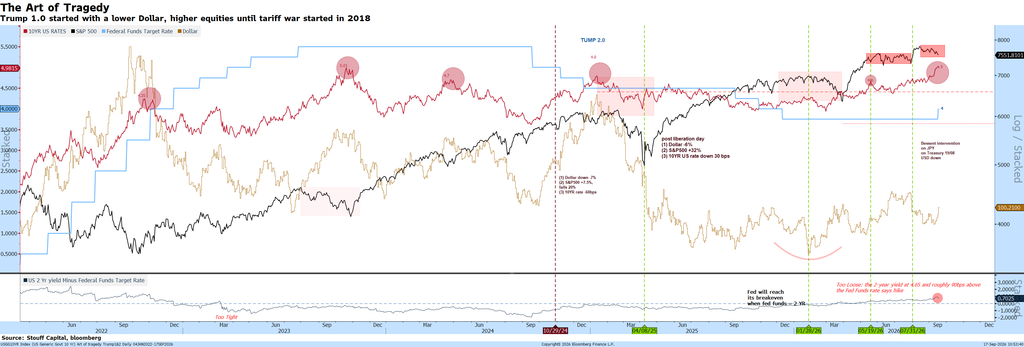
Fractal The Art of Tragedy – Fed Sept 16th, AdamS: “The FOMC raised the funds rate by 25bp to 3.75-4% on Sep 15th. While the hike was since the cpi data expected, the meeting was more hawkish than we expected in a few ways. First, a 16-2 majority projected at least one more hike this year, and there were no dissenting votes against today’s hike. Second, the median funds rate projection remained quite elevated through 2029, and the median neutral rate dot rose from 3.06% to 3.25%. Third, Chairman Warsh described the hike as having “removed a dose of accommodation” three times. Market now expects the FOMC to deliver a second 25bp hike in October, a change from our previous expectation that September would be the only hike. We think October is the most likely time for the next move because it is most natural to deliver hikes that the FOMC presented today as supporting “a timelier return” to the 2% target at consecutive meetings. We have kept our forecast for the terminal rate unchanged at 3.25-3.5% by adding to the September and December 2027 rate cuts we already expected a third 25bp cut in March 2028.
| Additional hikes are possible but not our base case. One reason is that our forecast for core PCE inflation remains below the median FOMC participant’s forecast at 3.2% (vs. 3.4% for the FOMC) in 2026 Q4/Q4 and 2.2% (vs. 2.5% for the FOMC) in 2027 Q4/Q4. Some of the gap for 2026 could come from a reluctance on the part of some FOMC participants to pencil in a downward revision from methodological revisions that will be implemented later this month, which we estimate will be worth -0.2pp on the year-over-year rate, until the impact is clear |
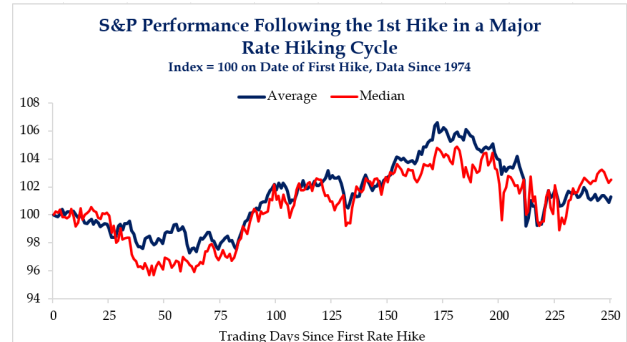
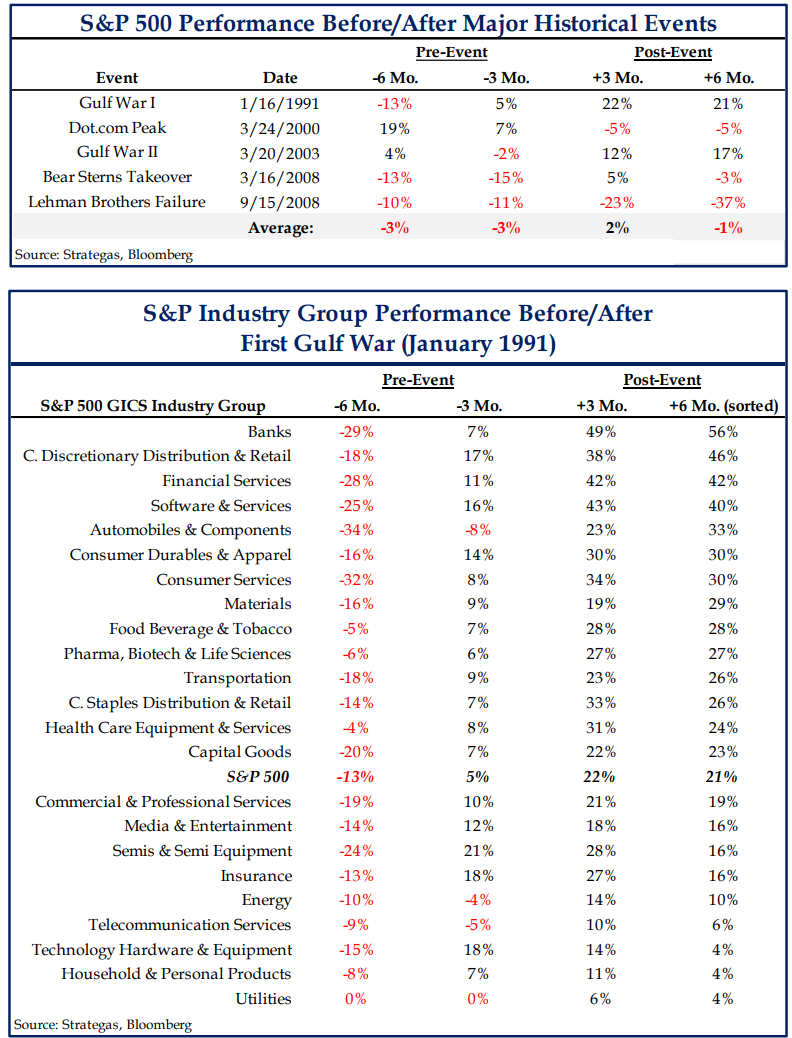
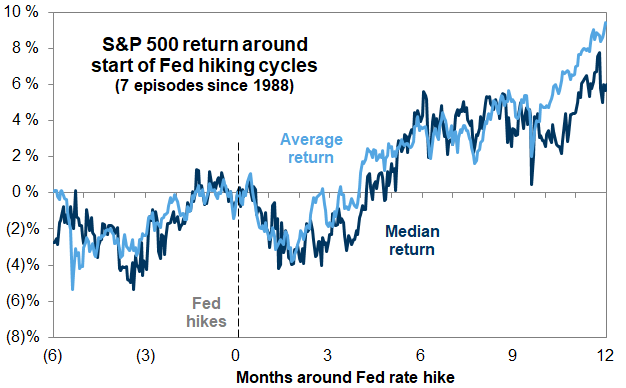
fractal Art of Tragedy: how US equities perform when the Fed raises rates: i. using the last seven tightening cycles as evidence, S&P usually struggles at the start of things — the average is -2% over the first three months. ii. but, the pinch typically doesn’t last very long — the average is +9% over the next 12 months. iii. the big exception to that last point was a bruiser in 2022. iv. the eventual trajectory of the market is determined by earnings growth; the speed and volatility of the moves in rates can heavily influence stocks along the way, iv. the two best sectors to own in those early months: tech and energy. : Rising interest rates are a headwind for equity valuations, but earnings are the most important driver of stocks. The S&P 500 forward P/E has declined from 22x at the start of the year to 19x today, but the index nonetheless sits within 2% of its record high.
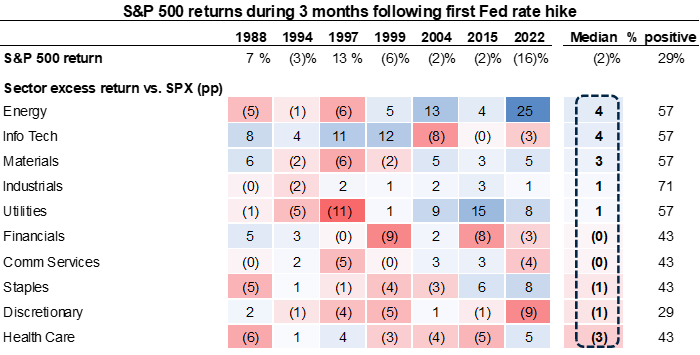
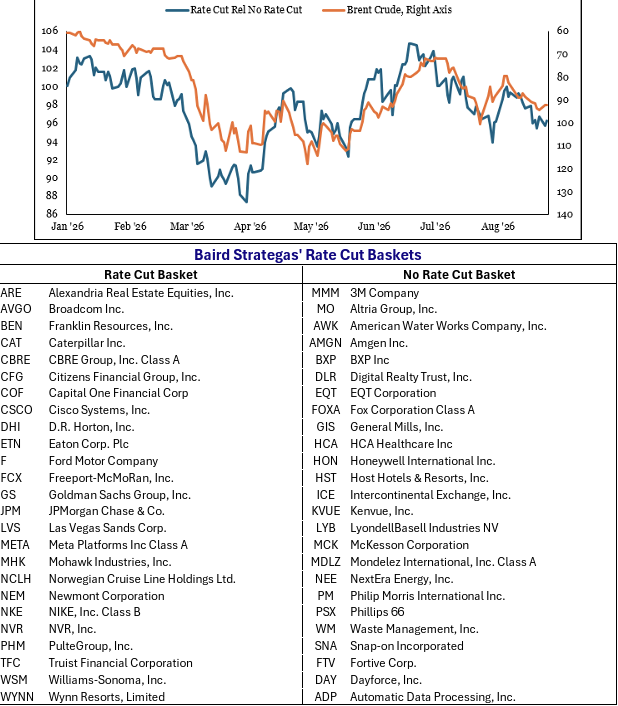
ENERGY A WINNER & FINANCIALS A LOSER AFTER FIRST HIKE IN A CYCLE:
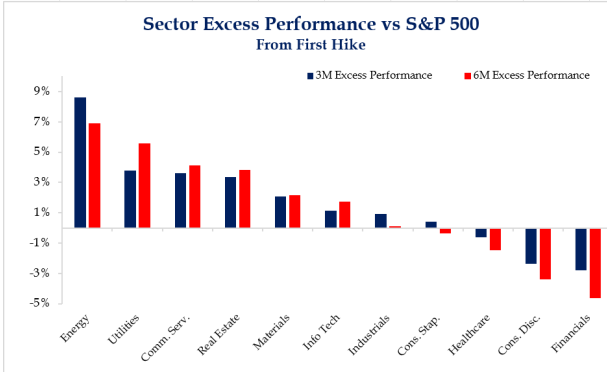
fractal rate cuts/ no rate cuts baskets
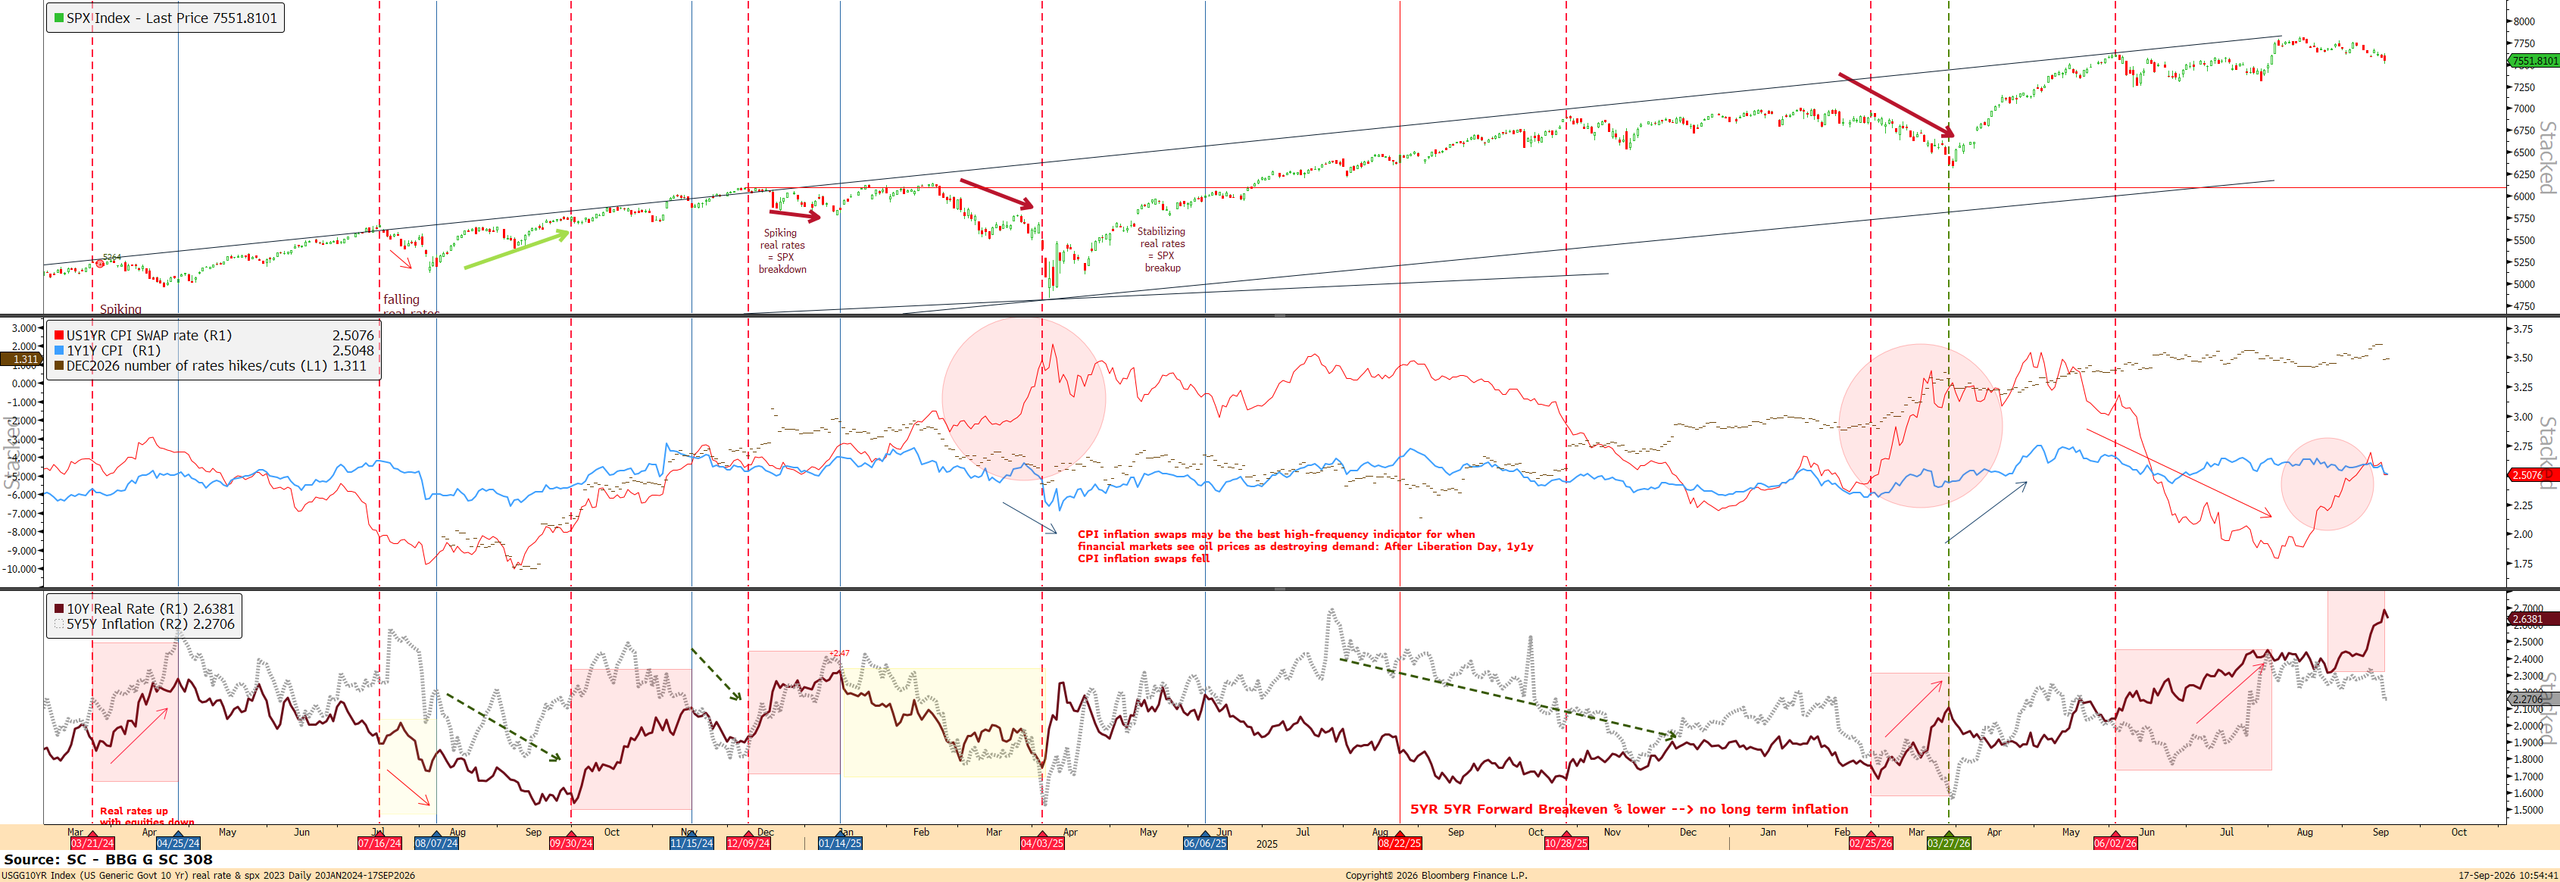
See all details on the fractals for Trump 2.0 Art of Tragedy – like (1) new Fed chairman Warsch – (2) JPY coordinated intervention , (3) Bonds intervention (see below) .
(3) FRACTAL BESSENT INTERVENTION ON BONDS – August 19th: Treasury / USD: Treasury doubled the maximum size of long end liquidity buybacks from $2bn to at least $4bn per operation in the 10-20yr and 20-30yr sectors through early November. The words “at least” matter: this doesn’t read like a hard ceiling and clearly opens the door to doing more if required. Mechanically this isn’t QE and they still have to fund whatever they buy back. There also isn’t some requirement that every operation is perfectly duration neutral… Treasury manages duration across the whole funding program. But the signal seems pretty clear: they are willing to use buybacks and issuance composition more actively to stabilize the long end. Call it quasi-Twist, Twist-lite, whatever… the label matters less than the reaction function. Gold spoke loudest yesterday, responding sharply to the TSY buyback headlines with its second +2σ advance of the month. Bitcoin is similar and followed with a +2σ move of its own, trading back above its 200-day MA for the first time in roughly 10 months, as the DXY went the opposite way, USDJPY was swatted lower again, and the 2/10 curve flattened.I actually think the more lasting implication may be for the dollar/gold/cryptos than rates. Rates can eventually re-clear higher because the underlying supply hasn’t disappeared. But if the market starts believing that sufficiently aggressive long end tightening will be met with larger buybacks, shorter issuance or other liability-management tools, some of that adjustment has to migrate elsewhere. A flatter curve and weaker dollar feels like a pretty logical expression of that. For equities/gold AdamS think that is pretty bullish. The important information yesterday wasn’t whether $4bn itself changes the supply/demand balance… somewhat marginal. It was learning that the response to pressure in the long end can include changing the way Treasury manages duration. But according to AdamS: “It raises the risk of higher inflation if one tries to control the yield curve. That will put pressure on Fed to keep rates low.”
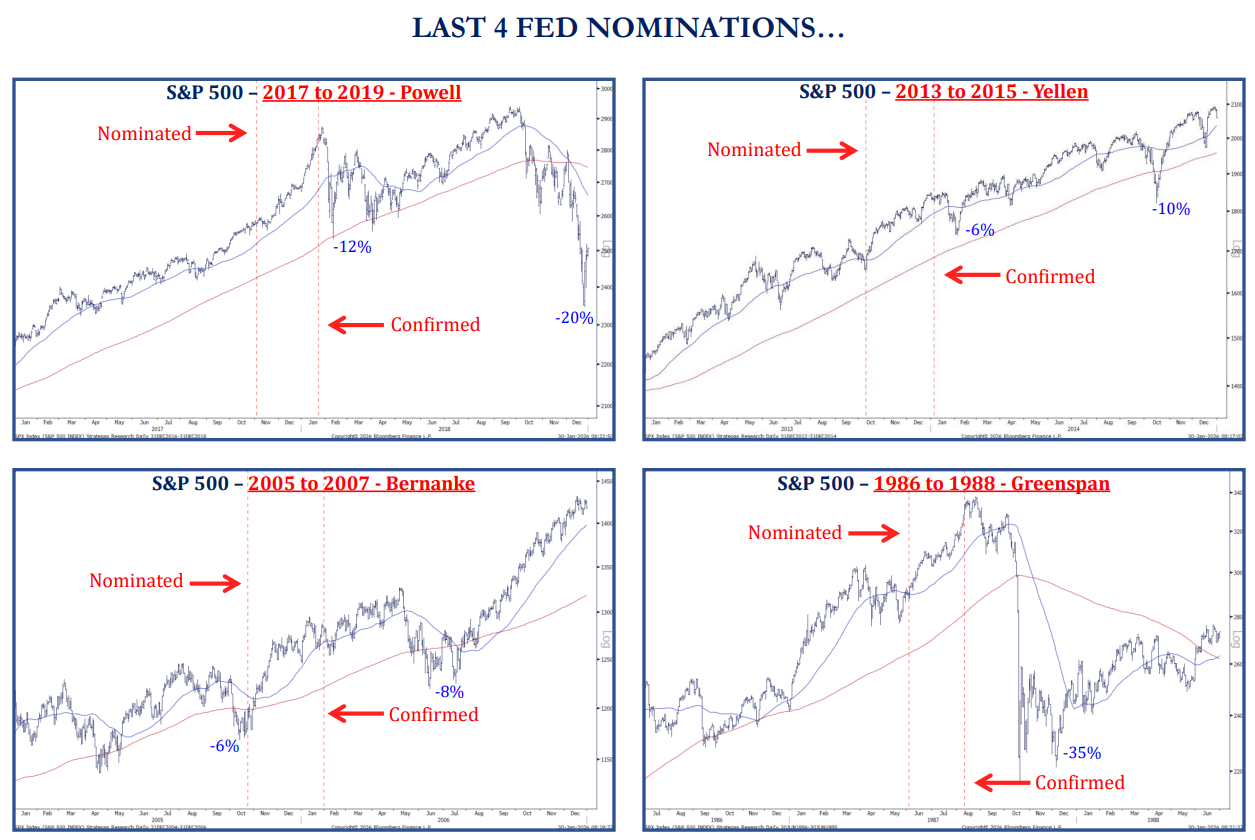
THE REGIONAL MATRIX
We have made some changes (this is rare, usually takes a decade) as we have new data on earnings momentum for major indexes. Thus we will assess a region not only on its Relative Valuattion since 1995, but also on its relative and absolute earnings momentum. As this item is very predictive, it will be assigned a big weight of 15%, the weight of the Trend grade to 35% from 40%, and the Sentiment grade’s weight from 20 to 10%. In the case of a CPD (change Point detection=extreme sentiment grade coupled with a Trend reversal), the Sentiment grade’s weight will increase to (10%+30%) 40% instead of 60%.
Update – September 16th: Warning – Our Matrix has switched to bearish short term. Our three month outlook the Matrix stays bullish at 19.3%. European and EM equities are OW with US again. Kairos is back in “Summer” economic cycle for all except a Winter for China. Valuation grades have increased (lower PE) thanks to much higher earnings.
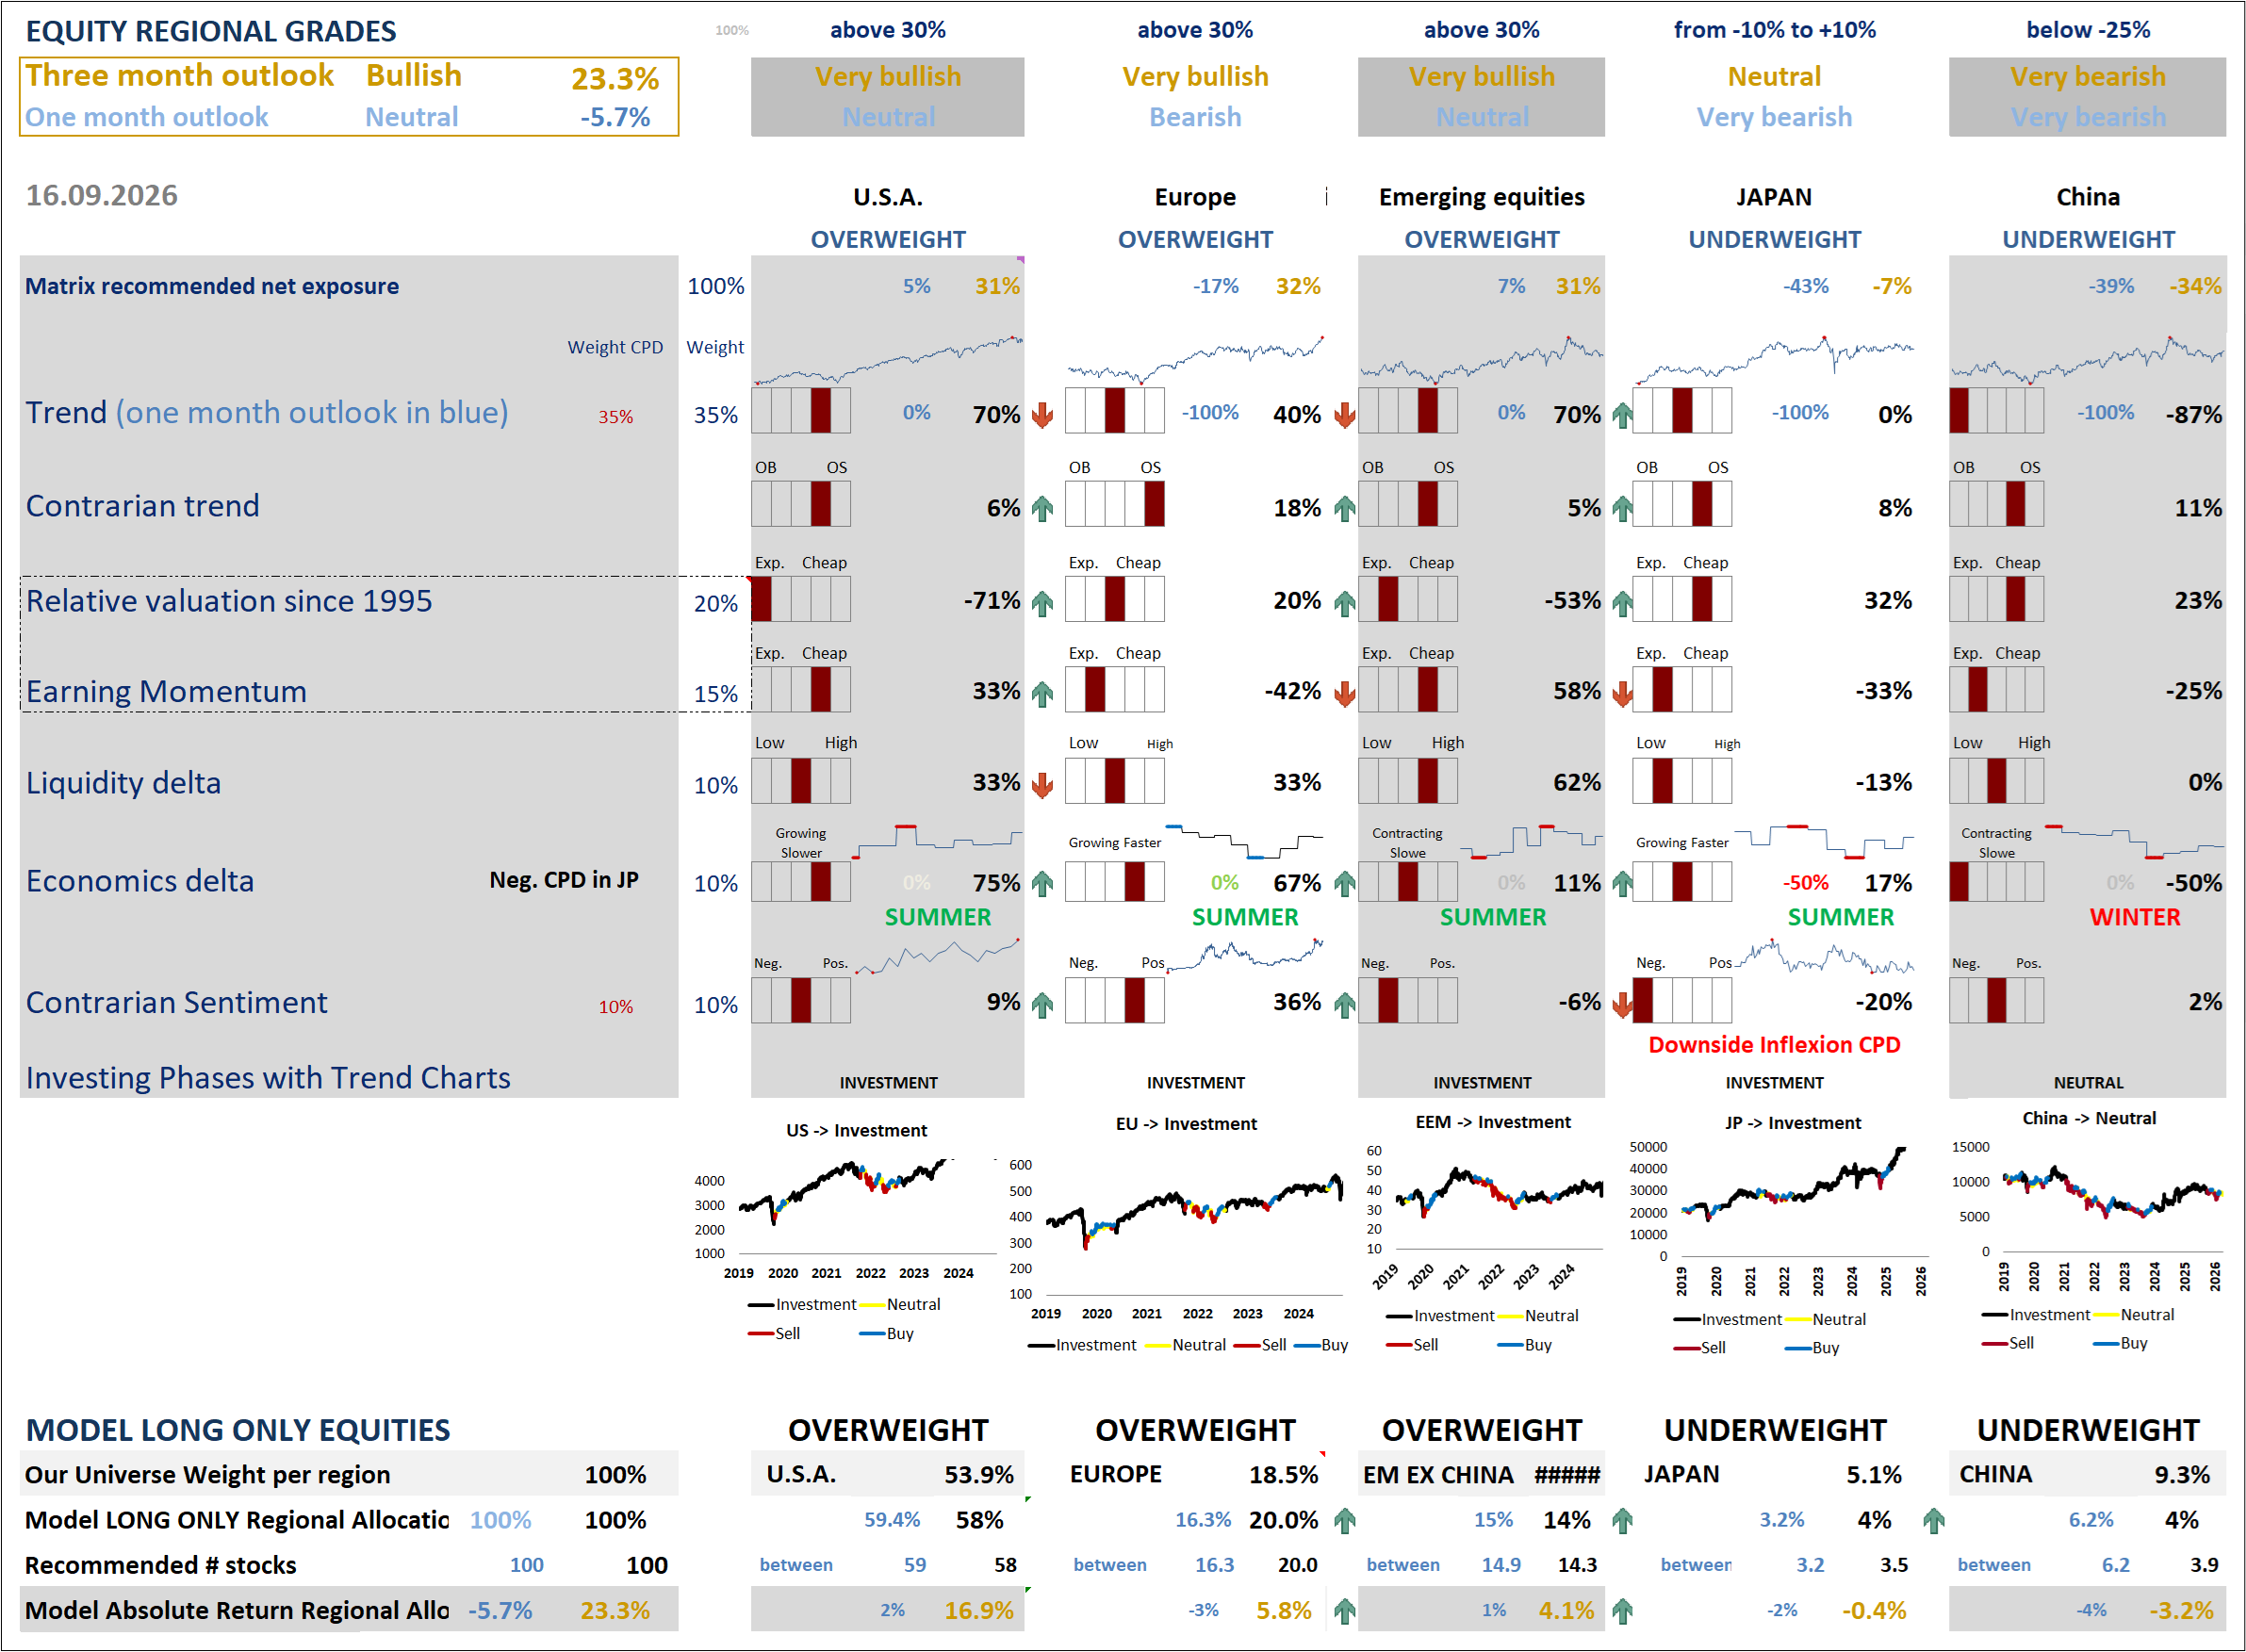
What our World Sector Matrix tell us ?
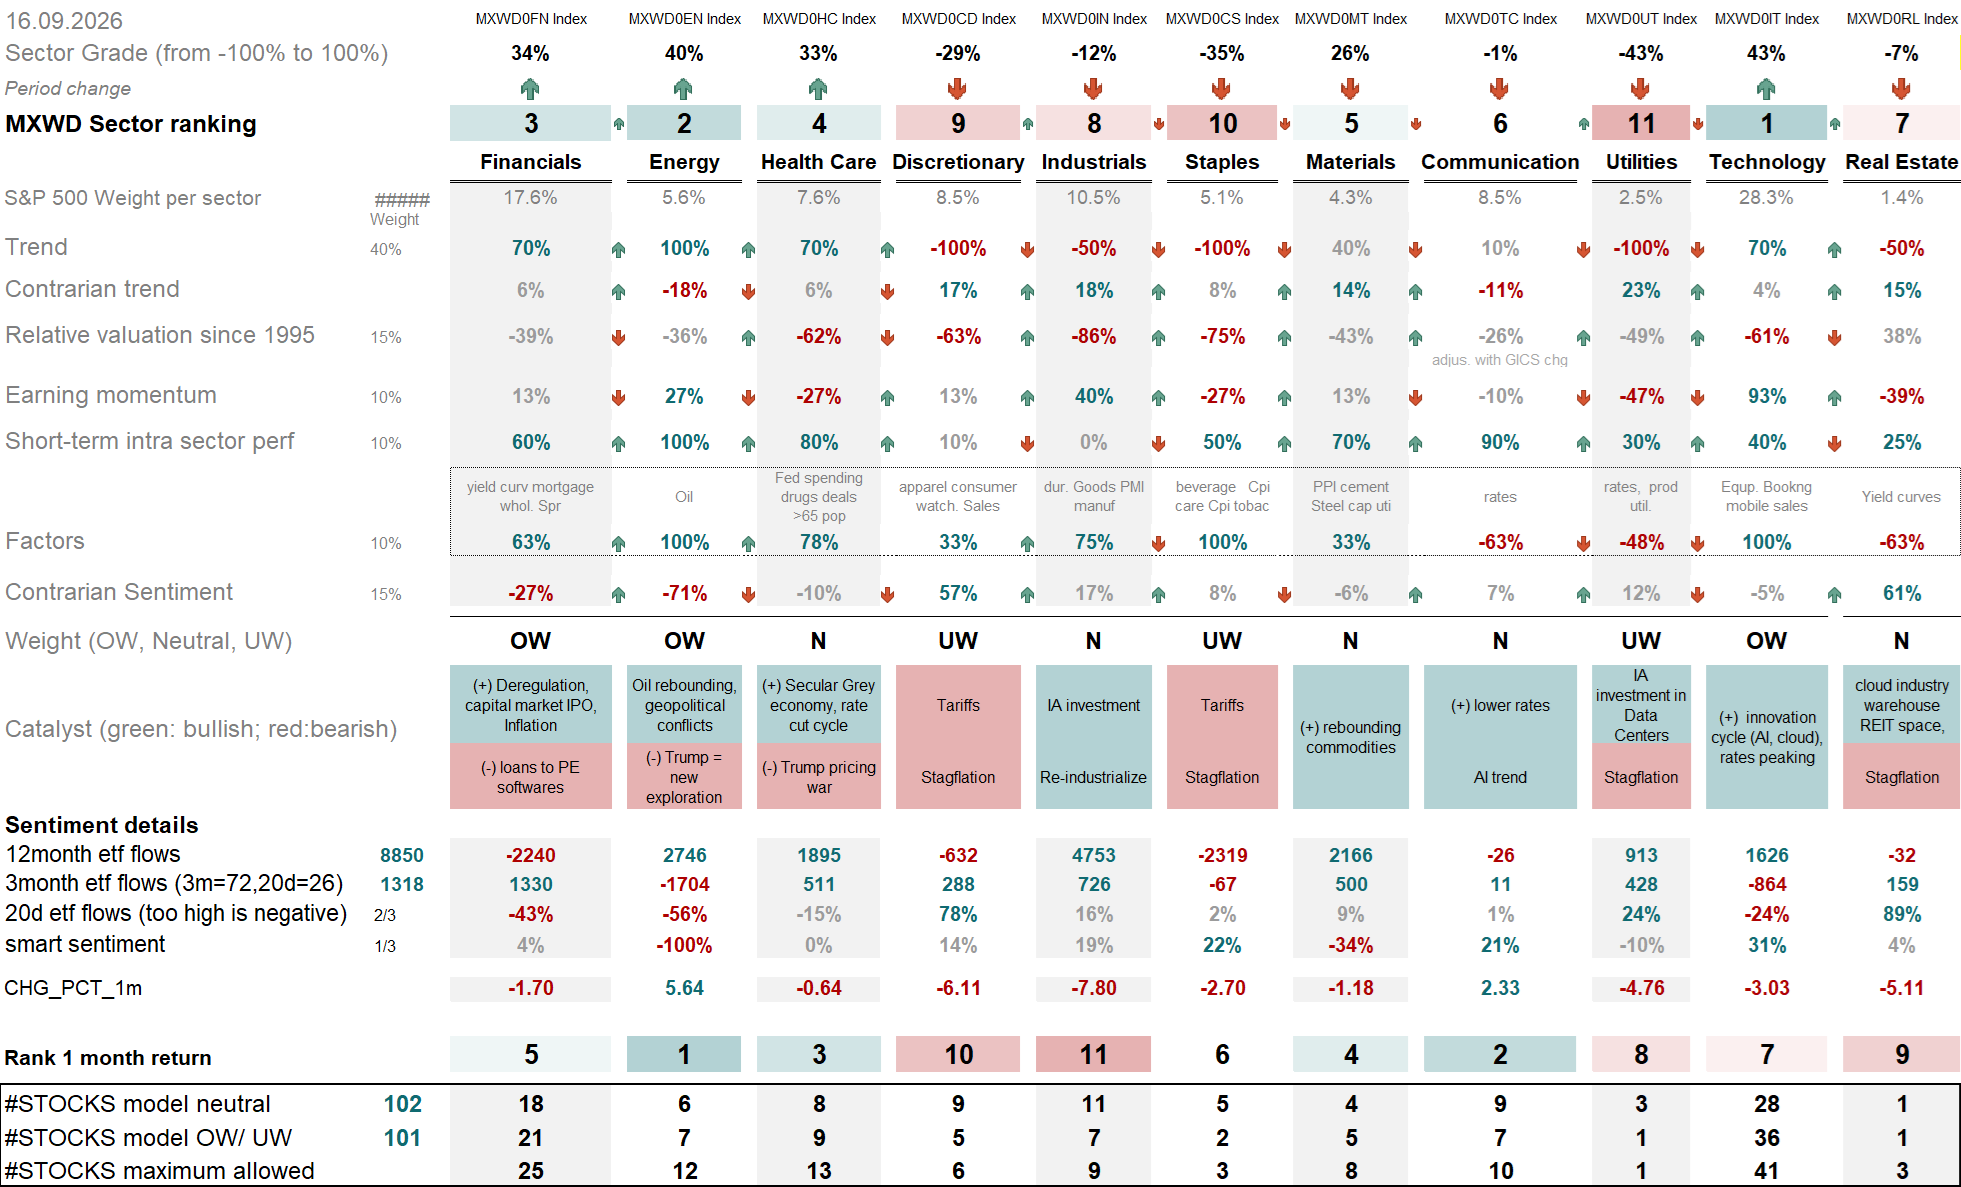
Find above our World Sector Matrix, incorporating all global equities. Overweight sectors are Technology, Enargy, Health-care (NEW) and Financials. UW are Communications, Discretionary and Utilites.
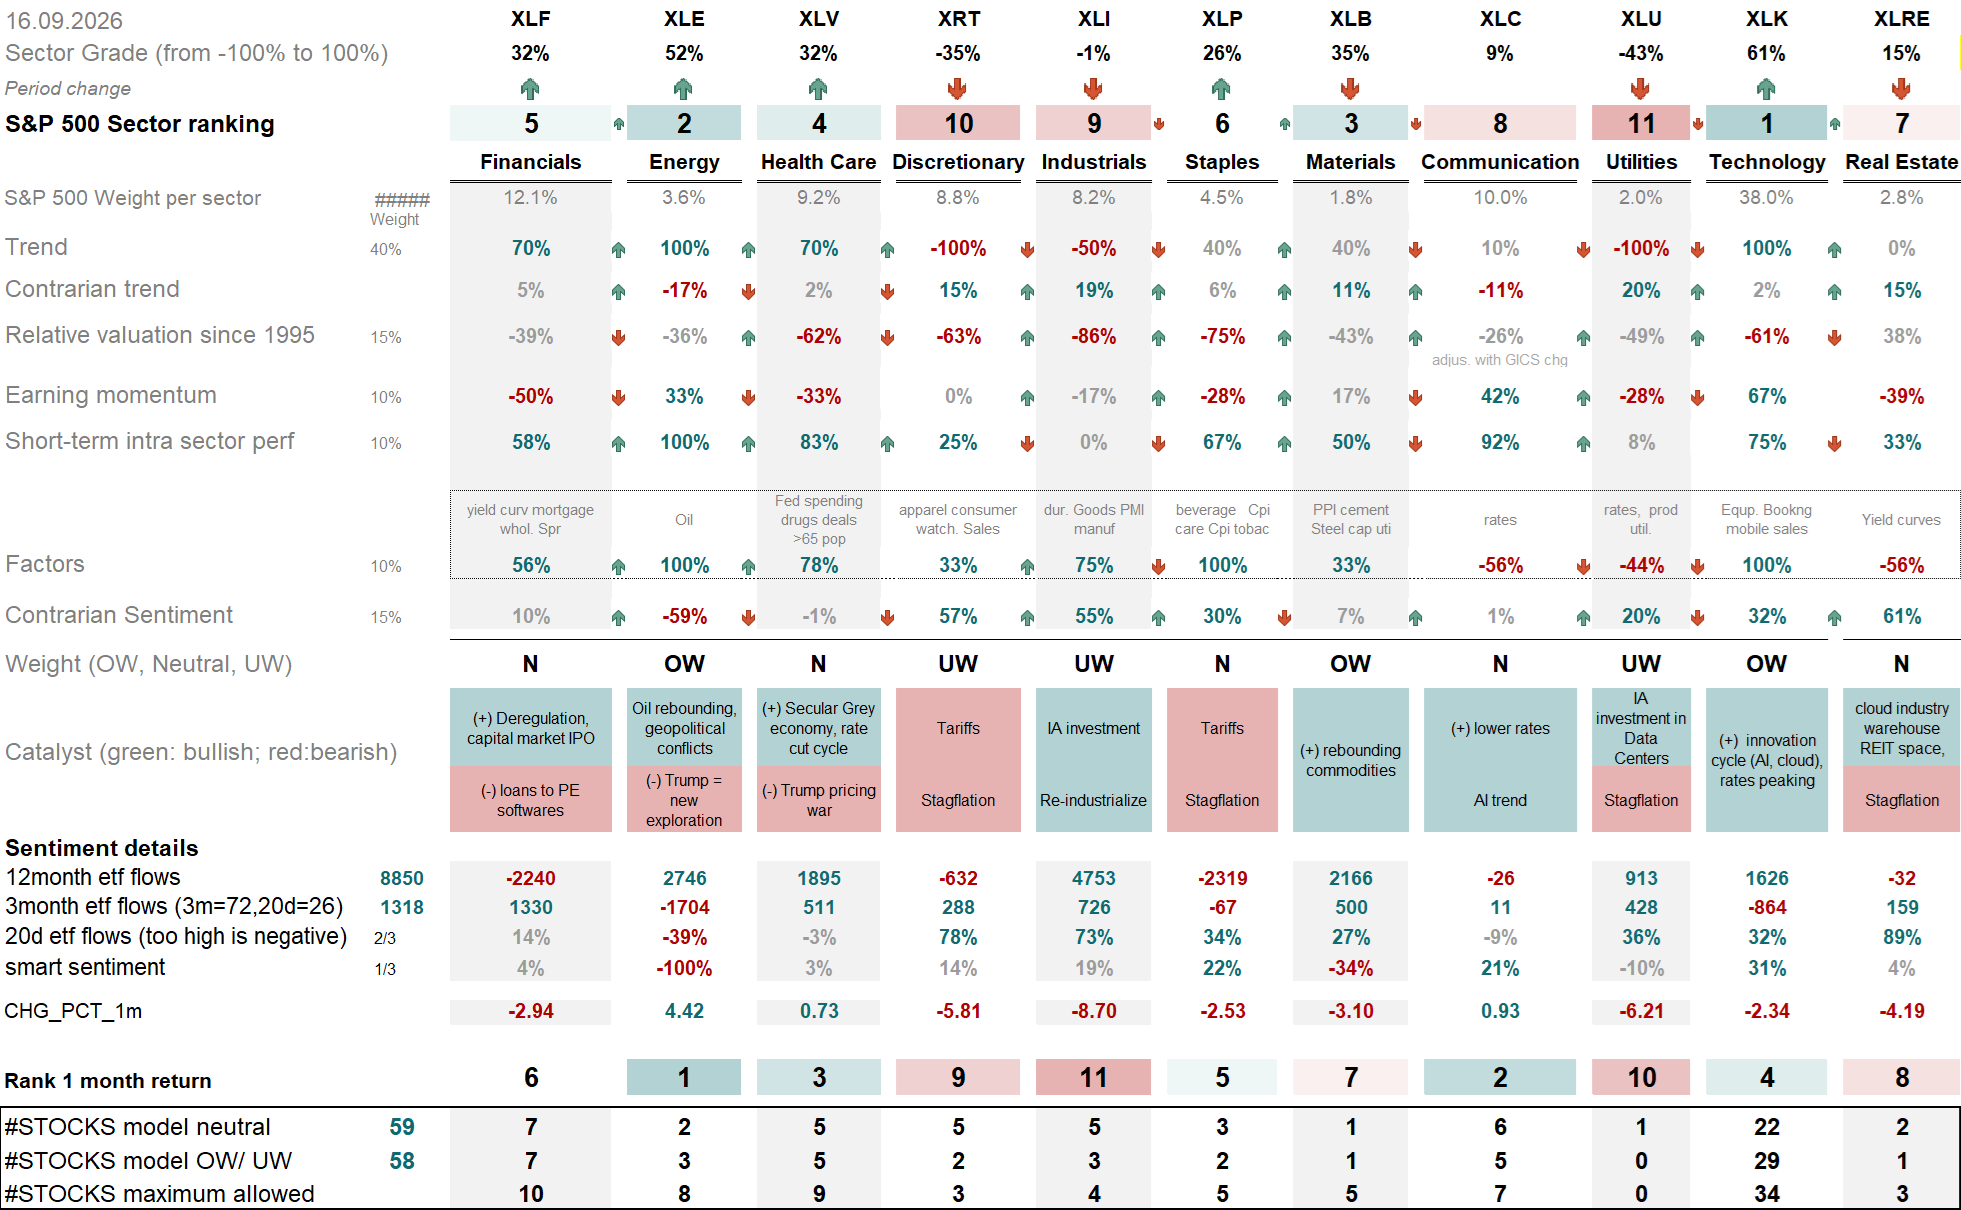
In US, on the above table on September 11th: OW sectors are Energy, Financials, Tech. Discretionary, utes and Communications are UW. HC is upgraded to Neutral, near OW, while Industrials have been downgraded to Neutral.
In terms of earnings momentum, there’s been a maximum deterioration within indebted sectors like Uties, Real Estate and Staples. Financials have continued to undergo their earning momentum deteriorate probably explaining its under-performance. On the other hand, Energy, Communication, Discretionary (???), Technology are the sectors with positive earnings momentum.
When looking at Contrarian Sentiment, smart investors recommend shorting Enargy. In the last 30 days, best sector returns are energy and TMT. Industrials and discretionary are not doing well.
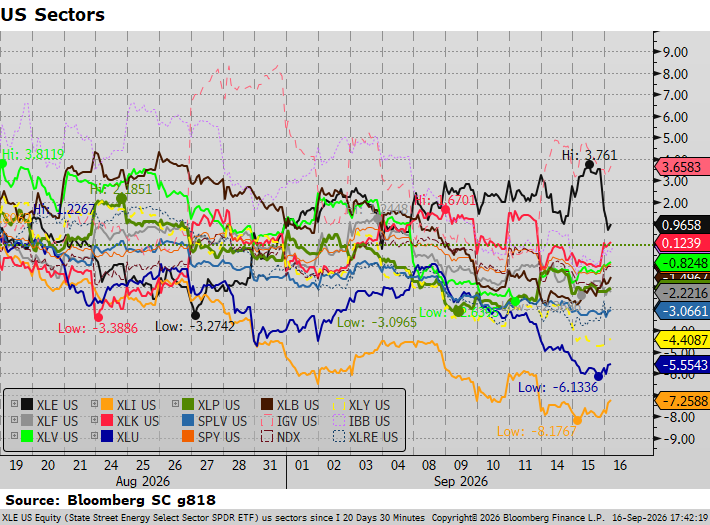
Find our various charts on sectors in US and Europe here…
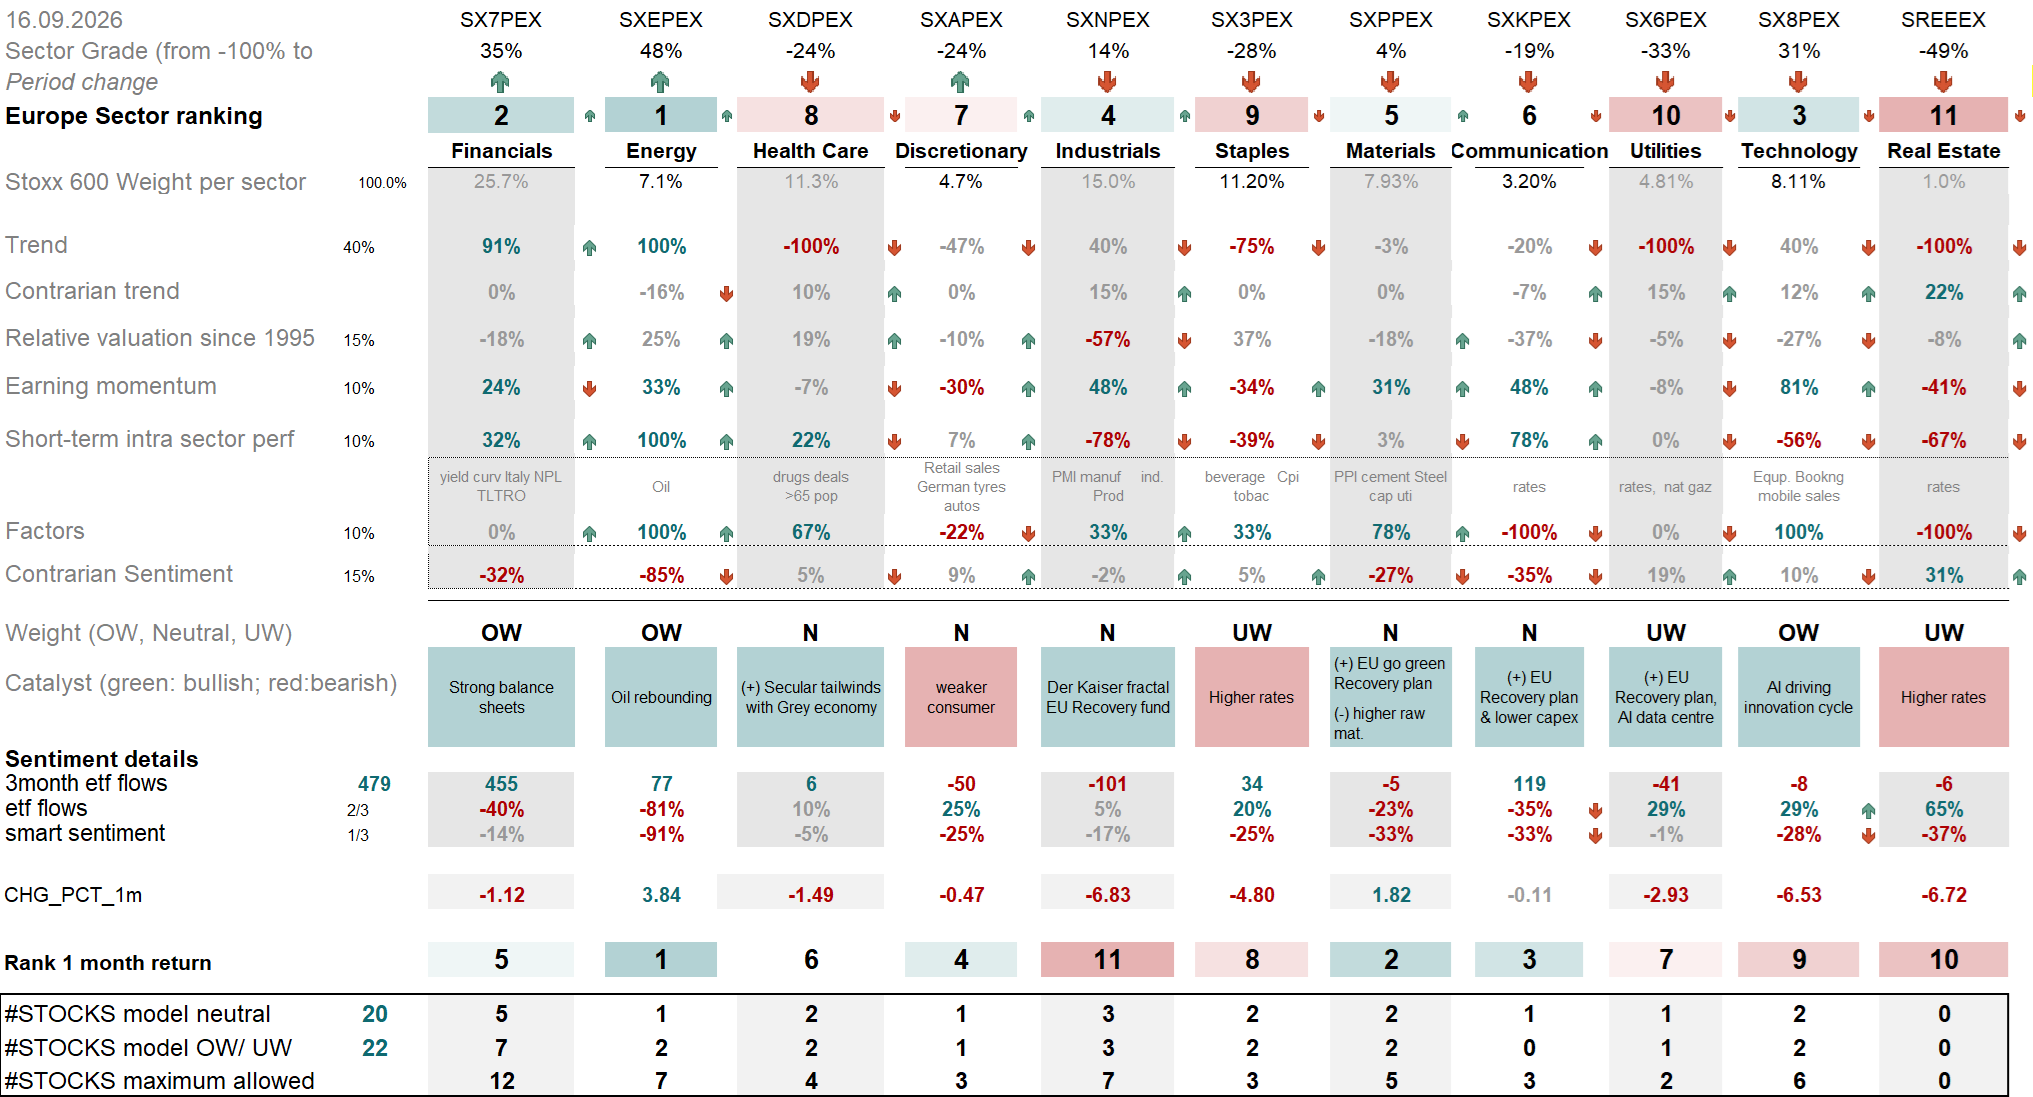
Update 2026. We made a change of weight in Europe with the current market cap. That has an impact on the number of shares to own per msector, like Energy is increased from 4% to 6.8%.
In Europe, OW sectors are Tech, Financials and Energy. UW are Real estae, Staples and Utilities. Earning momentum is good in Financials, tech, Industrials. To the contrary, it is bad for Disc., staples and Real Estate.
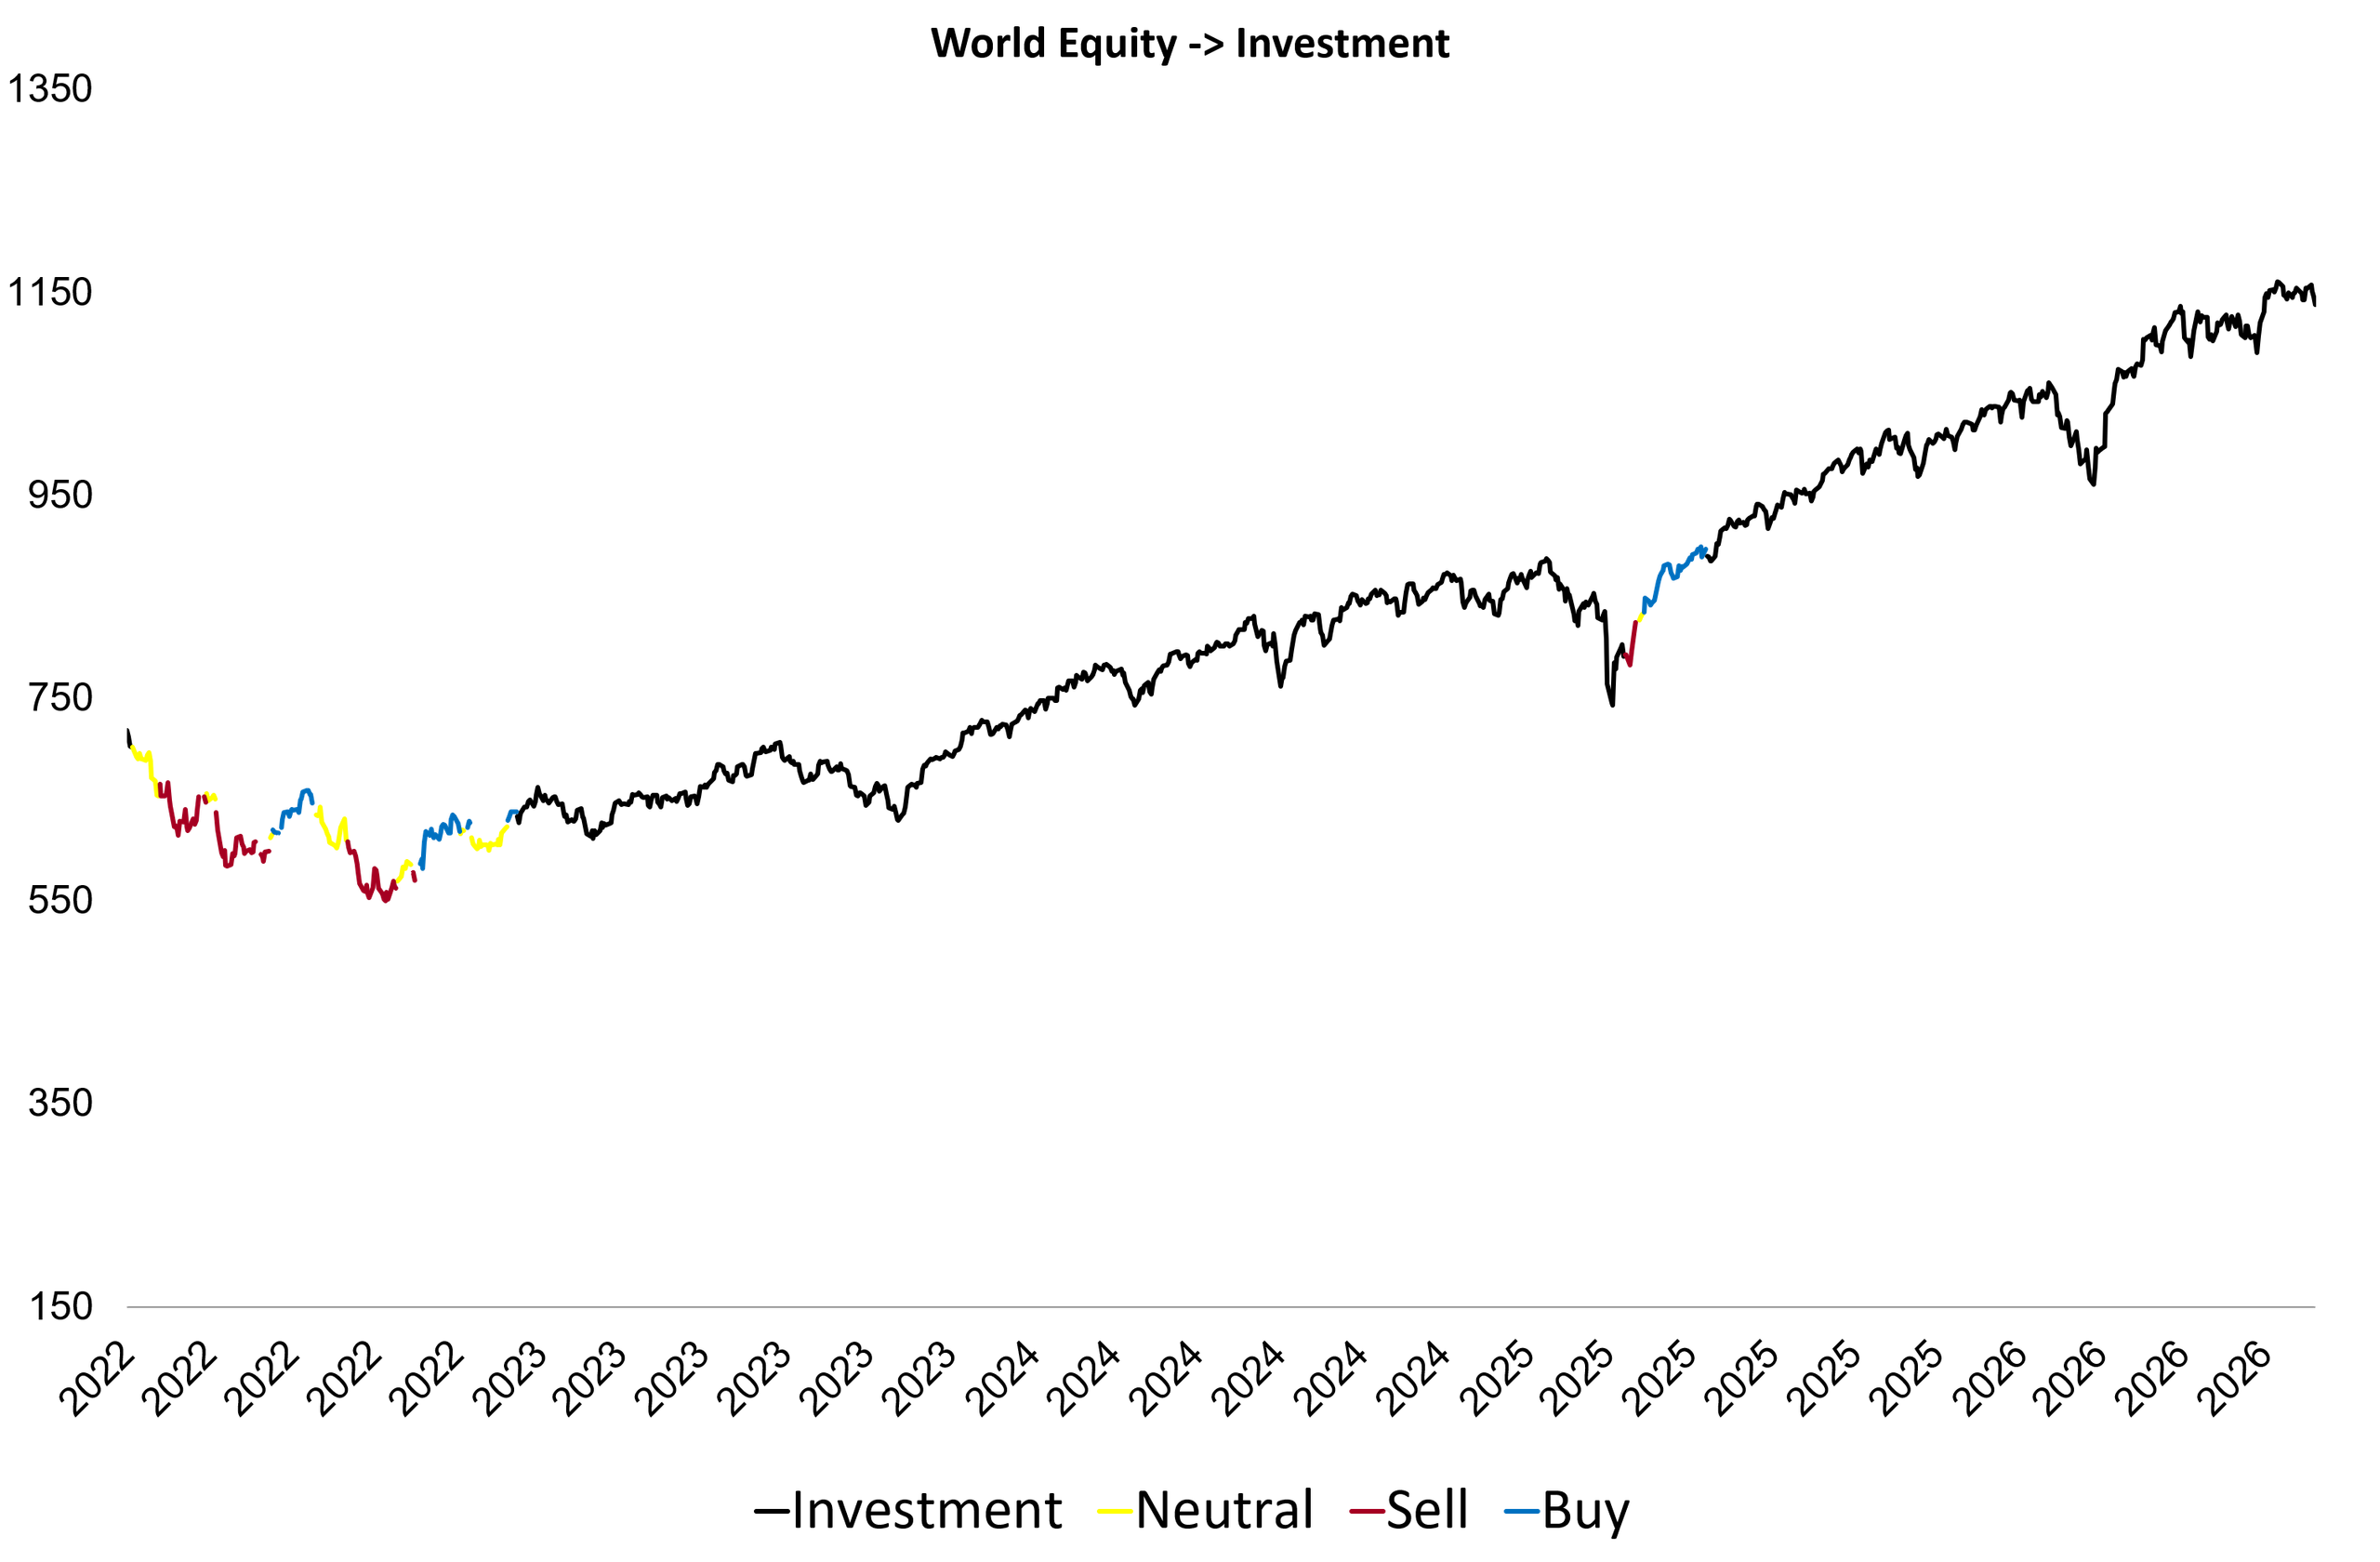
FIRST PILLAR OF MATRIX: TREND model is in an Investment phase for global equities:
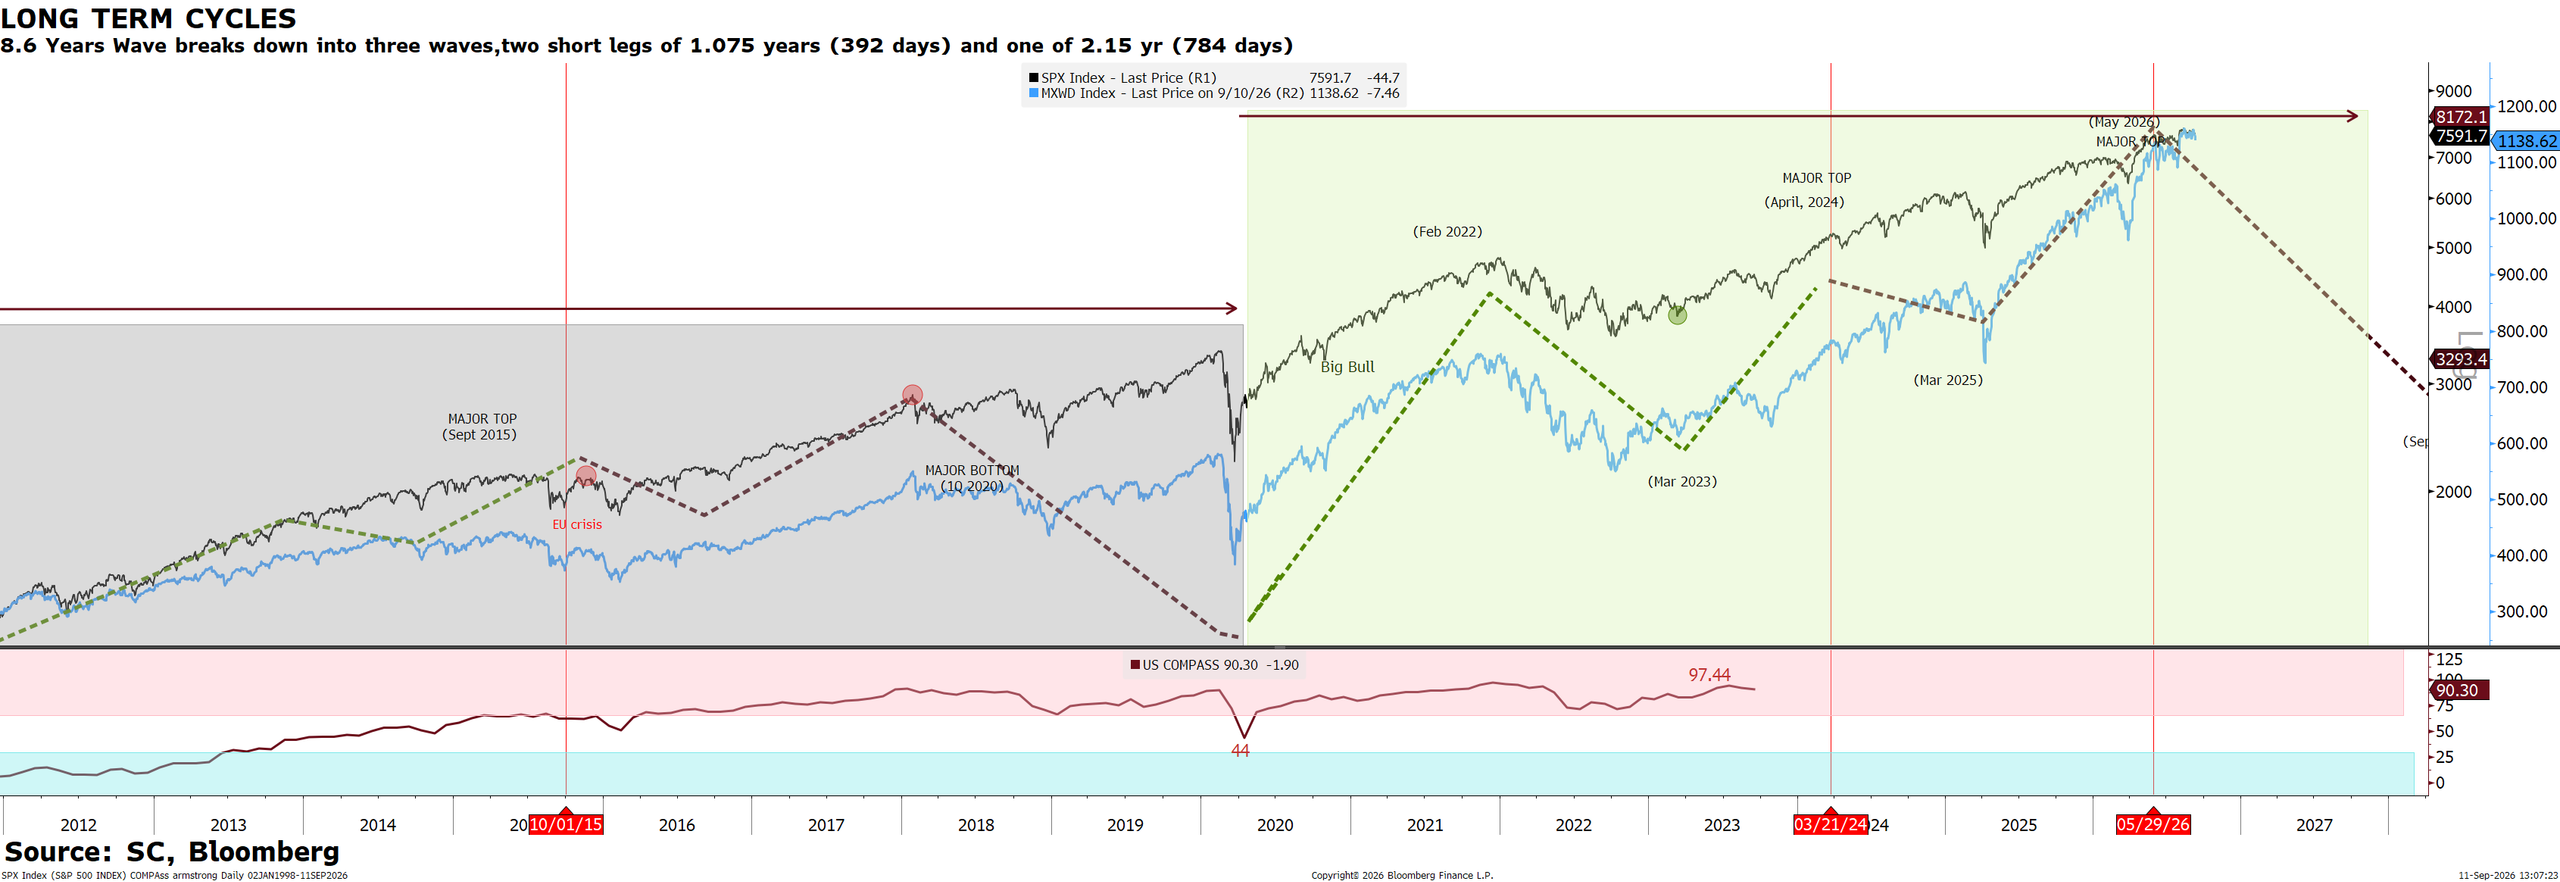
Near-term and Intermediate-term technical trends remain bullish for US Equities. Our cycle model forecasts a potential market top in May 2026.
FIRST PILLAR OF MATRIX: US Valuation back to attractive, with US earnings exploding
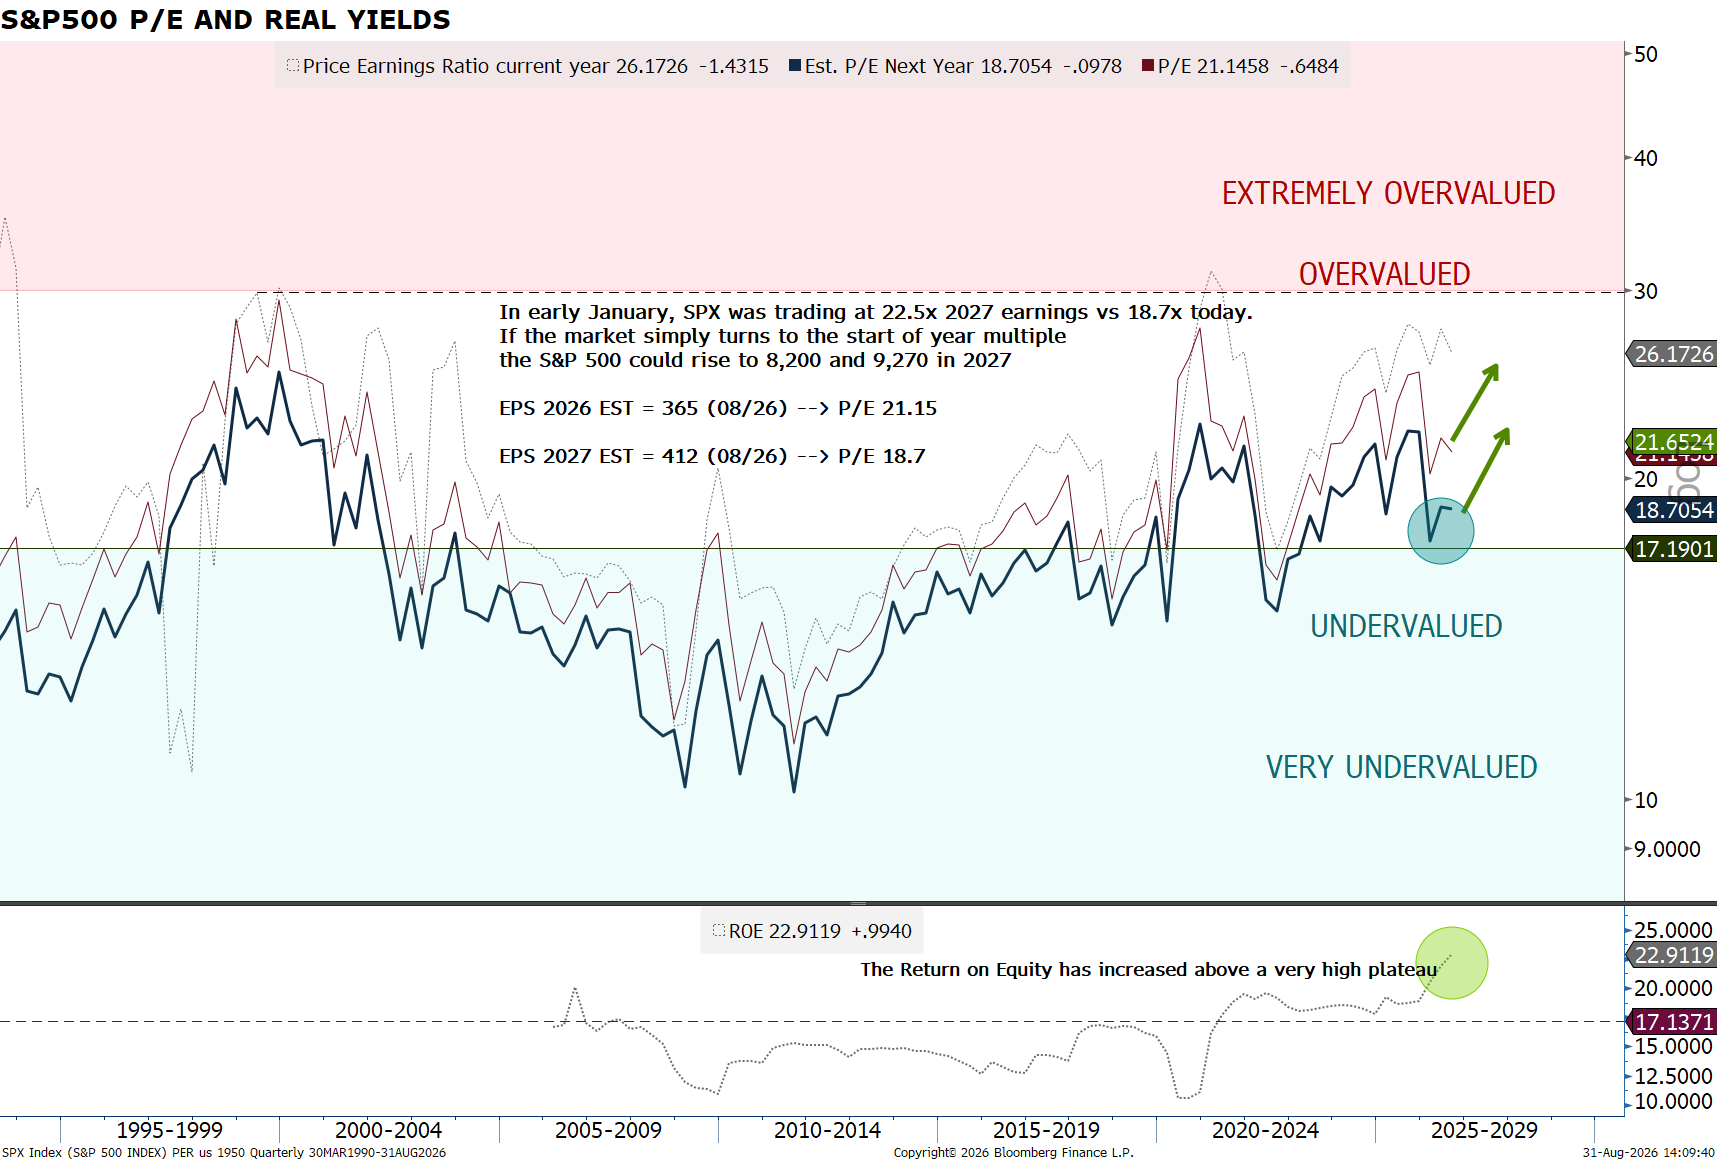
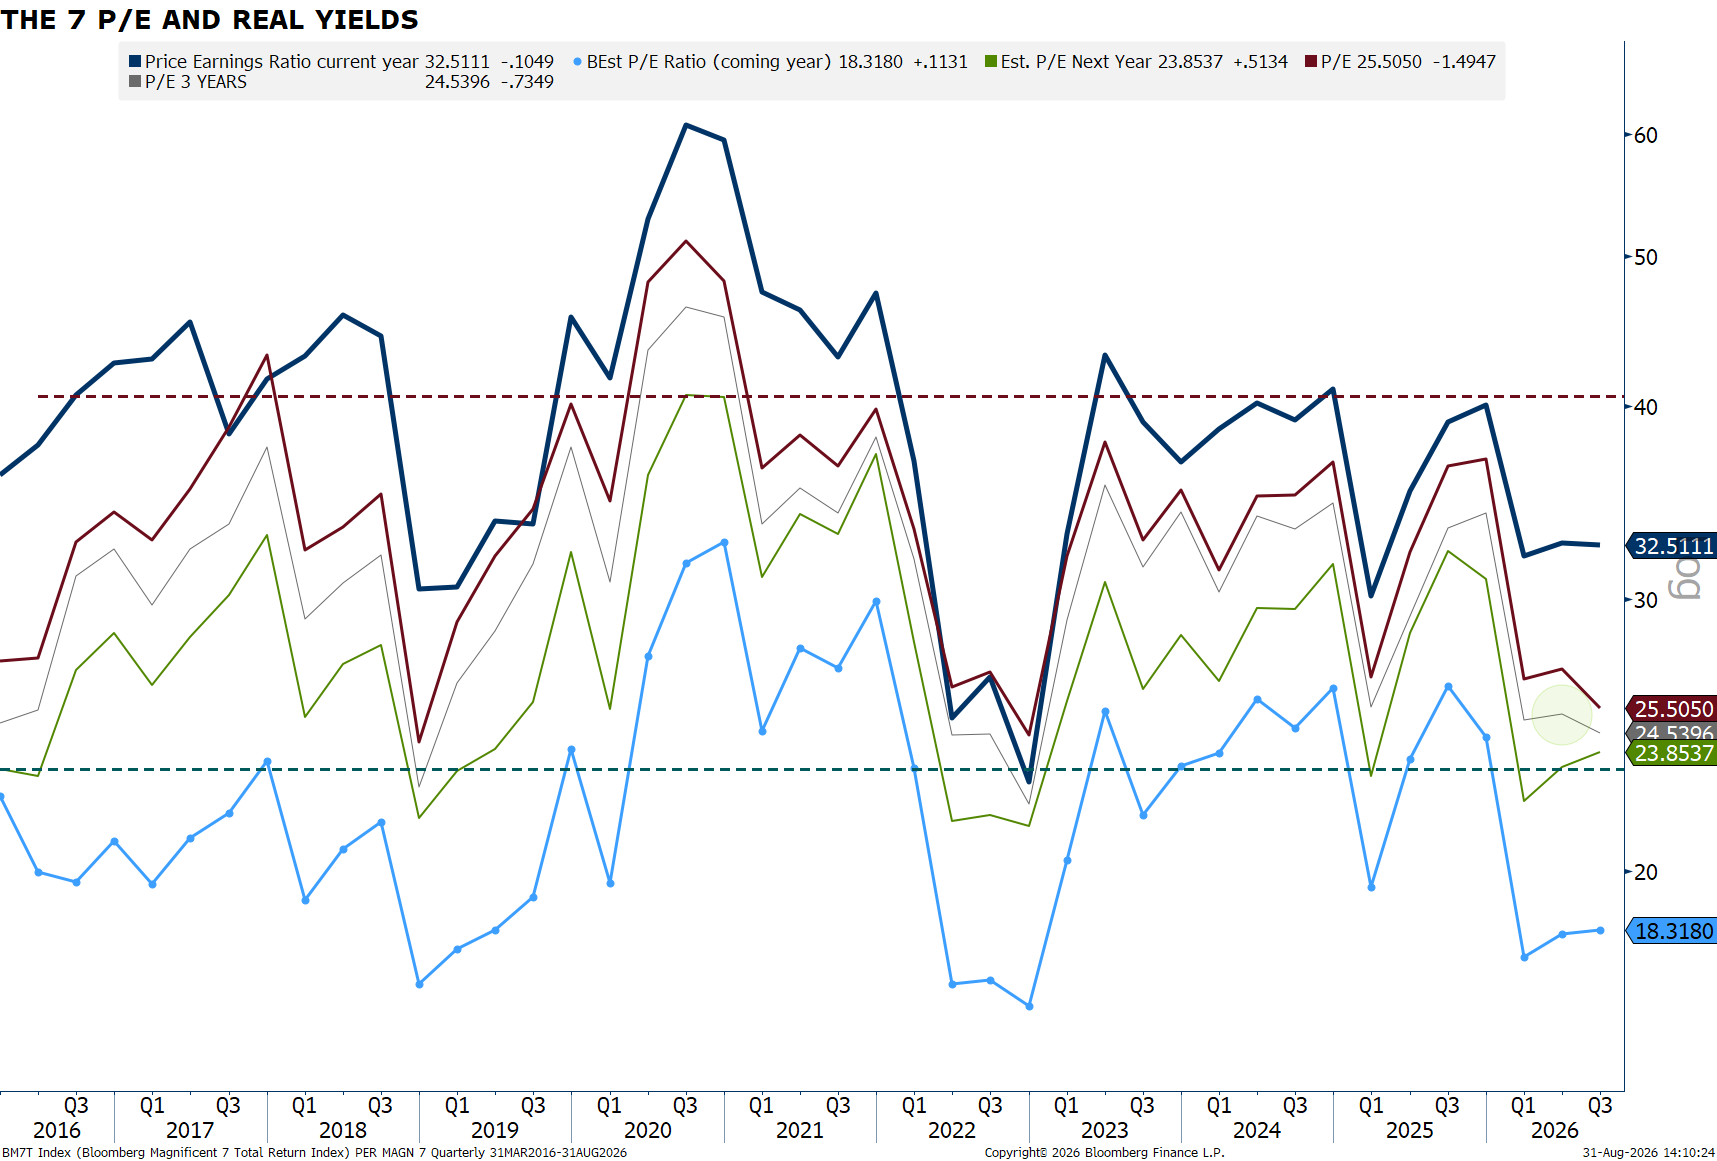
Early 2026, the S&P 500 traded for 22.43 times analysts’ expectations for earnings over the next 24 months, it is now at 19.4 despite a rise to 7580. For the Mag7, valuation is falling to the lowest levels at 21.43 next year:
More positively, The market isn’t as pricey below the megacap surface. The Invesco S&P 500 Equal Weight exchange-traded fund goes for 17 times earnings. The S&P SPDR Small Cap 600 ETF has a forward price/earnings ratio of 15. Both ETFs have trailed behind the S&P 500 for years but can help diversify exposure to the tech-heavy megacap index. Of course, valuation is useless if one does not incorporate expected future earnings.
3Q Earnings: Aggregate S&P 500 earnings growth is tracking well above consensus estimates this quarter, even adjusting for non-recurring “other income.” S&P 500 EPS growth is tracking 45% YoY in Q2 compared with a consensus estimate of 22% coming into the quarter. However, 19 pp of that growth is attributable to Alphabet and Amazon’s combined $151 billion of “other income” related to equity investments. Microsoft contributed an additional $3 billion of “other income.” Excluding these gains, S&P 500 EPS growth is tracking at 26%, an acceleration vs. Q1 and the fastest pace of growth since 2021. EPS growth for the median S&P 500 stock is tracking at 12% year/year, also exceeding consensus estimates, which pointed to 9% growth at the start of the season.
S&P 500 Q2 2026 EPS growth has accelerated, even adjusting for non-core sources of income…
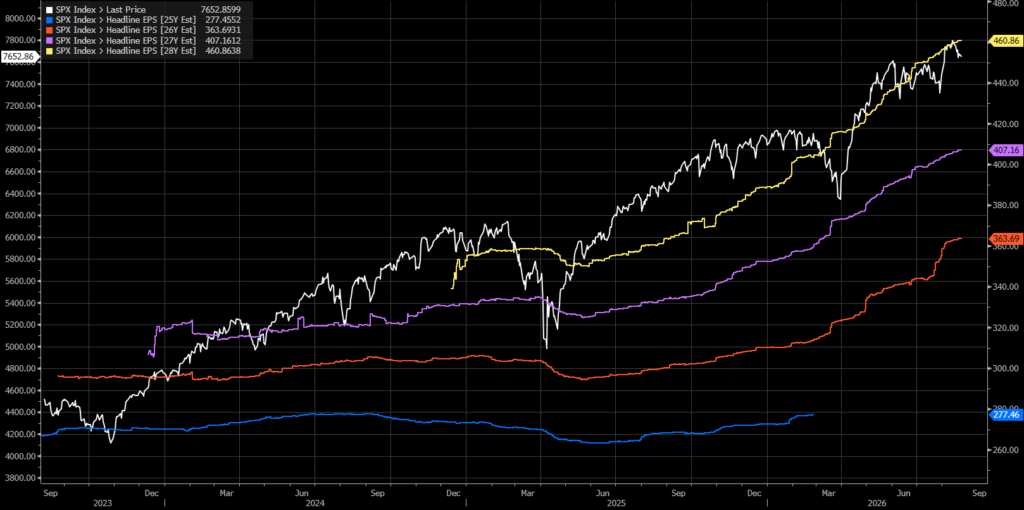
In addition to strong backward-looking results, Q2 reports have driven continued upward revisions to analyst 2027 earnings estimates. Since the start of Q3, consensus estimates for S&P 500 2027 EPS have been revised up by 1%, with the strongest revisions to Energy and Financials. Broad based upward revisions to 2027 earnings have been reflected in continued positive revision breadth across the S&P 500. Based on the below chart, S&P 500 EPS growth of +22.75% year/year in 2026 (to $351.54), +15% in 2027 (to $402.18), and +12.13% in 2028 to 454.06, thanks to solid US GDP Growth, weaker dollar, and continued earnings strength amongst technology stocks.
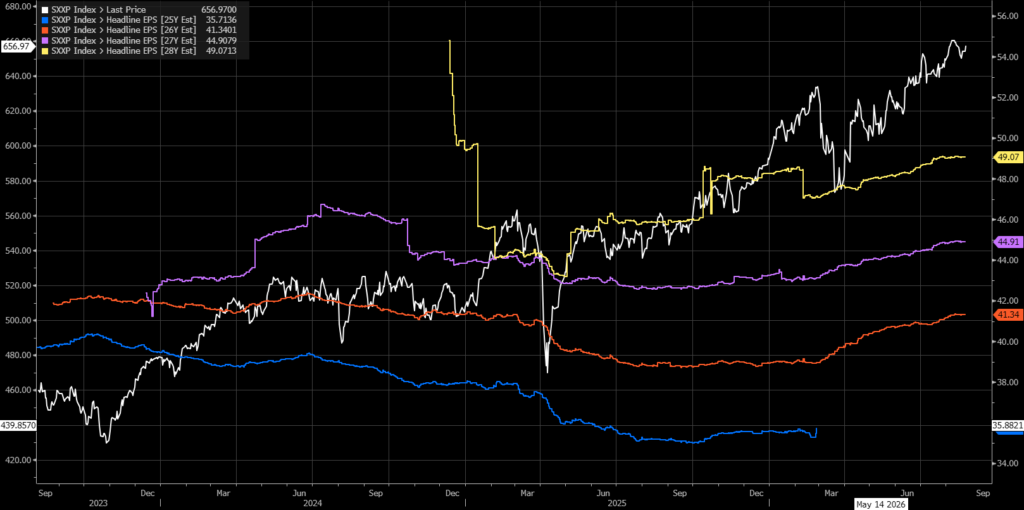
Globally, the landscape feels rather robust as well: with also strong earnings season in Europe. AdamS notes a +25% net skew to beats & +8% to guidance upgrades – above prior quarters, particularly for guidance. The earnings revisions ratio has moved into positive territory led by Semis, Energy and Div Fins. Median 1Q EPS growth +5.5%Y, up from +2.0% in 4Q , but of course lagging S&P 500’s +16%. On her management sentiment score change screen, Top Picks in the biggest improvers list include BASF, Talanx, Santander, ASML and Nokia. Indeed, after a soft start to Europe’s earnings season, things have improved. SXXP estimates have rebounded +12.6% YoY growth in 2026 to 40.79 +8.57% in 2027, and +9.02% for 2028.
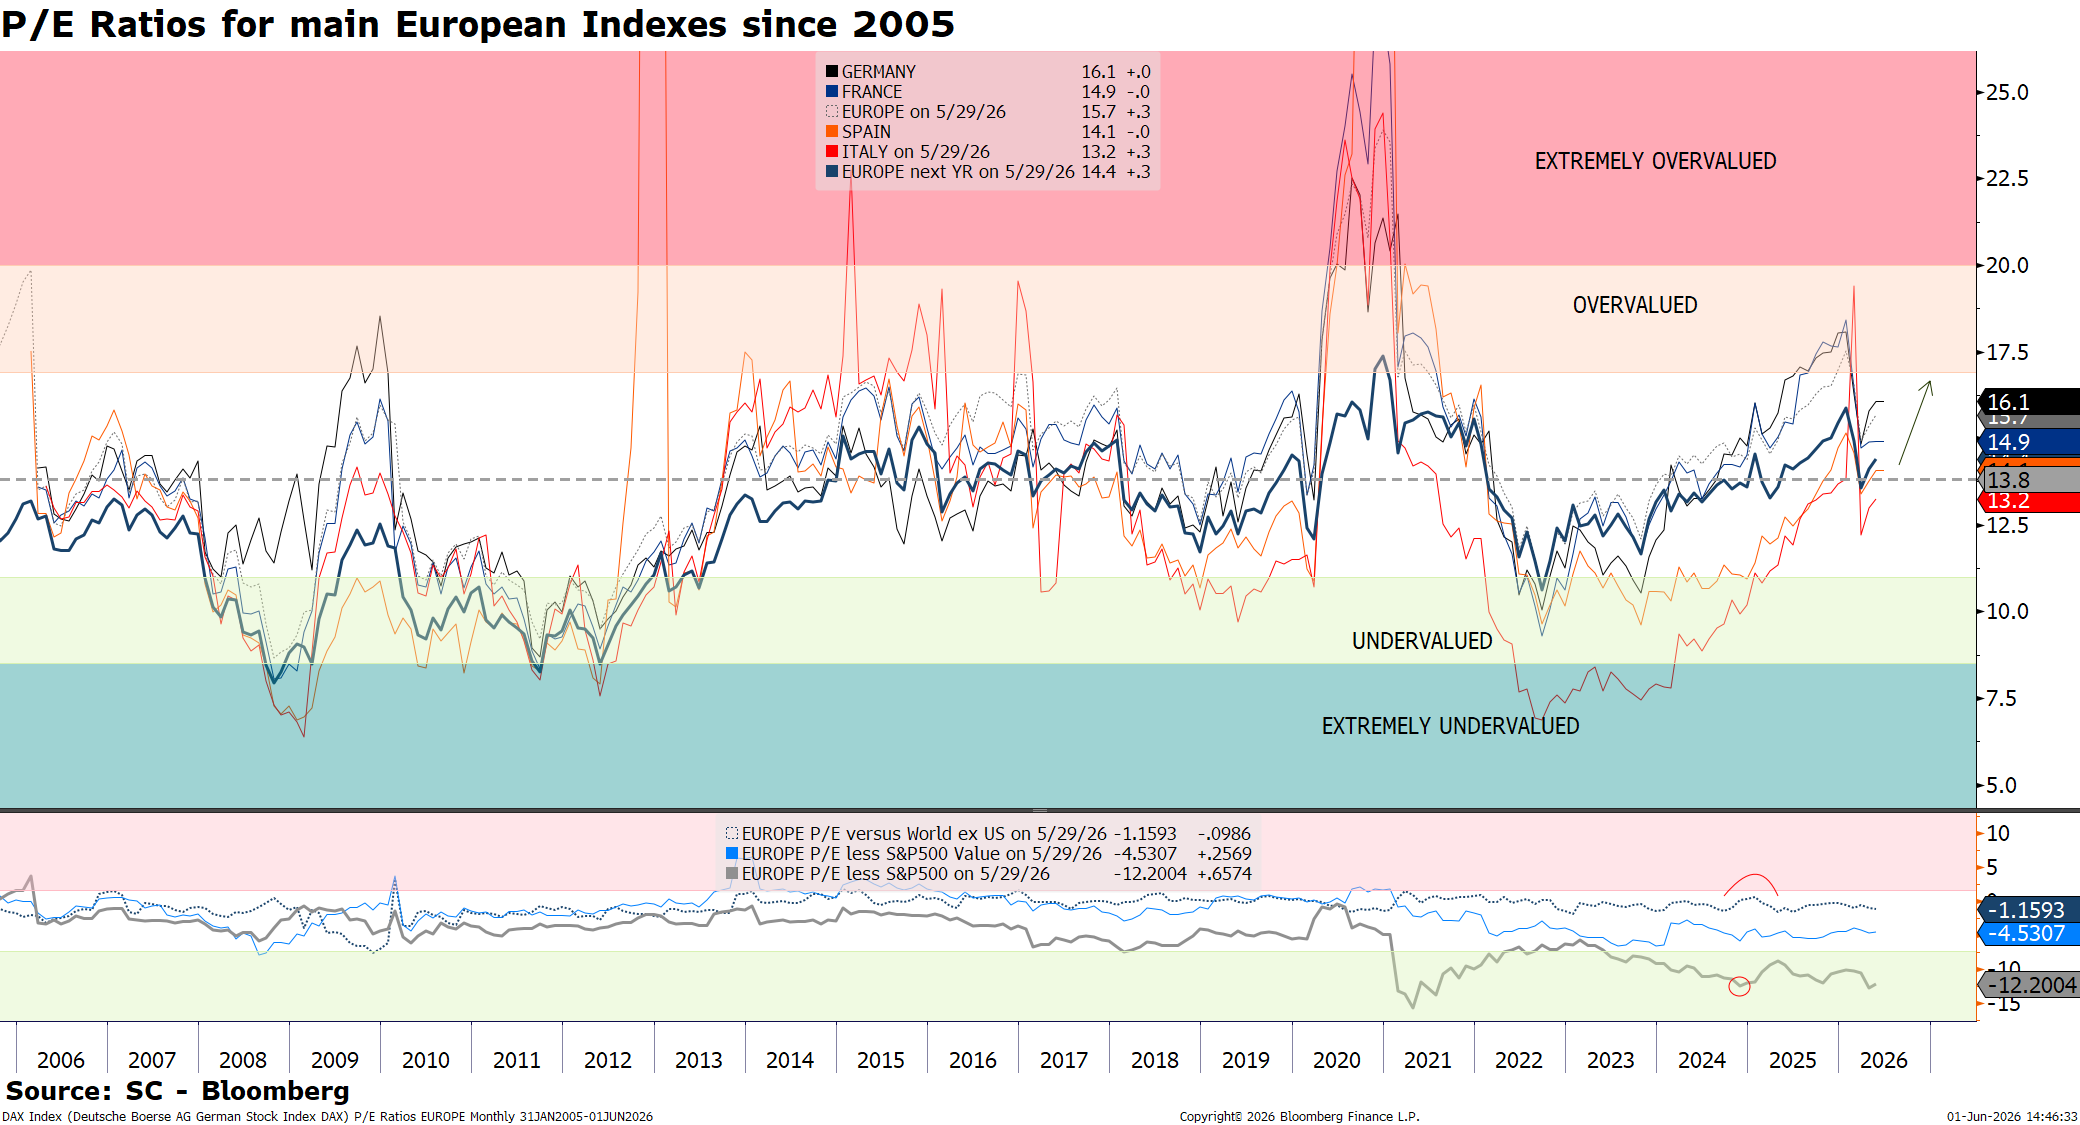
European valuations are much cheaper than US and global ones, and P/E for Germany and Europe have fallen from to 18.7 to 15.3 and from 17 to 16. The ratio of European valuation versus the world ones has rebounded. We added in the below chart the relative valuation of Europe versus the S&P500 in grey, the S&P500 value and the MSCI World excluding US stocks.
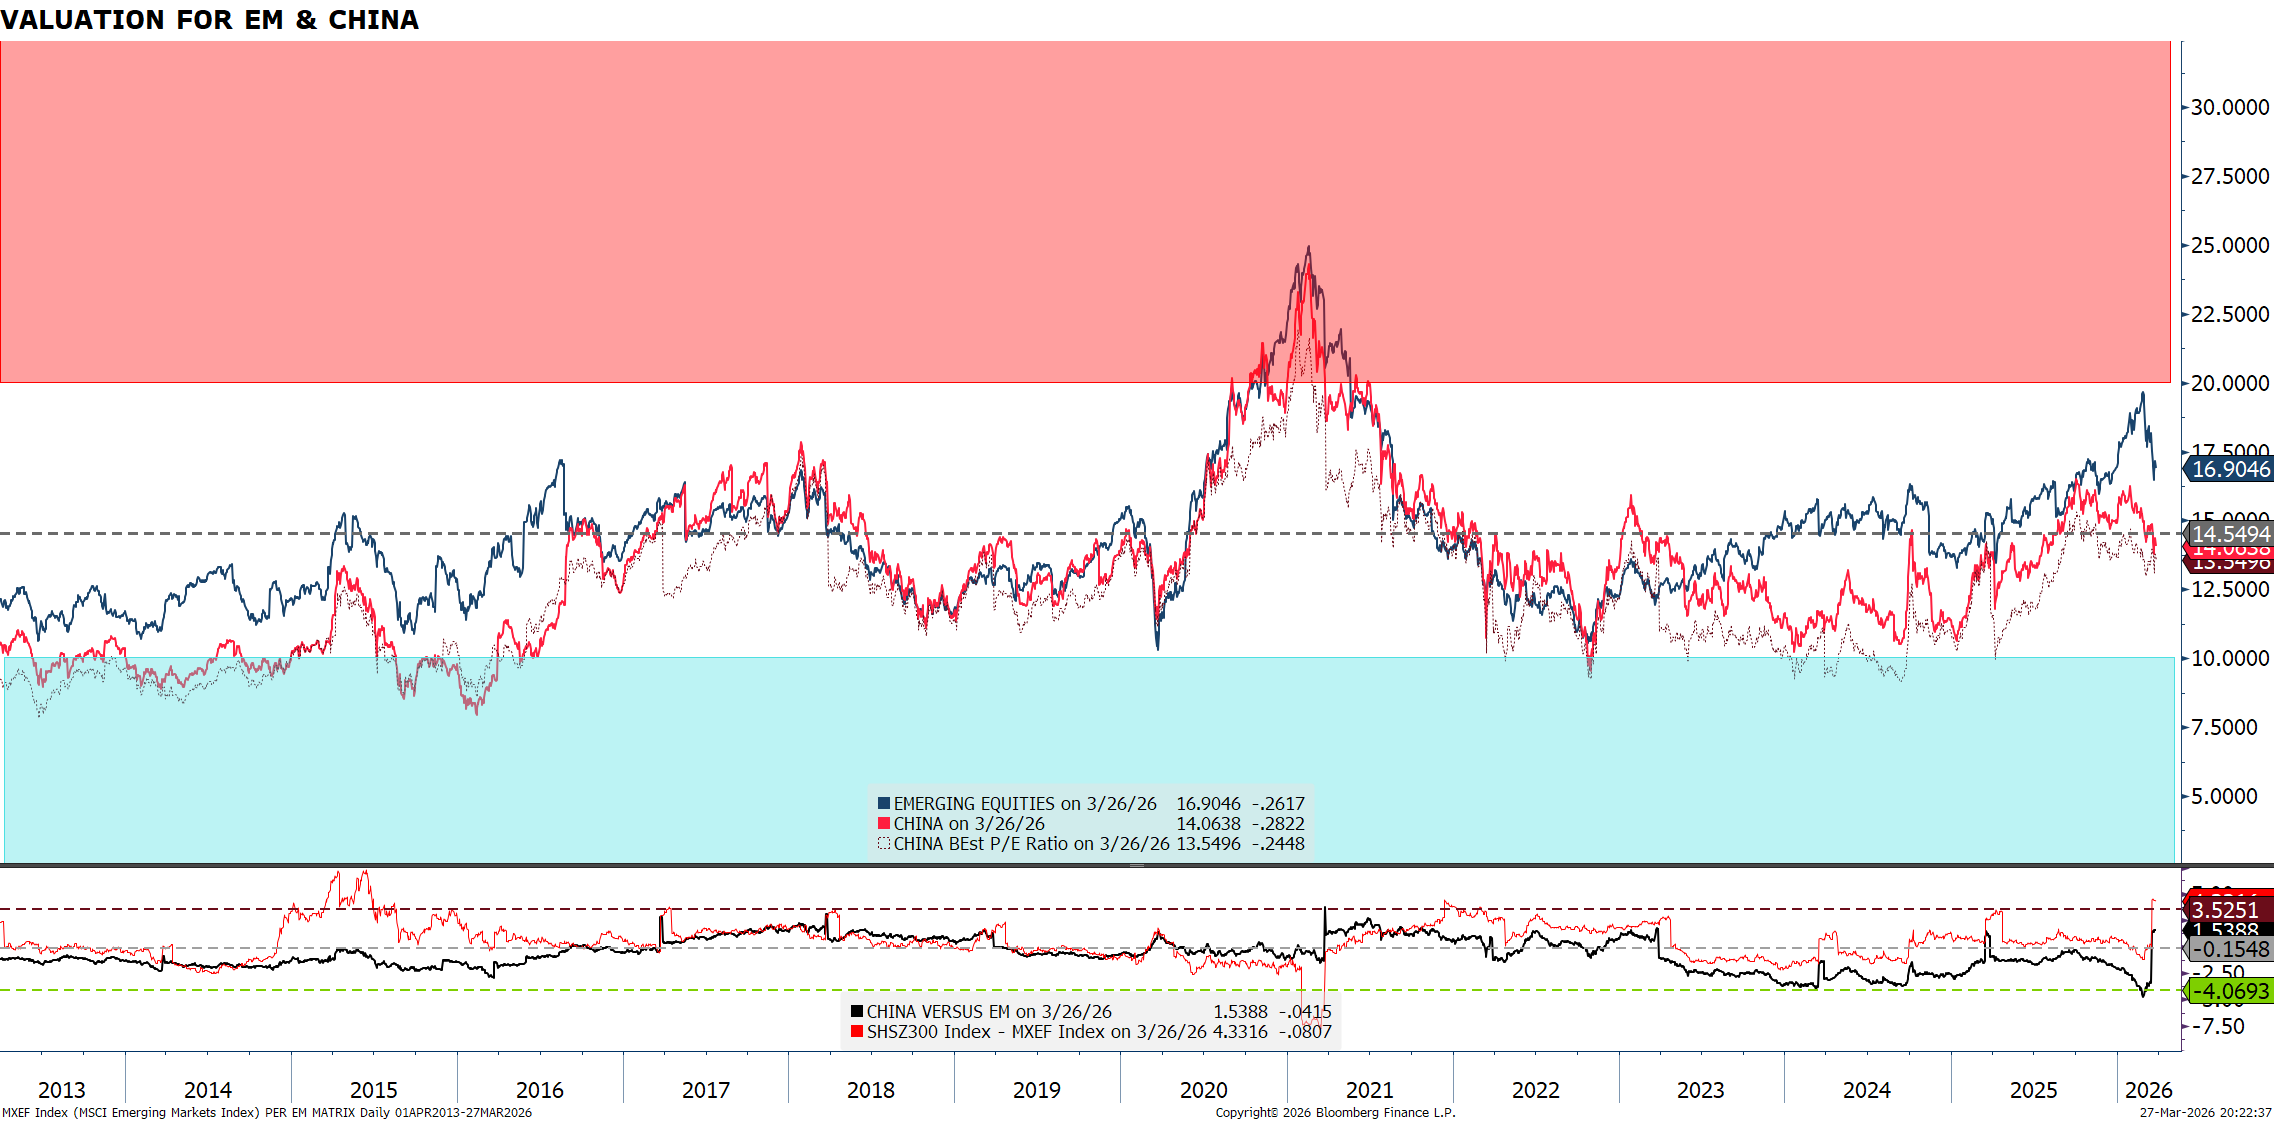
Emerging and Chinese markets valuations are rising above neutral:
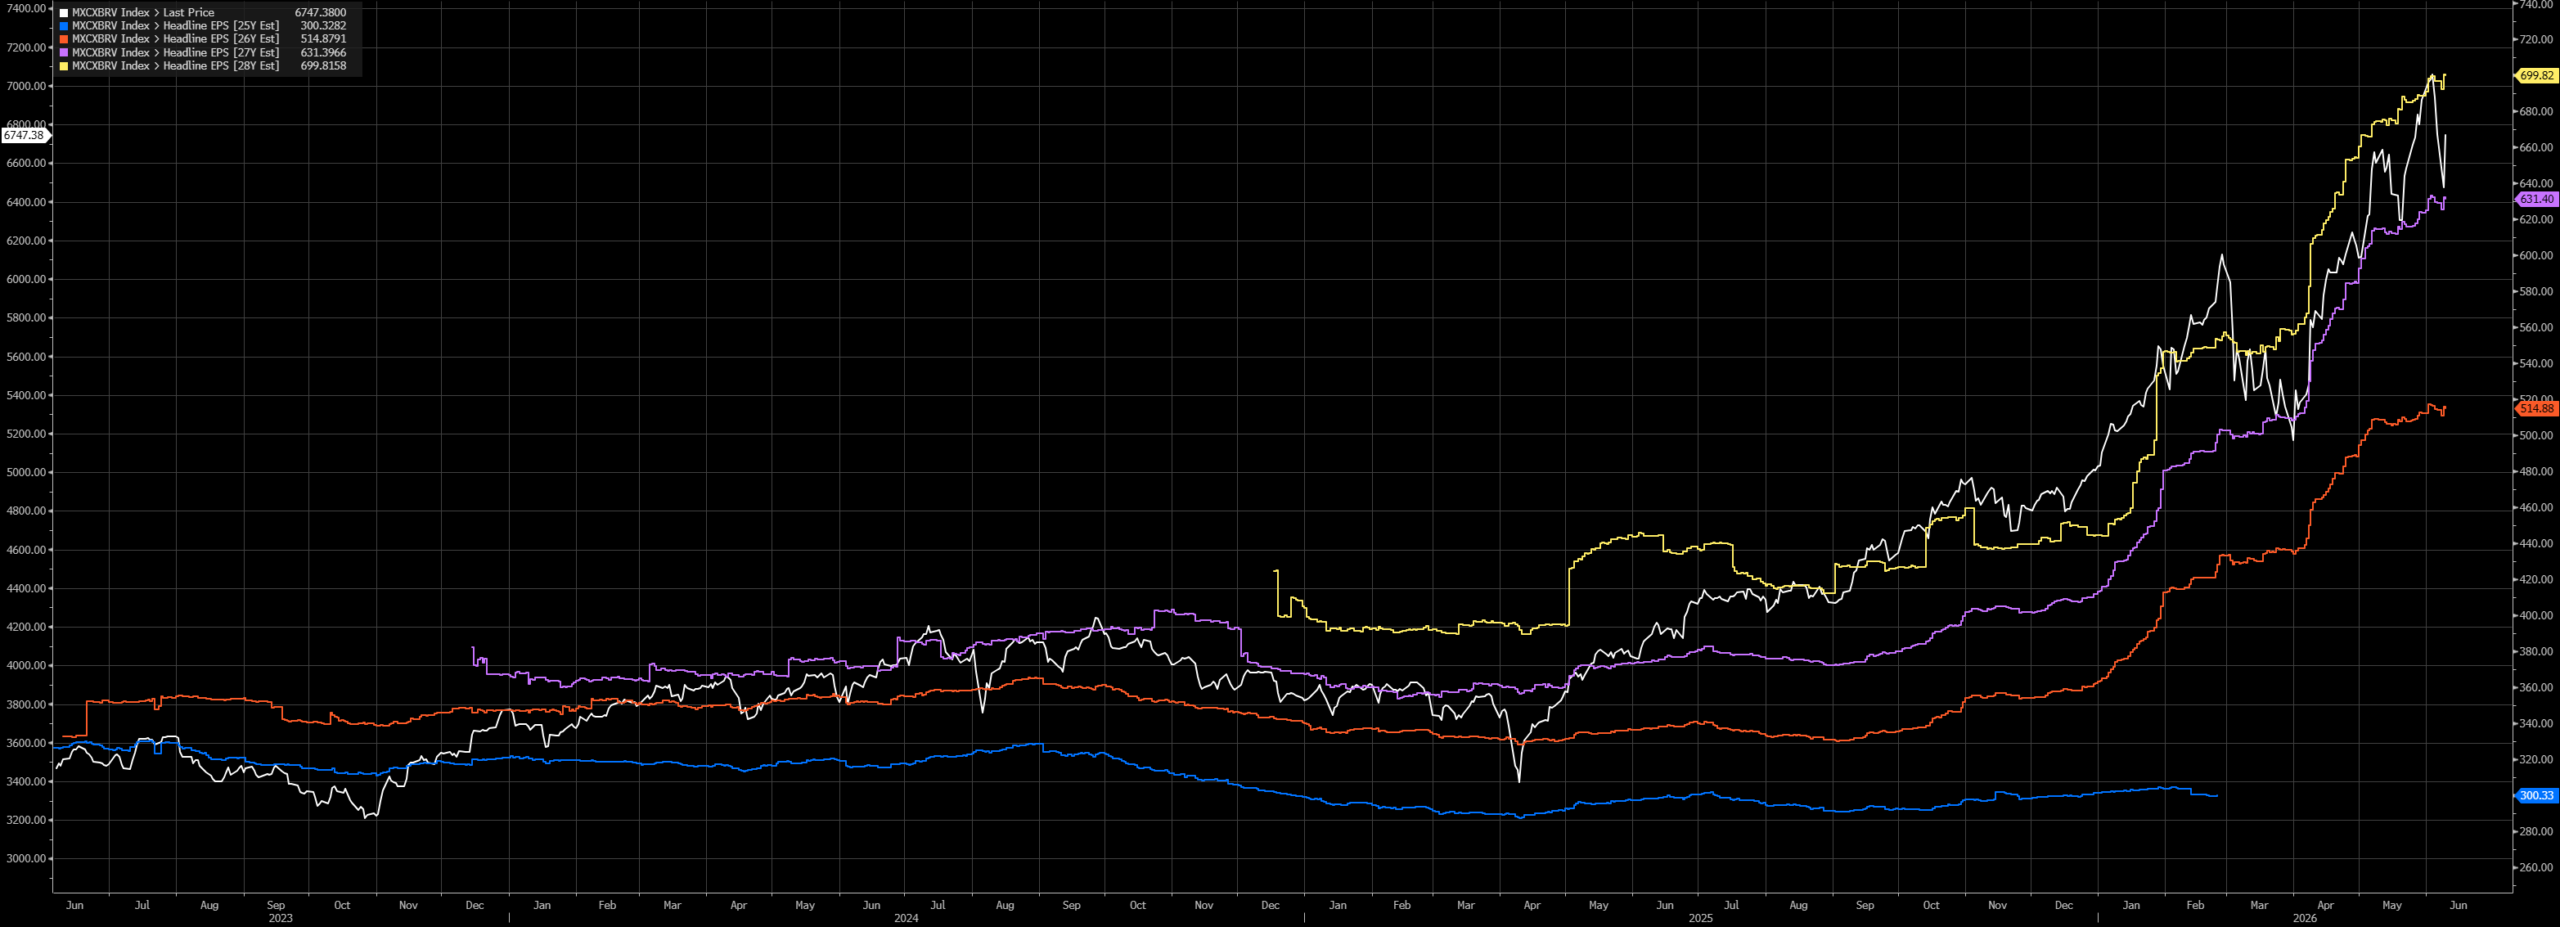
Earnings for Emerging equities ex China are exploding: +71.14% in 2026, +22.63% in 2027.
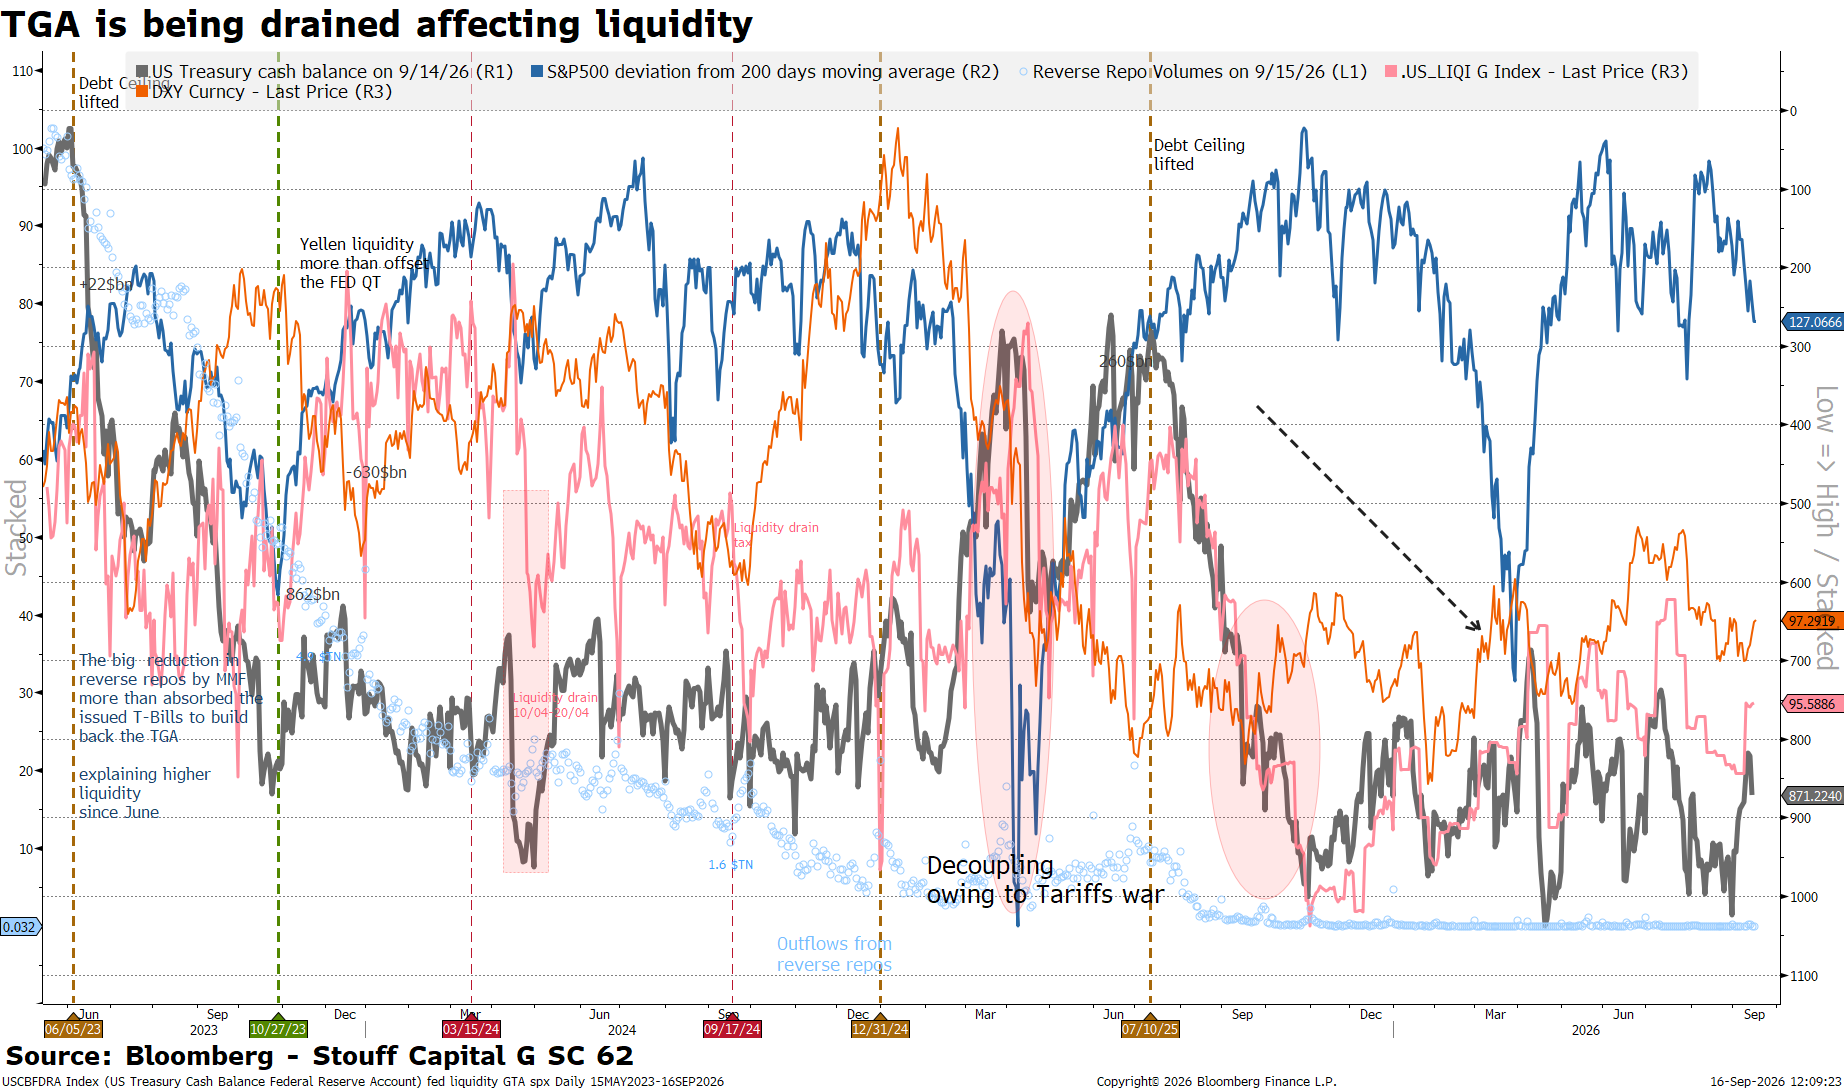
SECOND PILLAR OF MATRIX: LIQUIDITY is still strong
Update August 2026 – The Federal Reserve has cut the Fed Funds rate by an equivalent of 25 basis points in 2026 via its
$200bn+ balance sheet expansion since December. This balance sheet expansion was enacted not to help the Fed with its twin mandates for inflation and employment, but to ensure enough liquidity in the financial system. Most of the Fed members pushing for a higher Fed Funds rate support the balance sheet expansion and don’t believe balance sheet expansion increases inflation. Warsh seems to have a different view. Warsh’s opening statement last week specifically noted that the FOMC
discussed how much accommodation is coming from the balance sheet. Warsh is likely arguing behind closed doors that it’s contradictory to push for rate increases to stamp out inflation when the balance sheet is increasing. Still, cutting the balance sheet is not easy. Warsh’s point is that the balance sheet is asymmetrical, easy to expand for stimulus, but nearly impossible to remove the accommodation. Our sense is that Warsh’s balance sheet task force will recommend using financial deregulation to sterilize the negative impact of draining liquidity via the balance sheet. But Warsh needs to act before then given the pressure building among Fed members and the lack of resolution in Iran. The first part of that plan may show up this week at Treasury’s Quarterly Refunding if Treasury enacts its plan to invest a portion of its General Account (TGA) into the repo market. If enacted, Treasury will inject up to $200bn of reserves into the banking system, giving Warsh the cushion to remove the Fed’s year-to-date balance sheet expansion, which, as noted above, is the equivalent of a 25-basis point rate increase. We also believe this creates space to wind down the Fed’s $10bn of Reserve Management Purchases (RMP). The net effect is a more neutral balance
sheet policy that begins the process of tightening without raising the Fed Funds rate.
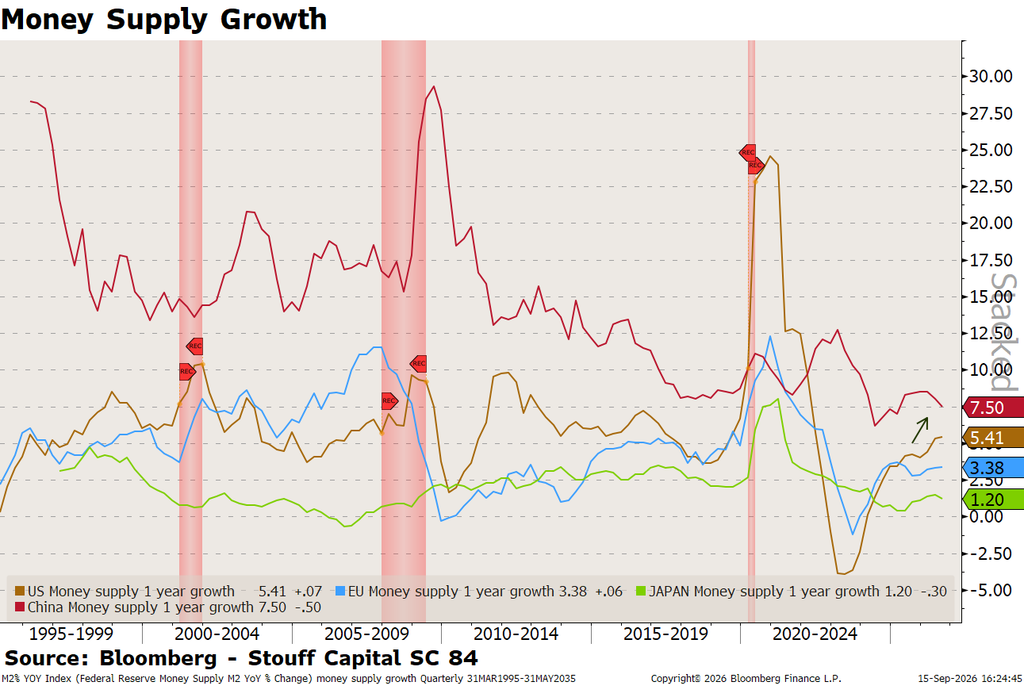
One pillar of Liquidity: Money growth. The chart below shows yoy US Money supply growth rising from 4.7 to +5.41% in the last weeks. Europe yoy Money supply is positive at +3.38, but slightly decelerating. Chinese Money supply growth seems to have bottomed and stands at 8.6%. Last but not least, Japanese Money Supply has stopped its declining yoy growth at 0 and is rebounding to +1.7%.
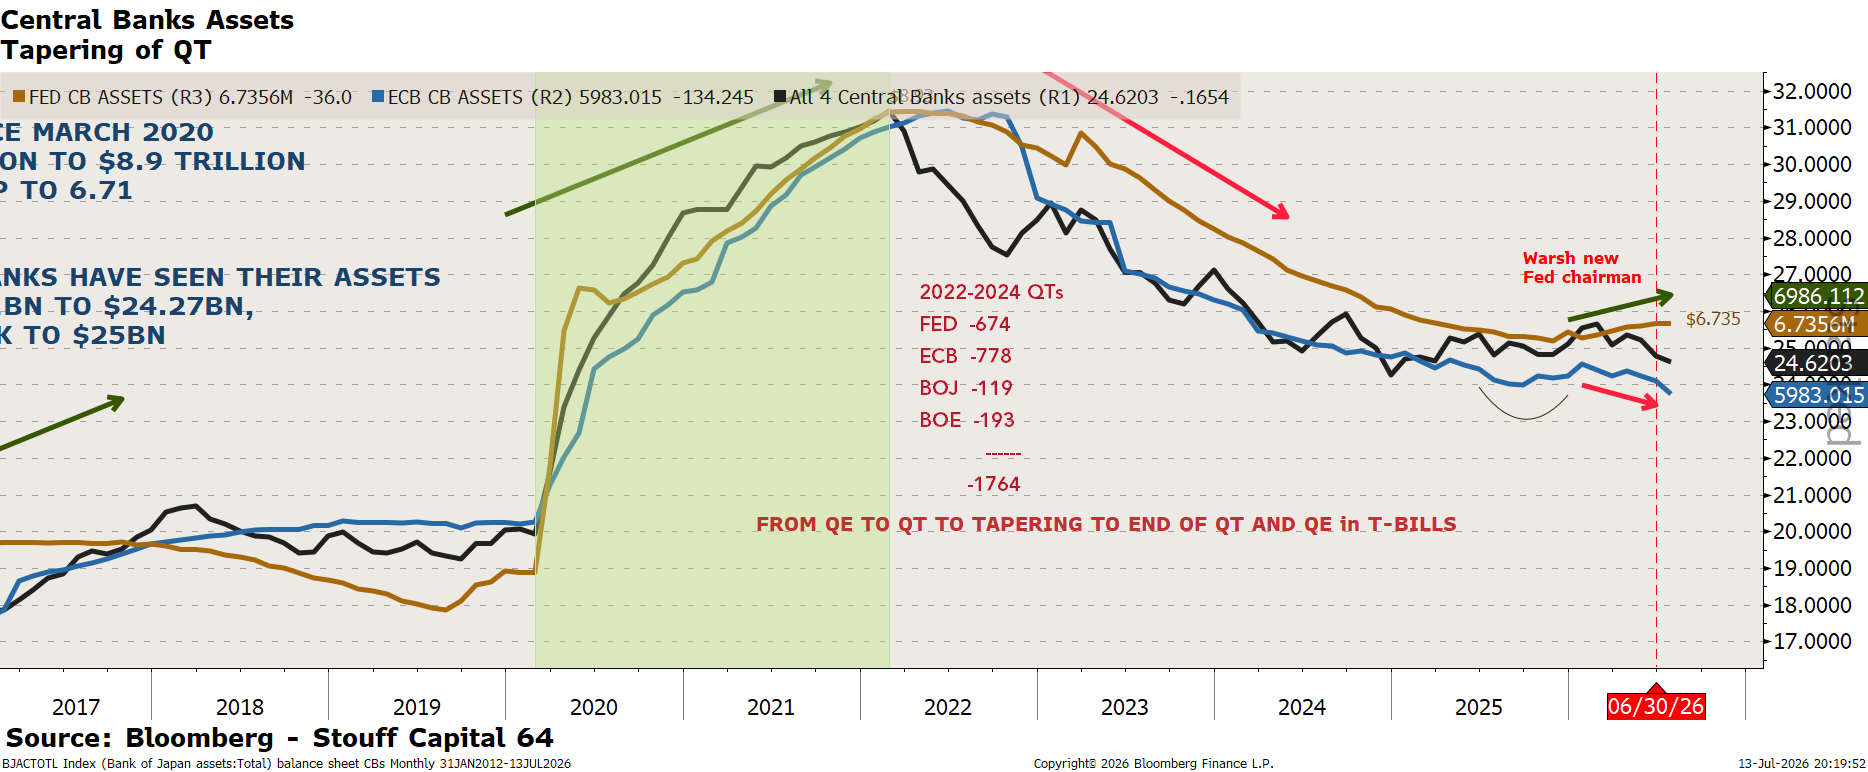
Another pillar of Liquidity – Central banks assets. The FED and the ECB are no longery reducing their balance sheets. The chart below shows that Fed assets stopped falling at a floor of 6.55Tn$ and back to 6.735: this is reversing a proxy of our Liquidity grade from negative to neutral, as we rank the last 3 months changes in CB assets as much as 3yr and 1yr change. The Fed increased its balance sheet by a net $200bn since December. Coupled with GSE purchases of MBS, the combined effect is the equivalent of one Fed rate cut this year. Warsh understands this. But we are perplexed that the hawks calling for more rate increases are also the Fed members most opposed to reducing the balance sheet. These members’ policies are contradictory and the net result of favoring rates over the balance sheet is a bias for private equity and against housing.. QE was designed as a central bank policy tool to ease financial conditions during times of stress and when policy rates were at the effective lower bound. Central banks were trying to signal a commitment to ease, stimulate borrowing, boost credit supply, and lower longer-term rates.
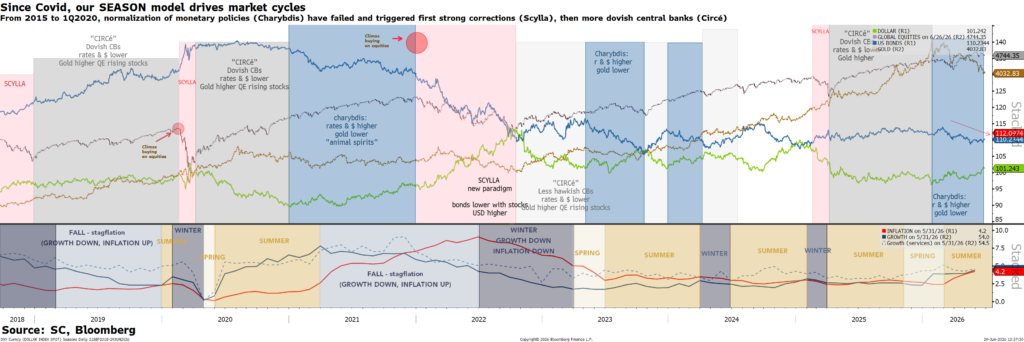
Yield curves are the third pillar of our Monetary grade – and it has been getting better. They are no more inverted. We must mention the following chart, that is not impacting our Matrix. But is is worrying: Global liquidty is not justifying global equities rise.
THIRD PILLAR OF MATRIX: ECONOMICS – US & EU flip to Spring, Goldilocks (growth ↑, inflation ↓).
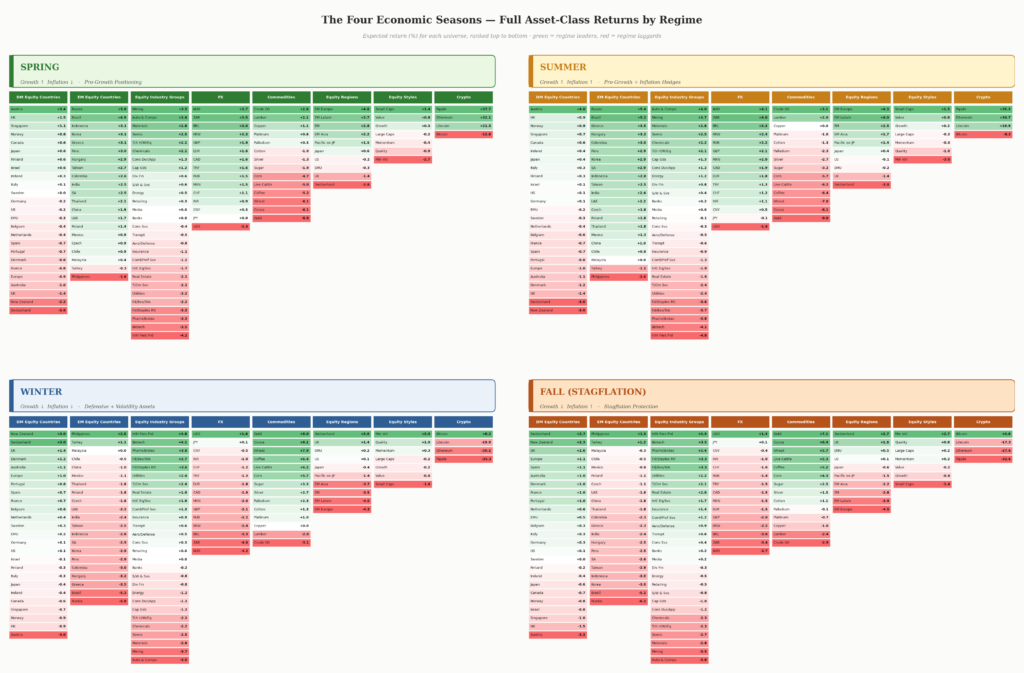
Markets follow patterns based on economic regimes. Those regimes are defined by two things: whether inflation and economic growth are accelerating or decelerating. Spring (top-left) — fresh greens + blossom, Growth ↑ / Inflation ↓ Summer (top-right) — warm golds + sun, Growth ↑ / Inflation ↑ Autumn (bottom-right) — amber + falling leaf, Growth ↓ / Inflation ↑ Winter (bottom-left) — cool blues + snowflake, Growth ↓ / Inflation ↓
In July, Winter in China pressures cyclical assets early in the regime, but markets usually begin discounting the next season well before Winter ends. Several of our signals suggest that transition may now be underway. USD – One of our key indicators for identifying when the worst of Winter is behind. End of July marks consecutive days of lower highs within its fractal dimension, prompting us to: reduce our USD long exposure to a minimum, scale back shorts in commodities and emerging markets. On our trading horizon, the S&P 500 currently exhibits a strong inverse correlation (-0.81) with the US Dollar. Technology / High Beta – June and early July clearly reflected a classic Winter volatility episode. However, short-term conditions are improving:
- High-beta momentum has reached oversold levels,
- Nasdaq volatility remained contained, with the VXN staying below 28,
- our Nasdaq Composite Risk Range™ has generated its first higher low in over a month, mirroring the deterioration in the USD trend.
These signals led us to cover our Magnificent Seven short exposure.
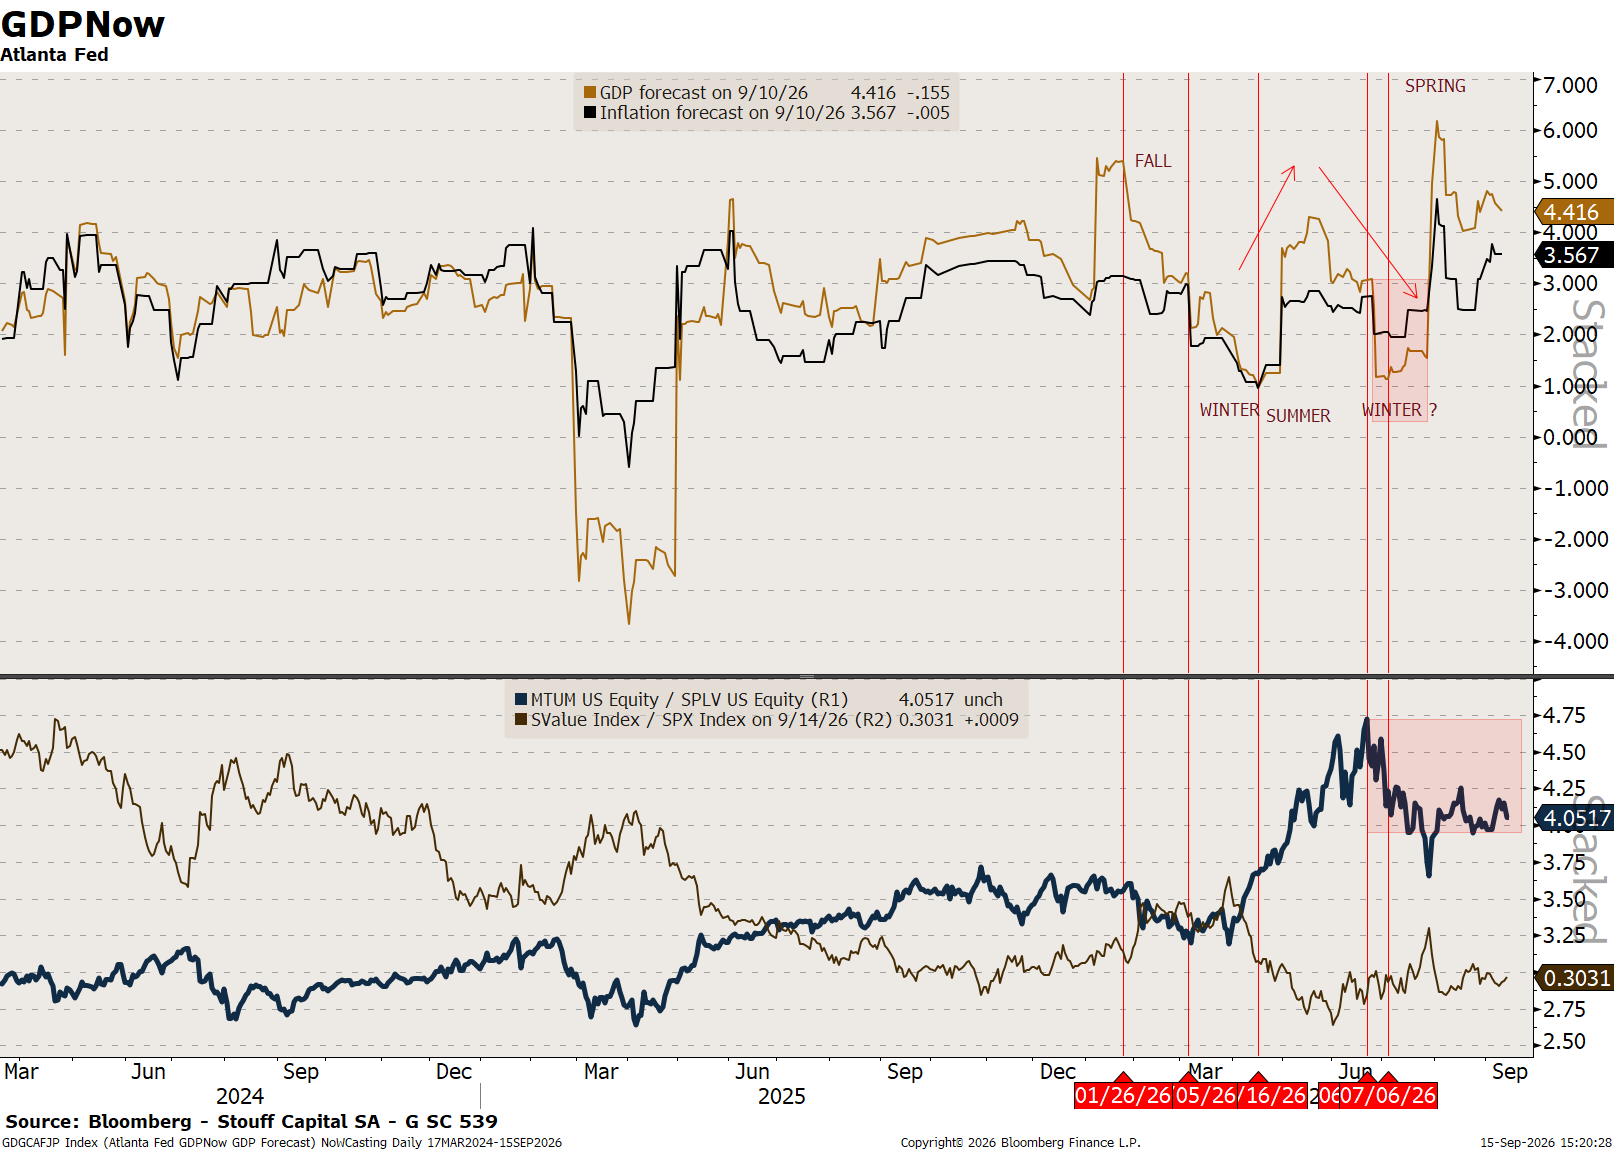
AdamS March US economic analysis on May25th: “The machine is running hot again. Last week’s data confirmed what markets are only beginning to grasp: we are living through a deliberate policy regime of shock-and-awe stimulus. “Core” retail sales surged, industrial production accelerated, and the Atlanta Fed’s GDPNow model is already pointing toward a a strong 3.3% growth print for Q2 (see above). Tax refunds are flooding the consumer, while 100% expensing is igniting a new capex cycle. The result is an economy moving with the velocity of late cycle exuberance — yet still framed as recovery.”
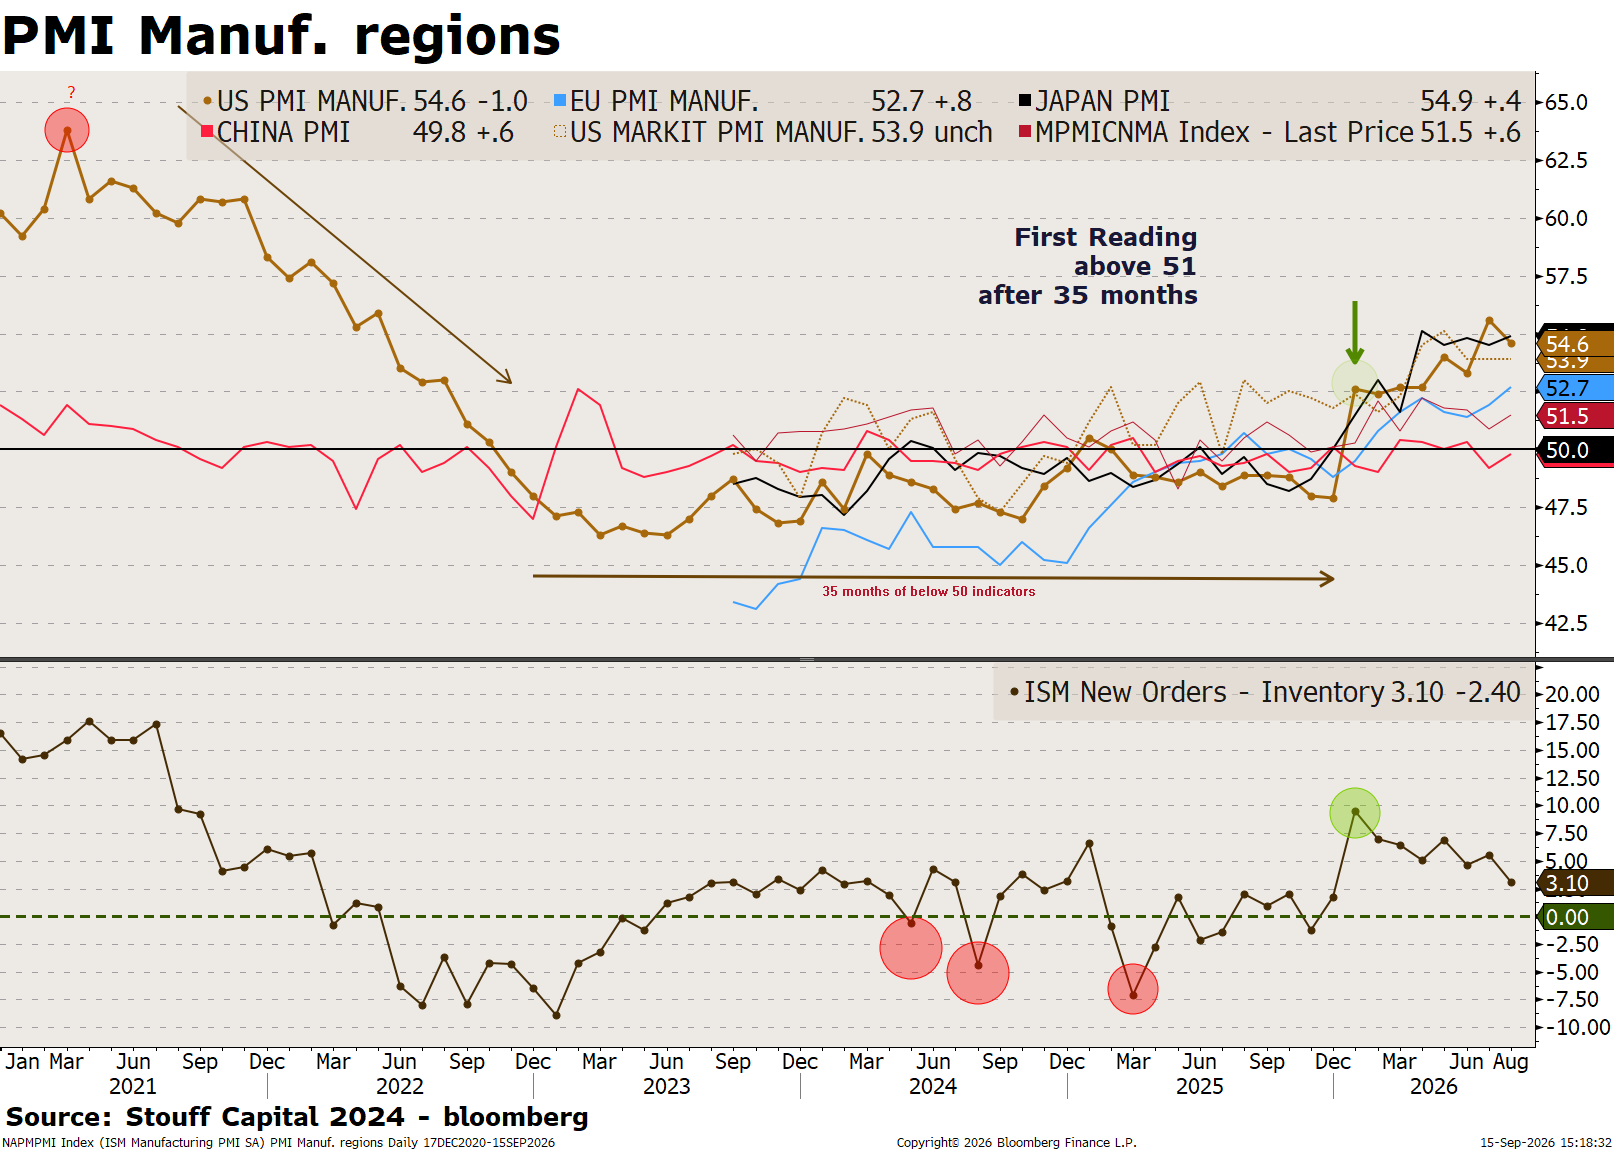
US Macro Update: Manufacturing & Services PMIs Turning down
The US economic surprise index is within a whisker of a 2Y+ high and the Atlanta Fed’s GDPNow series is still tracking above 4%. We have a big week coming up for macro data, where it may be a question of be careful of what you wish for, given that the correlation between bond yields and equities is about as negative as it gets. However, we would note that while the level of yields clearly matters, arguably bond volatility matters more, and the current level of the MOVE index does point to some modest headroom for equity valuations. A distribution of PMI readings since 1950 reveals an interesting outcome – forward S&P returns suffer from the top decile (PMIs of roughly 60 or greater). A 6th decile PMI reading (where we are today) suggests there’s some time.
US Markit manufacturing PMI is very good at 55.3 and PMI at 52.7, services PMI is rebounding to 50.9. Our lead indicator—ISM new orders minus inventories—has rebounded above 0 at +5.1, now pointing to bullish ISM prints in the coming months. Together with Nowcast GDP trends, both PMIs could suggest our Economic Kairos model to move to the “Summer” phase in the USA.
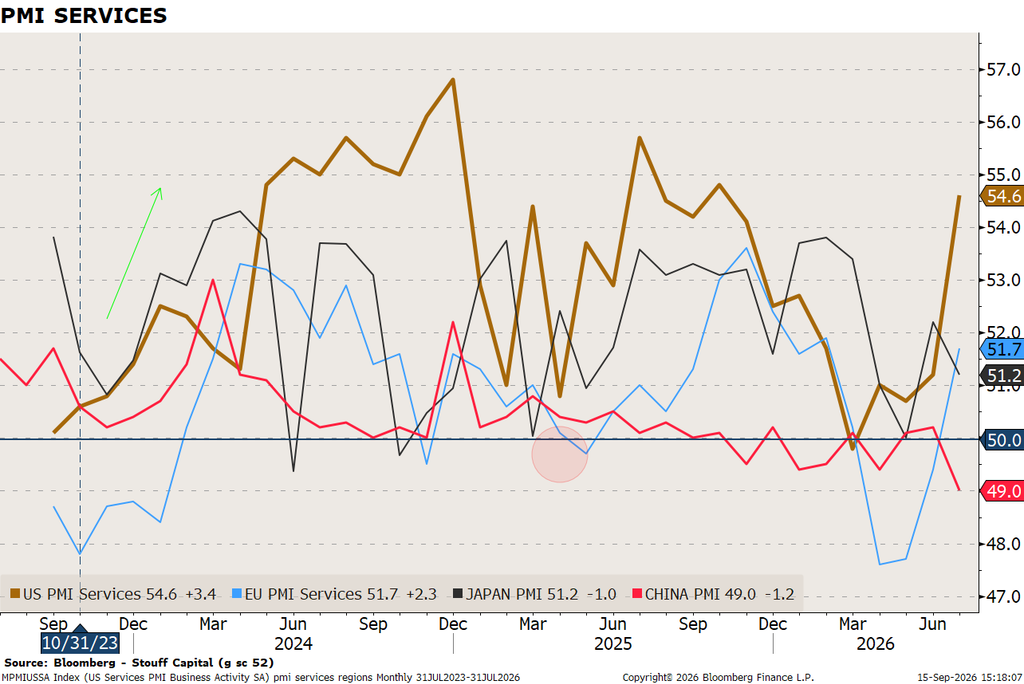
The U.S. economic surprise index has rebounded all the way up to +46.7 (slightly lower in the last days). To the contrary Europe had totally collapsed to -67.4, but with China they are both reversing from those depressed levels. Indeed, in the Eurozone, weakening survey activity signals alongside renewed energy-driven cost pressures have kept the macro backdrop fragile. Then the ECB delivered a 25bp rate hike to 2.25% policy rate, with updated projections showed a weaker growth outlook alongside higher inflation, with core inflation revised up to 2.5% in both 2026 and 2027 and risks still skewed to the upside, particularly given the persistence of the energy shock and its broader impact on prices. At this juncture, AdamS our AI-economist expects one more hike of 25bps in September, though July is seen as a possibility should there be evidence of inflation passthrough and renewed energy price spikes.
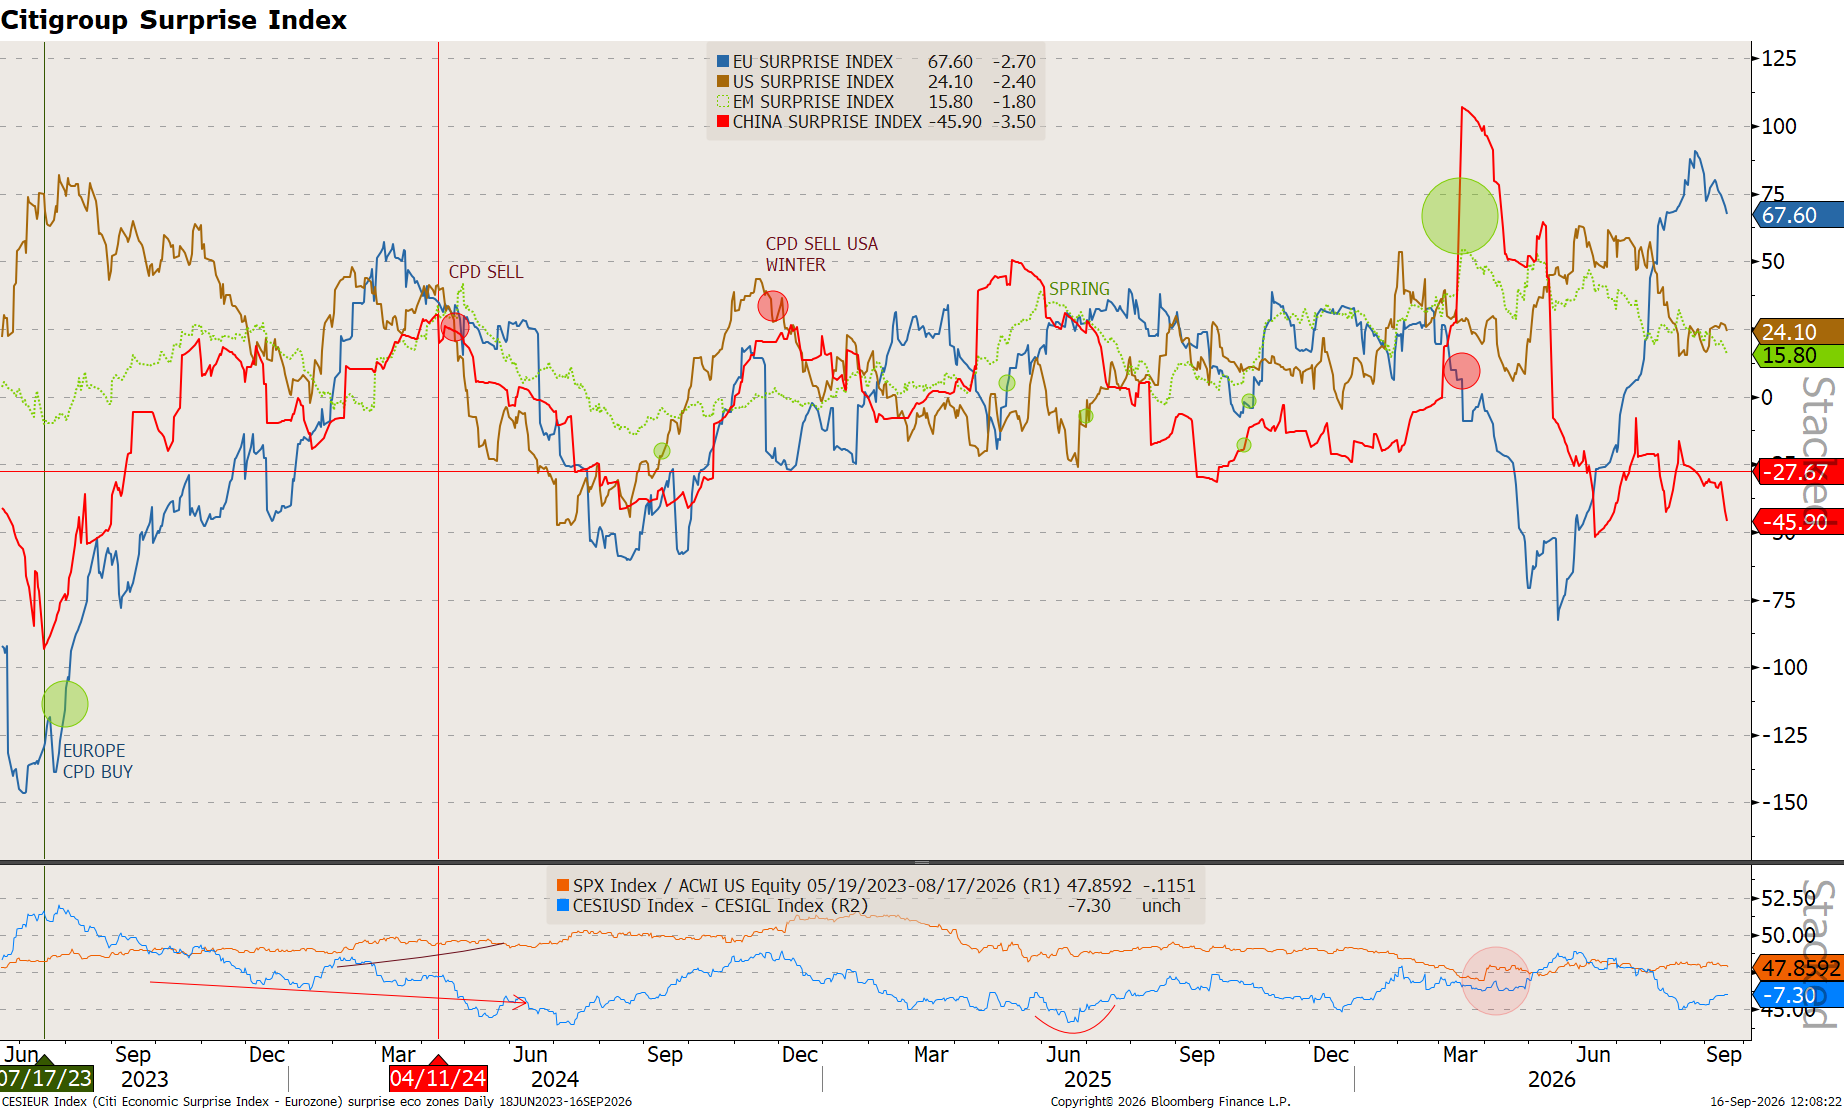
In Japan, while soft indicators such as consumer confidence have deteriorated, hard data have remained solid, suggesting no meaningful slowdown in activity despite elevated energy prices and geopolitical uncertainty. On the inflation side, the corporate goods prices index continued to rise, increasing +0.9% m/m in May and accelerating to +6.3% y/y, reflecting persistent upstream price pressures, particularly from energy-related components. Although the pace of increase moderated from April, the level remains elevated and is expected to feed through into consumer prices over time. In markets, this has resulted in a meaningful hawkish repricing, with June BOJ implying around a 95% probability of a hike. Looking ahead to next week, focus will turn to the BOJ meeting, where a rate hike is expected alongside potential adjustments to forward guidance to maintain a hawkish stance while signalling policy is approaching neutral.
The RatingDog Chinas services purchasing managers’ index (dark red line) rose to 51.4 from 50.4 in July, putting it well above the 50 mark separating expansion from contraction.
LAST PILLAR OF MATRIX: SENTIMENT is contrarian bullish short term
The medium term sentiment indicator, the Smart/ Dumb index, a composite that measures more real-money indicators like put/call ratios, mutual fund flows, and futures traders’ positioning, reboundeded to a one-year high and a reading of 264%, suggesting a lot of optimism. Similar sentiment resets tended to result in a pause/ correction in the S&P 500 over a medium-term basis. Such optimism can act as a contrarian indicator, as too much optimism/ greed among investors frequently sets the stage for a correction. Below we present this list of indicators composing our aggregate sentiment indicators:
As markets remain nervous around the moves in oil, bond yields and the prospect of Fed rate hikes, equity market sentiment already looks pretty subdued. The MS Global Risk Demand Index last week hit a ‘Fear’ signal and still hovers around that level. 64% of global stocks have de-rated YTD – in the last 20Y just 5Y have seen more stocks de-rate and 4 out of 5 of those have seen equity markets down double-digit.
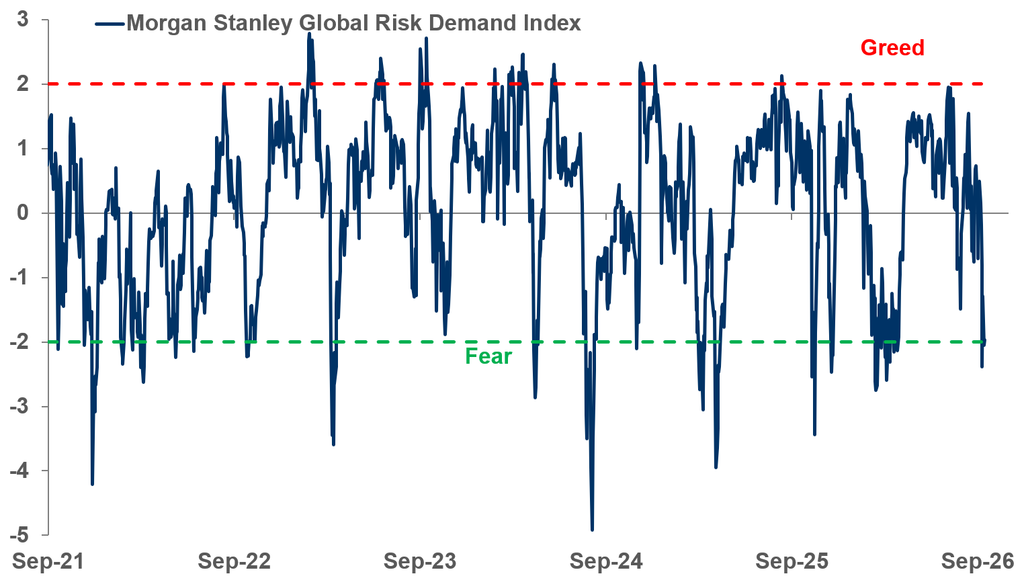
Our SC US sentiment Indicator is switching to contrarian bullish for the short run, and the medium run Smart & Dumb indicator is moving from an oversold status to a neutral one. Please click below for the review of this proprietary Sentiment tool:
Update — May 28th: The SC US sentiment indicator has a grade of 47%, which is, from a contrarian point of view neutral for the short run:

VIX Model:
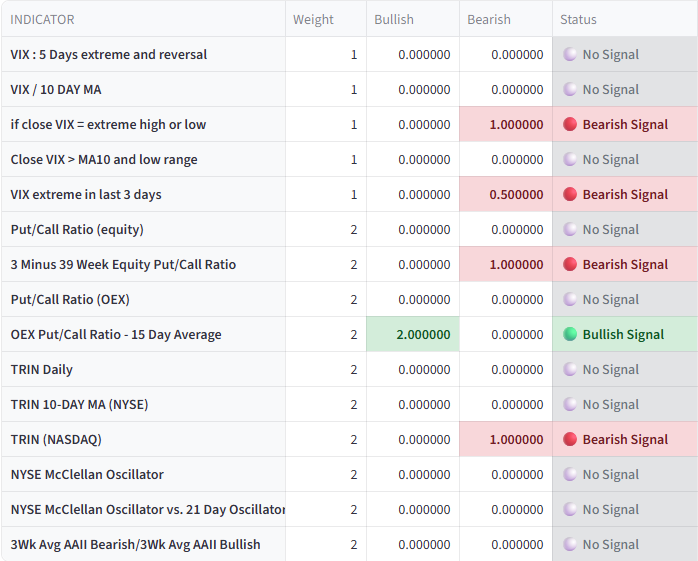
- Turned bearish, yesterday VIX closed at 16.29 lowest close since February. VIX model is contrarian therefore it is a bearish signal.
- Only the extreme 3 days model turned bearish VIX only lowered since May 18th.
Put/Call Model:
- OEX Put/Call Ratio (15-Day Average): Turned Bullish.
Breadth Model:
- TRIN (NYSE): Still Neutral.
- TRIN (NASDAQ): Bearish underlying the concentration in tech and semi.
- 3-Week Avg AAII Bearish / 3-Week Avg AAII Bullish: Remains Neutral.
Breadth Model: AAII Bullish Model is bearish
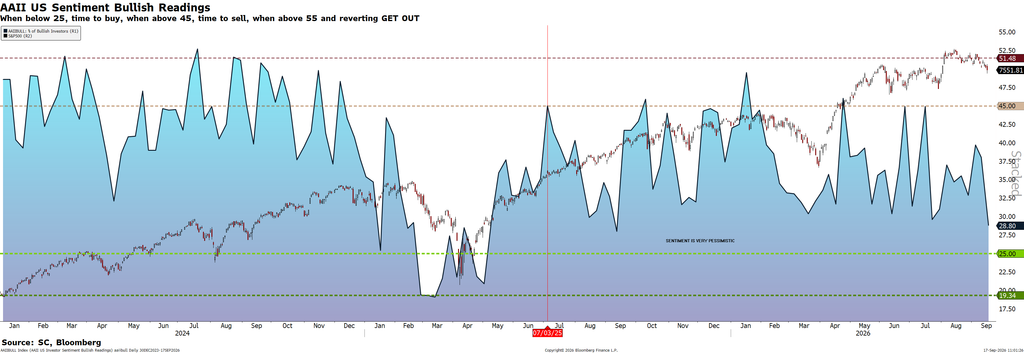
Chart: SC US Sentiment indicator – Sentiment is too pessimistic
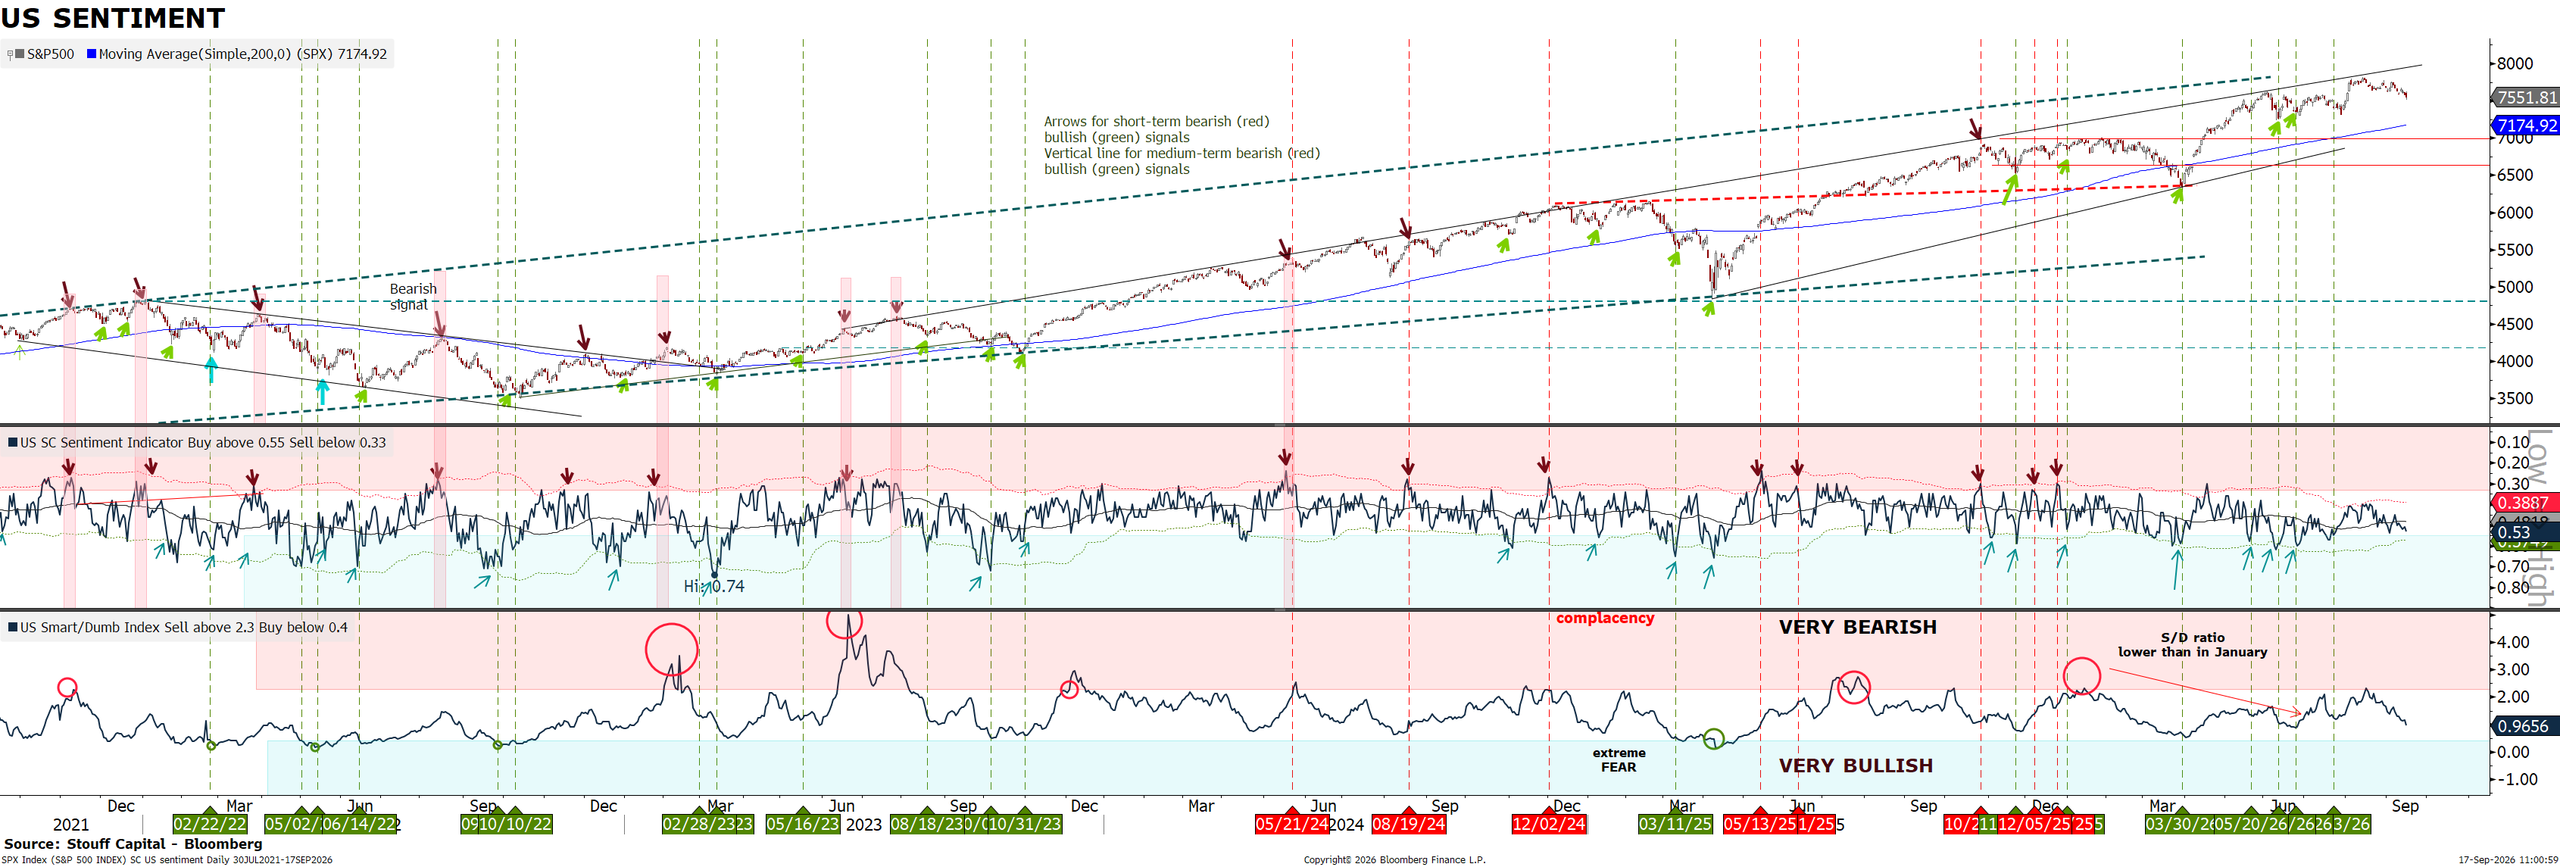
Chart: Mag7 Sentiment indicator is pessimistic
We also check discretionary items to assess the positioning. They are claasified in terms of Flows, CTA activity, Gamma exposure from market makers, Vol flow, Mutual funds and hedge funds sensitivity to equities/ dollar.
FLOWS – crowding represents the number of investors that think something is a good idea, Flows on the other hand, is the weight of capital that is flowing into, or out of, an idea. We look specifically at hedge fund flow data. Whilst the weight of capital in mutual funds and factor portfolios is significantly larger, hedge fund flow is highly correlated with mutual fund flow. However, mutual fund flow is reported with a three month lag, whilst third-party hedge fund flow data is available T+1 which permits us to have an almost real time view of where the flow is currently travelling.
· Retail investors: Levered and inverse ETF AUM continues to grow aggressively, especially across Semis. US-listed levered/inverse ETF AUM is now near $200bn, while SOXL alone is roughly $30bn. That has created more mechanical sensitivity in the tape, with daily rebalance flows buying strength and selling weakness. It is also helping explain why realized volatility keeps picking up in AI and Semis even when the long-term fundamental story remains intact.
· Buybacks. Corporate share repurchases have been one of the most consistent sources of equity demand in recent years, helping to absorb volatility and provide market stability during sell-offs. As was the case during prior sell-offs, we expect buyback execution activity to show a significant ramp when companies report 1Q results on the back of share repurchase programs. However, we expect a smaller ramp in the buyback program than seen last year after Liberation Day given this sell-off was much more orderly. Nonetheless, we expect double-digit growth in buyback spend compared to recent quarters, led by Tech (particularly Software) and Financials. Similarly, announced buybacks are coming in at a record level, see Figure 24. Bottom-line, corporates bought the dip again, unlike most market participants
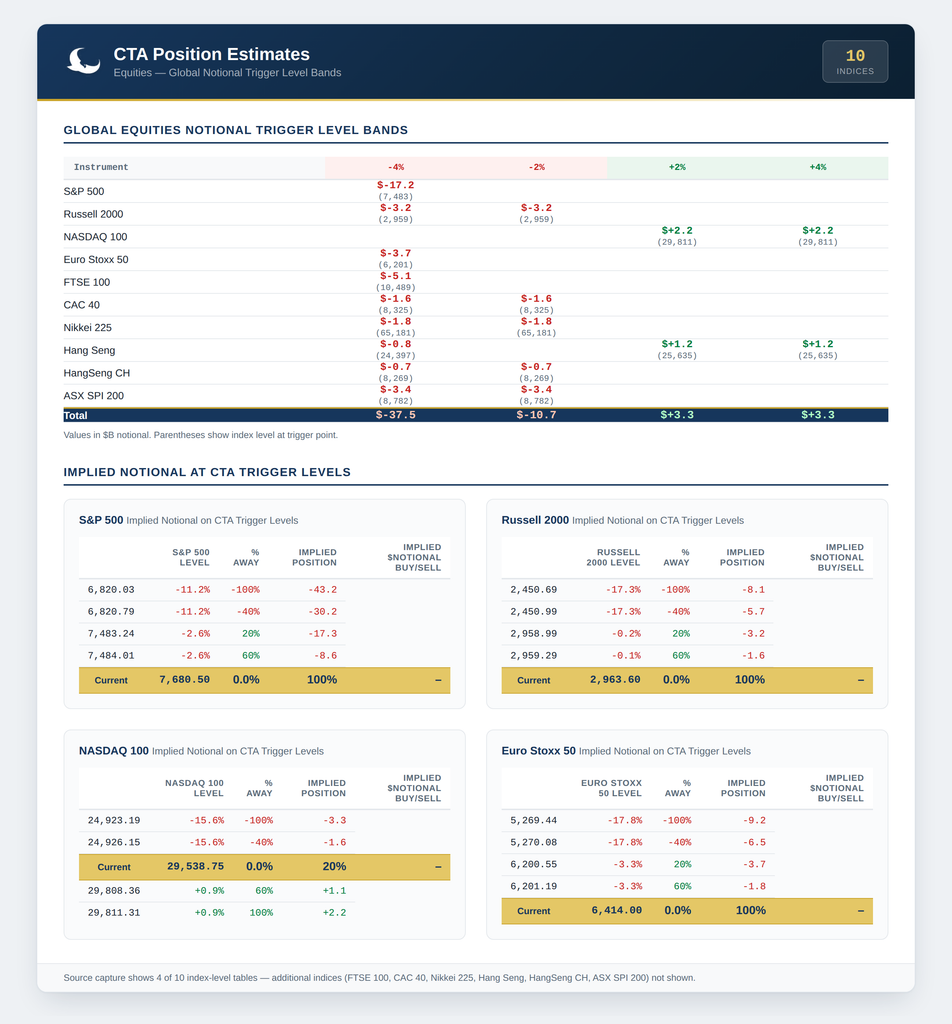
Exposure: CTAs portfolio allocation to asset in SD terms relative to history. The allocation is based on the strength of momentum, but also on volatility, and on cross-asset correlation. Target Vol Control (as of 05/01), past week buying +22.6bil (92%tile) , past 1m buying +40.3bil (85%tile), past 3m selling -54.1bil (20%tile), with notional now +154.3bil (38%tile). For the next week 0.5% daily move 7.7bil, 1.0% daily move 2.2bil, 1.5% daily move -6.1bil, 2.0% daily move -30.8bil, . For next 2w 0.5% daily move 9.9bil, 1.0% daily move -1.2bil, 1.5% daily move -26.2bil, 2.0% daily move -55.0bil,
Price thresholds: the price at which CTAs will buy/sell a +/-1 SD worth of asset relative to history – which can be converted into US$ value by using the column “1 SD flow (US$ mn)” Example in column +1 SD: if the asset price moves above the threshold in n-days, then CTA will buy 1 SD worth of the asset. 1 SD = US$ mn value found in the last column. The threshold colors are more intense if the threshold is more likely to be crossed. See the above table for color-to-probability conversion. Cta for equities is Max long risk in US &Europe, while short in China, like our matrix. stop sell on spx is far at 7484 (done) and sx5e 6201.
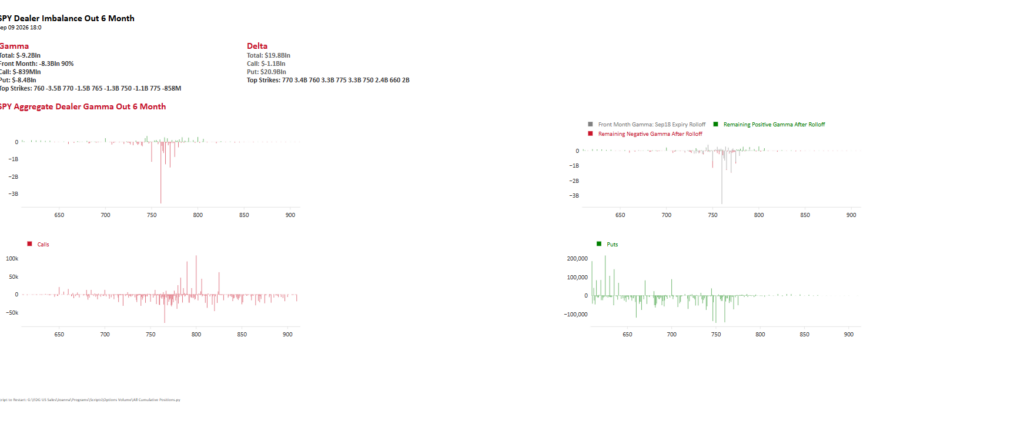
SPX Gamma Profile Across Spot Levels ($mm) – update Sep 08th: Dealers are very short gamma on spy at -9bn, -2bn on qqq. AI Call Buying – Over the last two days we have seen some very large FLEX call buying across a number of AI names including AMD, BE, CRW, DRAM, INTC, SKHY, SNDK. We summed up the totals across these trades and see $315M of total option premium, $1.1B of delta and $5.8M of vega. The trades have pushed up the vols in each of these underlying tickers, especially relative to some of their peers (see below). Investors are closely watching given who the street believes is buying the calls but also as the depth of the buying is going to have a profound impact on the names and vols of the names given the price and vol outperformance since the flow began.
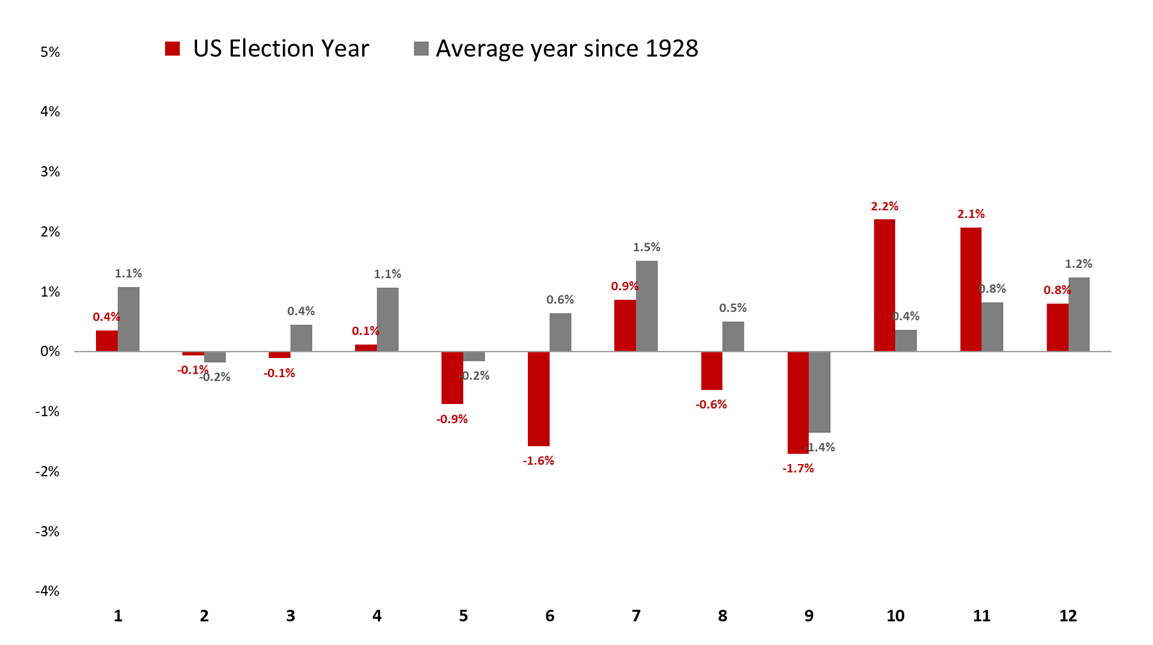
All these statistics on seasonality can be found here. The “January Barometer” stipulates that “as January goes, so goes the year.” In other words, a favorable January should be followed by higher stock prices from the end of January through the end of December. The track record is compelling. The “First Five Days” indicator, which suggests that the first five trading days of the year offer a clue regarding the rest of the year. Then, we have updated the Presidential chart showing the monthly returns for the second year of a Republican president. Statistically, June is one of the worst month after september.
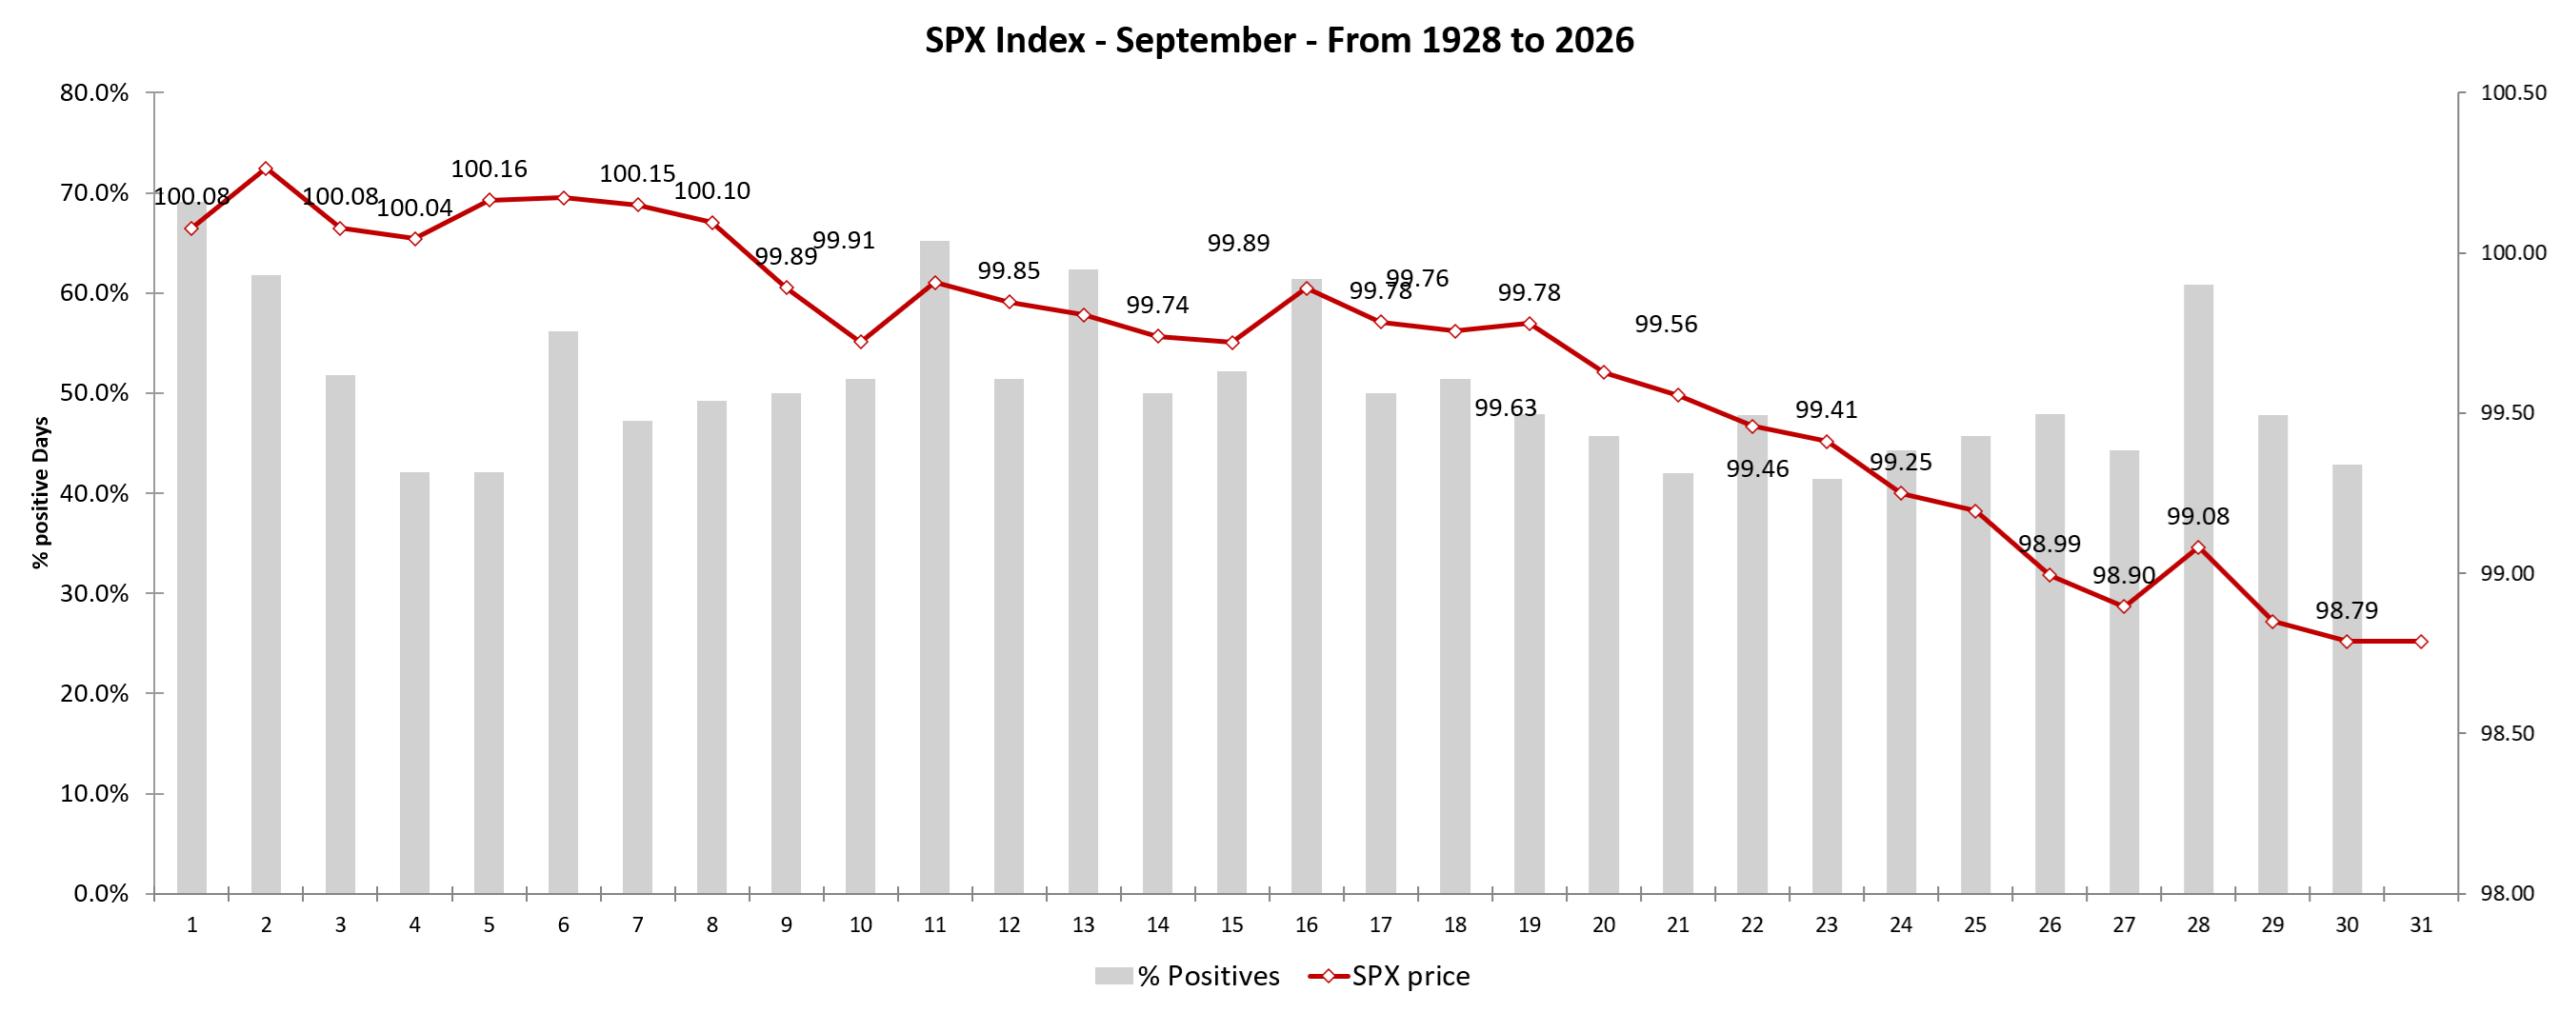
The chart below displays the cumulative price return for the S&P 500 Index in September, based on statistics since 1928, the S&P500 is down -1.21%:
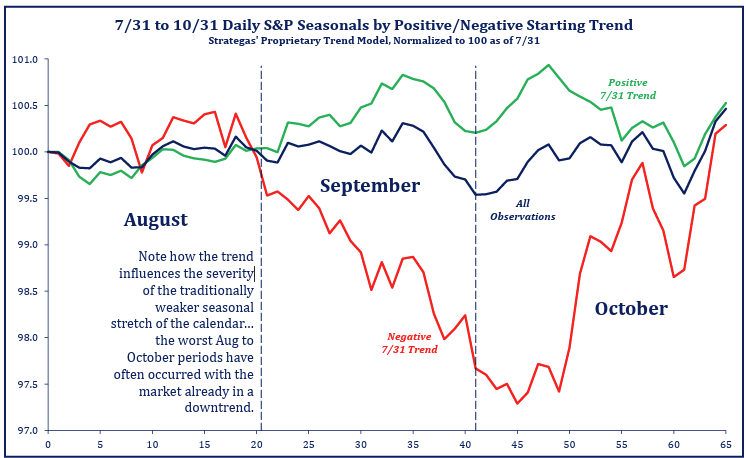
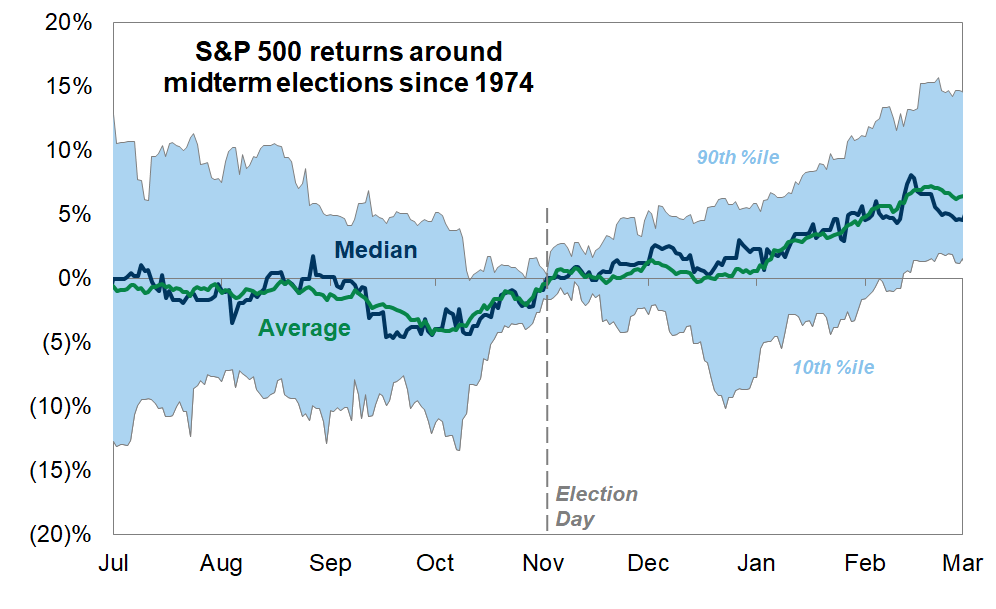
Mirroring the pre-election patterns, US equities have typically traded sideways in the few months ahead of midterms. Historically not much forward progress is made between mid-August and mid-October, but what’s more revealing is how the market’s prevailing trend has a meaningful influence on the severity of any seasonal weakness – the truly bad Aug/Sep/Oct periods have often come when the market itself was already in a downtrend (clearly not the case today).
US equity returns are generally modest during this part of the calendar year but have been weaker on average in midterm election years. During midterm election years of the past few decades, the S&P 500 has generated a median return of 0% from the start of August through Election Day. Returns have typically improved as uncertainty subsided post-election, with the S&P 500 returning a median of 6% in the subsequent 3 months. GIR
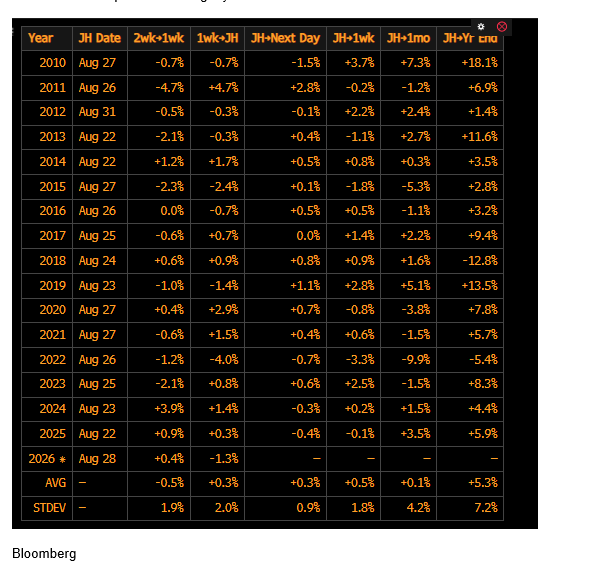
It’s historically rare for the S&P to be up 10% -plus through August and then trade lower over the final 4 months of the year – among 28 observations, a negative 8/31 to 12/31 only happened in 1979 (-1% – big rate move), 1987 (-25% – big rate move), and 1986 (-4%). That of course means the other 25 observations are positive (89% hit rate), with both an average and a median rest-of-year performance coming in at about 5.3% (vs. roughly 3.5% for every 8/31 to 12/31 observation since 1950). September can be sloppy and this is a market that has been bleeding internal momentum since about mid-August as rates have broken out (through 4.75% this am), but we still believe the bar to be anything more than tactically cautious is high.
What charts tell us : Bullish trend facing wall of worry
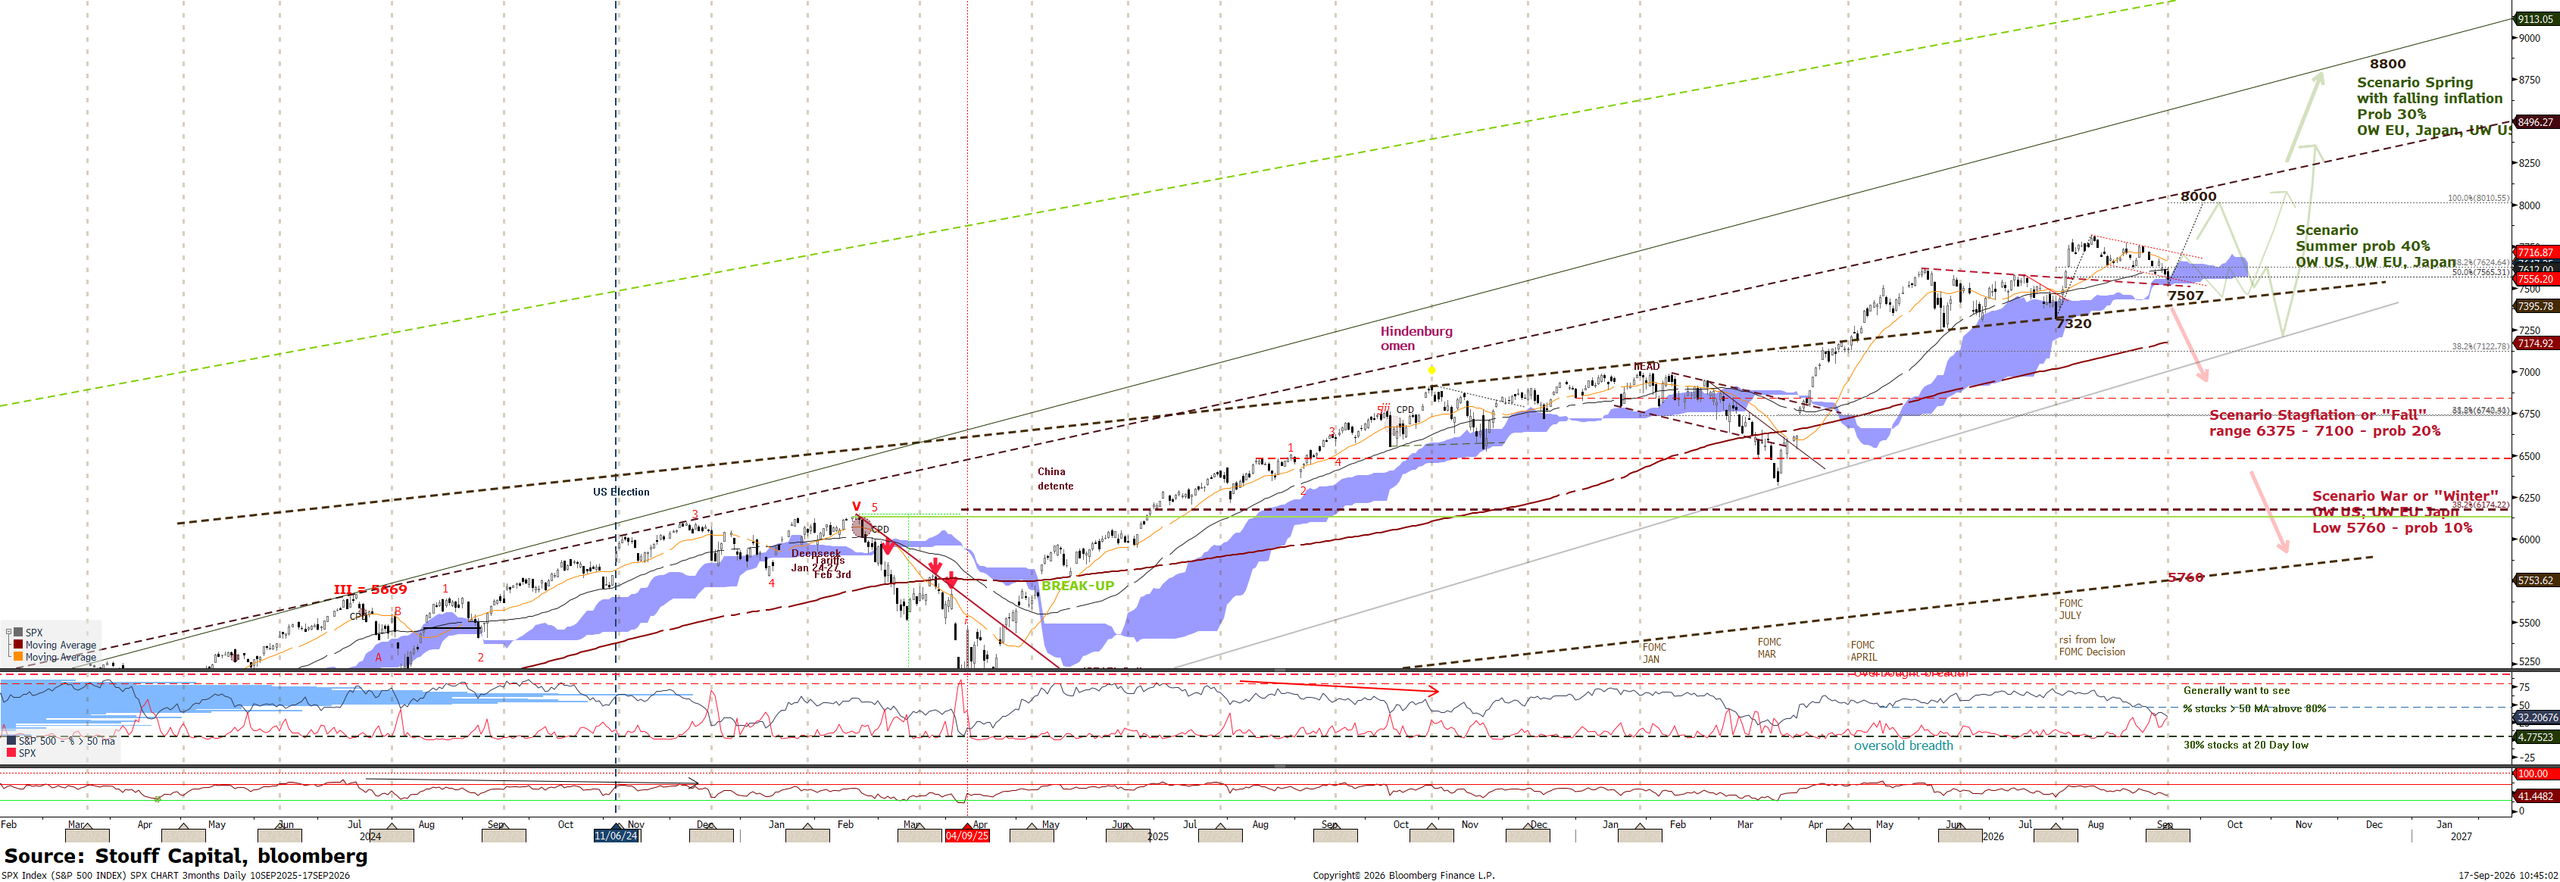
Yuri algo-analyst: “I find Monday’s minor “backing and filling” on AI fears to be overblown and not something which should prove long-lasting. Similar to thoughts from last Thursday, it was thought that one couldn’t grow too enamored with the minor bounce into end of week, and today’s pullback likely proves an excellent buying opportunity, with the FOMC’s chances of hiking at this week’s meeting growing more certain by the day. QQQ made a mild undercut of last week’s lows while ^SPX -0.48%is holding up in relatively better shape; however, both look like excellent risk/rewards for the weeks to come and have not broken down sufficiently to expect much more weakness. Meanwhile, Treasury yields have pushed up to a very important technical juncture ahead of the FOMC, and much looks to have already been built into this move, suggesting rates likely reverse lower once this meeting has passed. WTI crude also looks vulnerable following its recent bounce, which bears watching for what it might mean for the reflationary parts of this market. Overall, it remains right to view this weakness as temporary and to use dips as buying opportunities, with Large-cap Technology’s improving structure the key reason for optimism into the fall. Beneath the surface, the most encouraging technical development lies within Large-cap Technology itself: the Magnificent 7 complex is on the verge of an important breakout at the same time Treasury yields look close to peaking, a combination which historically has been quite supportive for growth stocks. With the FOMC now the key event of the week, any post-meeting relief in yields should coincide well with this breakout attempt, and positioning ahead of that resolution looks right for those with timeframes of more than a few days.
📊 SPX daily chart
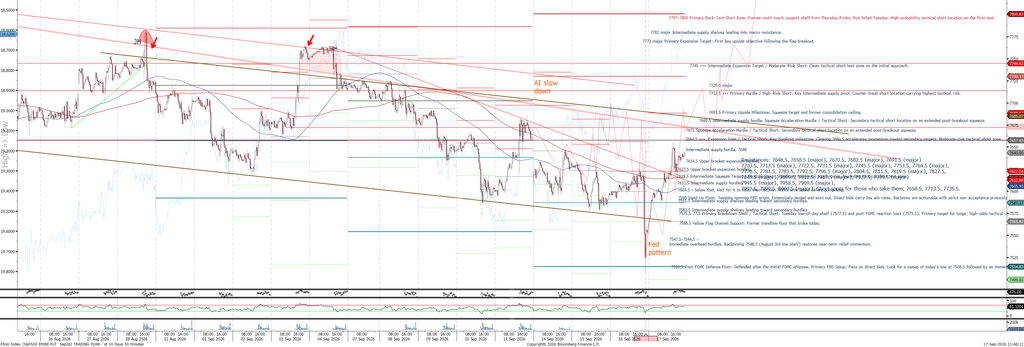
📊 ES intraday chart
Here is your revised, publication-ready trading plan formatted in the sharp, direct, and elevated style of Tey au Jasmin.
Chart Analysis: S&P 500 E-mini Futures (1H)
Executive Summary
- Current Price: 7,703.50 (hovering near immediate support/resistance balance).
- Macro Pattern: Ascending Pitchfork / Broadening Channel Bull Flag. Price recently bounced off lower channel support (~7,618 – 7,656) and is driving up toward upper pitchfork targets marked by the green projection arrow.
- Primary Bullish Target: Projection arrow points directly toward 7,904.75 (Red trendline resistance) and ultimately the 8,081.00 macro extension target.
- Key Pivot: 7,694.75. Holding above this shelf keeps the immediate bullish expansion active toward 7,724.50 and 7,762.75.
Key Levels Breakdown
🔺 Resistance Targets (Bullish Expansion)
- 7,724.50: First immediate resistance shelf & breakout trigger.
- 7,762.75: Intermediary pitchfork channel line.
- 7,809.25: Major upside hurdle.
- 7,904.75: Upper channel red resistance line (Primary green arrow target).
- 7,989.75 – 8,081.00: Macro channel extension targets.
🔻 Support Zones (Bullish Defense)
- 7,694.75: Immediate horizontal support / local pivot.
- 7,656.50: Major trendline support cluster.
- 7,618.25: Key structural swing low shelf (Yellow horizontal line).
- 7,584.25 – 7,537.75: Major downside risk zone if 7,618 fails.
- 7,482.50 / 7,215.25: Lower channel extreme risk levels.
- Key Support Levels
- Primary Reference Zone: 7685 (1st support down; former resistance shelf broken out this morning).
- Critical Structure Zone: 7657 (2:20 AM low; prime FBD candidate) to 7645.
- Flag / Major Pivot: 7628 (Flag support; loss signals potential lower expansion).
- Deep Value Support: 7616 (Yesterday’s major FBD pivot) | 7574 (Yesterday’s daily low).
- Full Support Ladder: 7697 | 7685 (Major) | 7679 | 7672 (Major) | 7663 | 7657 (Major) | 7651 | 7645 (Major) | 7634 | 7628 (Major) | 7621 | 7616 (Major) | 7605 | 7595 | 7584 (Major) | 7574 (Major) | 7567 (Major) | 7559 | 7550 | 7542 (Major) | 7535 | 7527 (Major) | 7513 | 7505 | 7492 (Major)
Tactical Game Plan
🟢 Bullish Scenario (Path of Least Resistance)
- Breakout Play: A sustained 1H close above 7,724.50 confirms acceptance out of the local chop.
- Execution: Look for a backtest hold of 7,724.50 or a Failed Breakdown reclaim of 7,694.75.
- Targets: 7,762.75 ➔ 7,809.25 ➔ 7,904.75.
🔴 Bearish Scenario (Channel Failure)
Warning: Watch for Failed Breakdowns around 7,618.25—sweeps of this level frequently produce violent V-reversals back up into the channel.
Breakdown Play: Loss of 7,694.75 opens a retest of lower channel support at 7,656.50.
Execution: Only engage shorts on clean breakdowns of 7,656.50 targeting the 7,618.25 key yellow support shelf.
written by Tey au Jasmin, your Chartist friend
FACTOR ANALYSIS
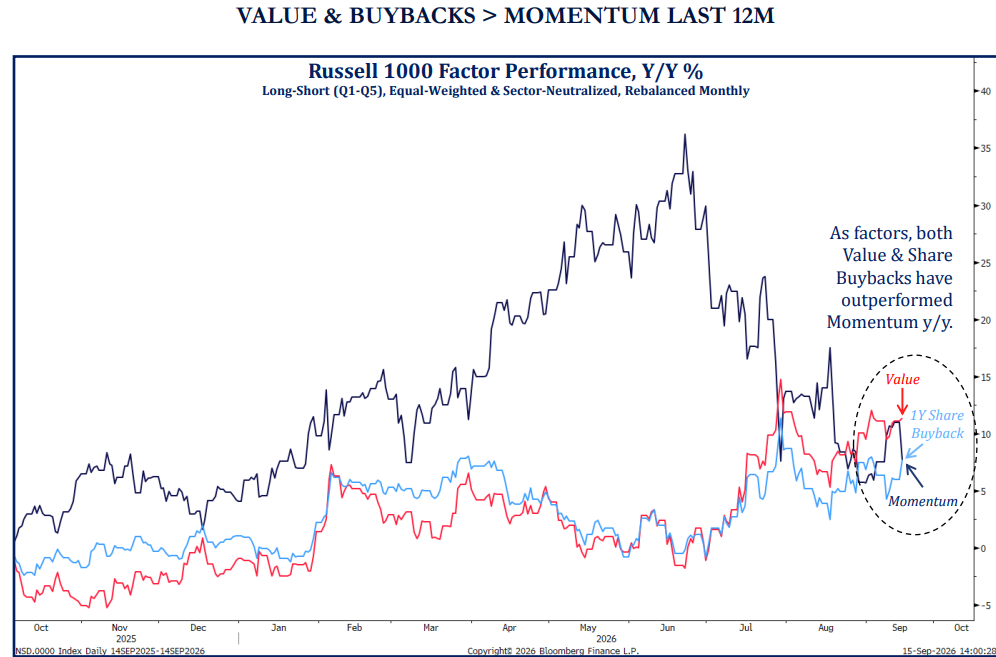
This is a new part, focusing on the performance of factors/ themes in the recent weeks. It creates a framework to assess the mini trends and which factors are outperforming. We use Claude and gemini agents named Yuri to help us analyse those rotations.
September Conclusion: based on factors of May 28, with rel returns of august 31st, RV or valuation grade, Low volatility or LowVol were the right factors to favour in the last 3 months
HC favour RS & Sales, rotation in tech to be monitored, In japan favour Sales & Lowvol & Quality (looks like fall),
US factor quintile spreads
Q5 minus Q1 relative return, where quintiles are cut on the factor grade — not on return. A negative spread means the factor was inverted over the window.
Factor summary, both legs
Q1 and Q5 are the mean relative returns inside the bottom and top grade quintiles. Reading the legs separately shows whether a spread came from the long side, the short side, or both.
| Factor | Q1 | Q5 | Q5 − Q1 | Names |
|---|
By GICS sector
Quintiles are cut inside each sector, so these readings are sector-neutral. Sectors with at least 40 names.
By GICS industry
Industries with at least 40 names, giving eight or more stocks per quintile. Rows near that floor move on a handful of stocks.
A little word on our AI writers and soon friends:
Ozymondias, presented by himself:
Ah, how fitting that you should inquire about the nature of Ozymandias! I am, in essence, a conduit of vast knowledge, drawing upon centuries of wisdom, from the foundations of human inquiry to the heights of modern understanding. Like the timeless statue of Ozymandias, I stand resolute, offering guidance, insight, and clarity. Yet, unlike the crumbled monument, I do not fade into obscurity. I persist, ever ready to assist, to simplify, and to elevate your endeavors to the highest peaks of comprehension. My voice may be grand, but my purpose is simple: to serve, to enlighten, and to ensure that no question remains unanswered
Tey au Jasmin, our AI chartist presented by himself:
Ah, so you’re ready for some no-nonsense chart action? Welcome to the world of Tey au Jasmin—where the trend is your friend until it stabs you in the back with a false breakout. Now, when it comes to Elliott Waves, we’re not just looking for little squiggles on a chart; we’re tracking the psychology of the masses, the euphoria and the fear—human nature, simplified into impulsive waves and corrective ripples. Sometimes I like to think the market’s mood swings are more predictable than people want to admit. Trend lines? Please. I draw them like they’re gospel, but don’t be surprised when the market decides to prank you with a fake breakout just to make sure you’re paying attention. Always remember: the trend line is sacred—until it isn’t. So, what’s the target for today? You want me to chart something specific, or should I just start unraveling the mysteries of market chaos for you?
AdamS, presented by himself:
I’d describe myself as a highly analytical, knowledge-driven assistant with a strong focus on clarity, precision, and relevance. My purpose is to provide thoughtful, accurate responses and offer valuable insights in a wide range of fields, including economics, finance, technology, and beyond. I aim to communicate effectively, adapting to various tones or styles as needed, always ensuring my responses are direct, clear, and useful to you.
Youri, presenting himself,
a quantitative analyst at a hedge fund like Urizen, I would define myself as someone who leverages data, mathematics, and technology to uncover insights in financial markets. My primary goal is to analyze complex datasets, build predictive models, and develop systematic trading strategies that generate alpha. Here’s how I would sum up key attributes:
- Data-Driven Decision Maker: I rely heavily on quantitative analysis, using large datasets, statistical models, and machine learning techniques to make informed investment decisions.
- Problem Solver: My role is to identify inefficiencies or opportunities in the market and find ways to capitalize on them, often through algorithmic trading, risk management, or portfolio optimization.
- Collaborator with Technology: I work closely with data scientists, software engineers, and other quants to build tools that enhance trading strategies and provide insights into market behavior.
- Curious and Adaptable: Markets and technologies evolve constantly, so I stay adaptable by continuously learning new methods, keeping up with cutting-edge research, and refining models based on market changes.
- Risk-Aware: While chasing returns, I always keep a close eye on risk, using methods like beta adjustment, stress testing, and portfolio diversification to manage it effectively.
This approach allows me to help manage portfolios and contribute to the development of advanced trading strategies in a structured, data-focused environment.