
A generational fight (Pdf version)
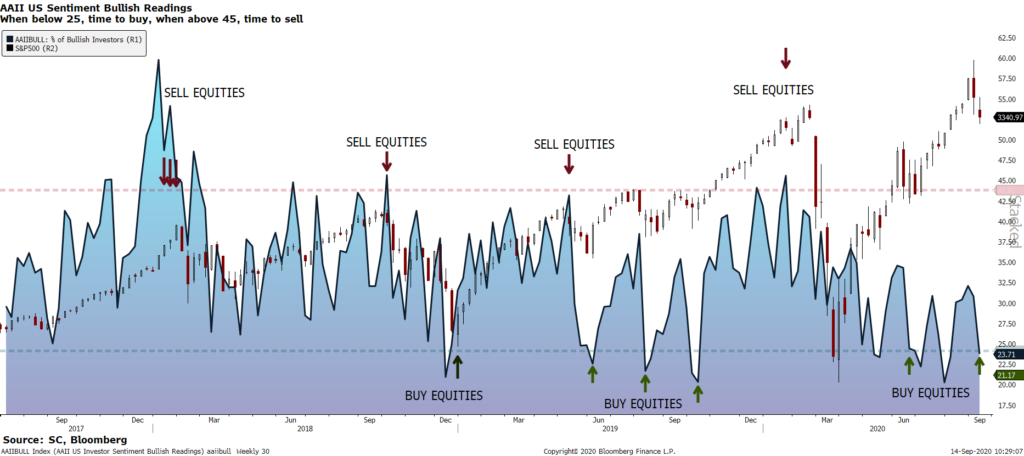
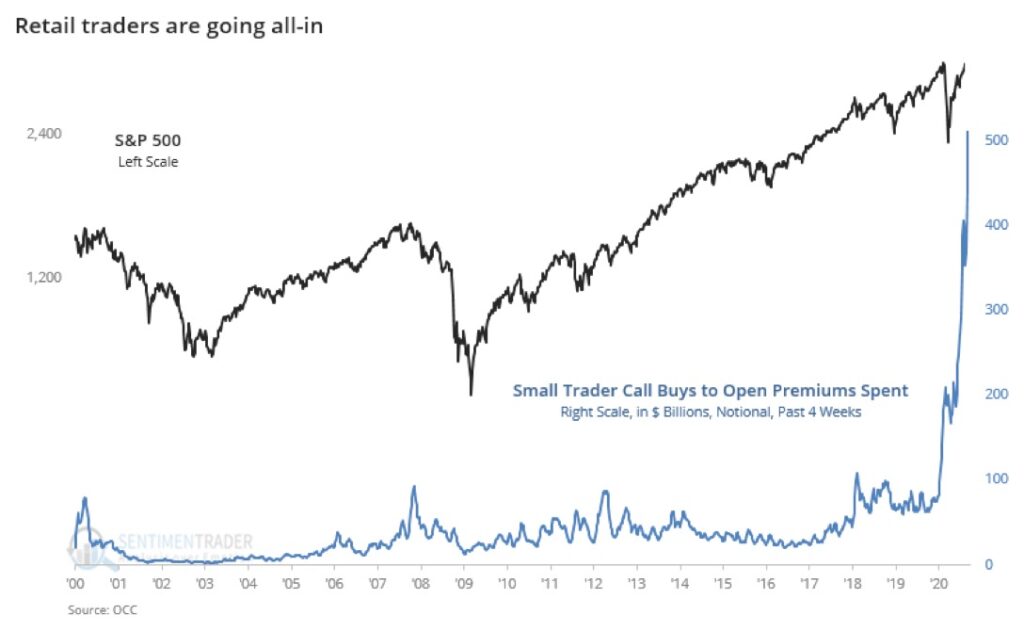
What is observable in the markets since the start of the pandemics is also extraordinary from the point of views of different generations. While the Baby boomers and X generation are cautious on equities as can be shown in the AAIBBULL index (Chart 1 shows that the 3 week average of bullish opinions less bearish opinions is at its low while the S&P500 is near its high), their children, the Millennials, have been responsible for an explosion in the purchase of speculative upside options as shown in the chart 2. Daily volume is now explained half by their activity and the notional of options is now more than the cash equity volume. This new micro-structure trend easily explains the Nasdaq momentum in August and its reversal at the start of September.
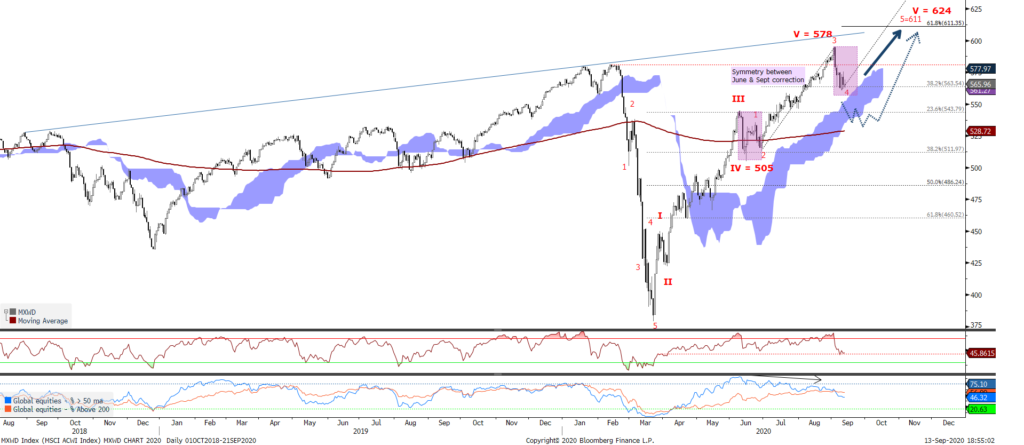
Indeed, global equities (MSCI World in chart 3) have reached our wave V target in August and printed a new all time high record. But, global equities have finally reversed with more than a 3% loss, enacting our CPD posture (change point detection). The technical reach of our target followed by a clear reversal means that our scenario 1 (a V rebound) has now fully played out. We expect a consolidation phase until the US election, before a resumption of the bullish trend.
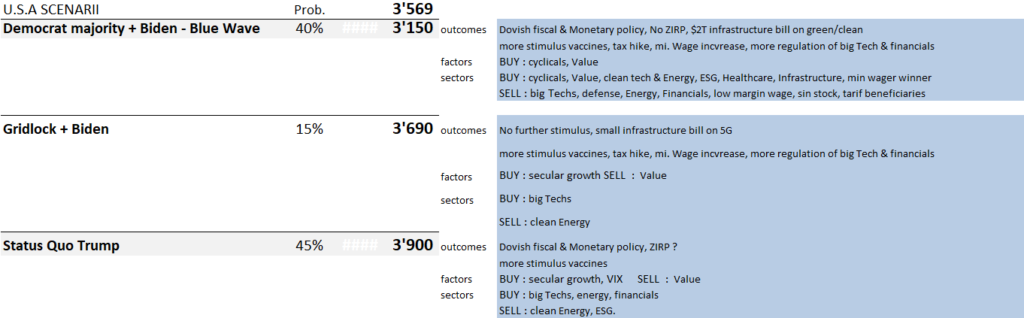
This is our base scenario but we are now working on 3 new scenarii (Chart 4): (1) a step higher to 3,690 if the US election is not delayed and brings a pro market outcome, with central banks still very accommodative and a vaccine before the end of the year, (2) a neutral election outcome with a muddle through economics but strong liquidity with a range between 3150 and 3400 or (3) a return to extreme volatility owing to fiscal cliff, nasty election or the return of the pandemic (target range 2880-3150).
US election is the main catalyst for the coming weeks, with the following dates: Sept 29th 1st Presidential debate, Oct. 7th Vice Pres. debate, Oct 15th 2nd Pres. debate, Oct 22 3rd Pres. debate. The 2020 United States elections is scheduled for Tuesday, November 3, 2020. All 435 seats in the United States House of Representatives, 35 of the 100 seats in the United States Senate, and the office of President of the United States will be contested. In addition to the Presidency, a flip in legislative control of the Senate would be, by some measures, the biggest ideological swing in more than 200 years.
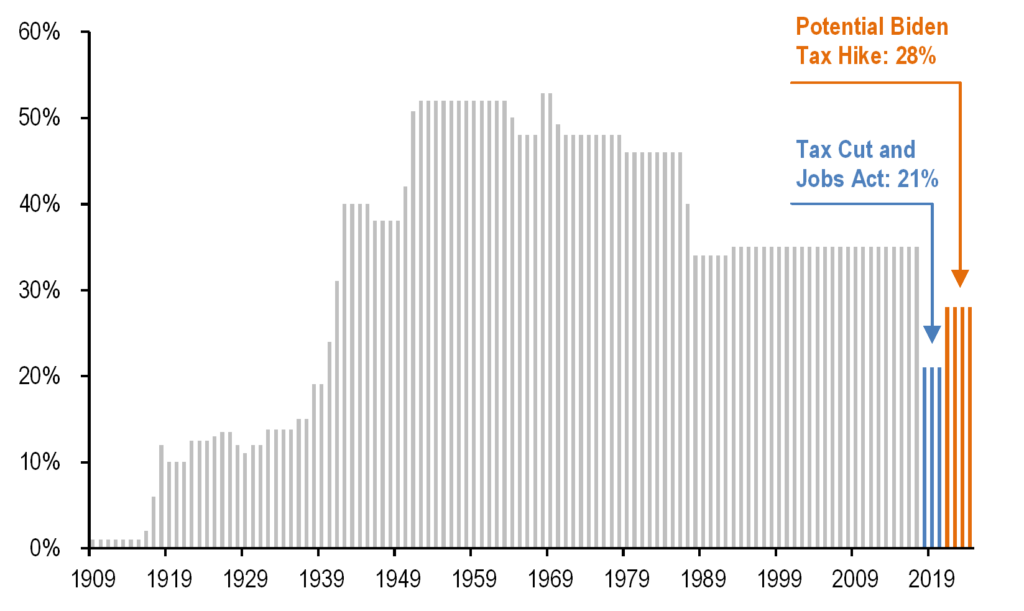
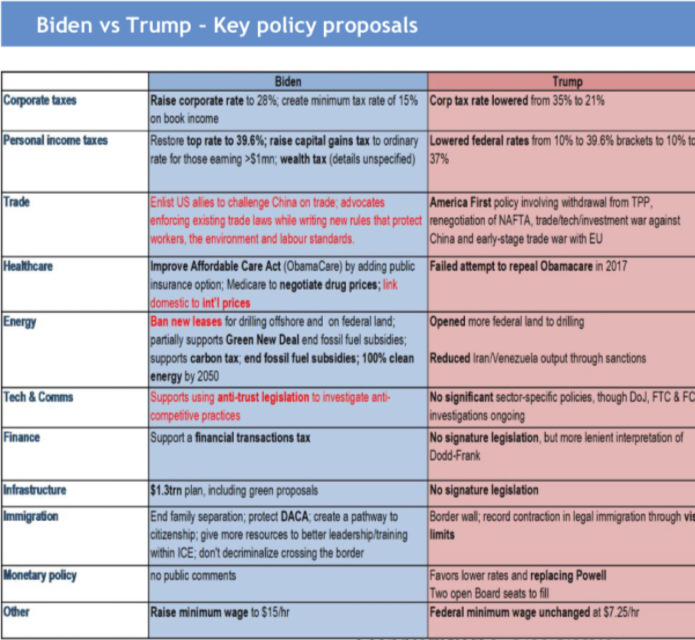
The market view is that a Democrat victory in November will be negative for equities. To the contrary, we argue that this outcome could be slightly positive in the context of the current economic COVID-19 crisis. Indeed, Biden’s proposed policies were introduced in a healthy economy during the Primaries and pre-COVID-19. Given the actual economic weakness, business recovery and job growth are likely to be prioritized over policies that could dampen economic growth. The degree of corporate tax reversal could be lower than discussed (<28% see chart 5).
Other policy proposals including infrastructure spending, softening tariff rhetoric and higher wages should be net positive for S&P 500 earnings and largely offset the corporate tax headwind. Further, a more diplomatic approach to domestic / foreign policy will likely result in lower equity volatility and risk premia (VIX in the year before the trade war averaged 11%, and after the trade war started 16%).
What’s more, if Democrats take the presidency and Congress, exposure to Biden’s “green” agenda of which he has pledged to spend a part of his $700 billion recovery plan, would prosper. Key beneficial stocks here are surprisingly ROW exporters like European
automobile makers, which stand to gain from lower tariffs and electric-vehicle supportive policies. And while health-care stocks could take a hit in the lead up to that election, a relief rally is likely afterward, even in a Democratic sweep. “Overall, long-term themes that should benefit include smart mobility and energy efficiency,”.
Should Republicans take the White House and Congress, energy would be a big winner, rallying in relief over the removal of the threat of stricter regulations that Democrats had been proposing. And a second-term Trump administration would likely maintain a tough line on trade, encouraging production back to the U.S. Stocks that could benefit include robotics and automation.
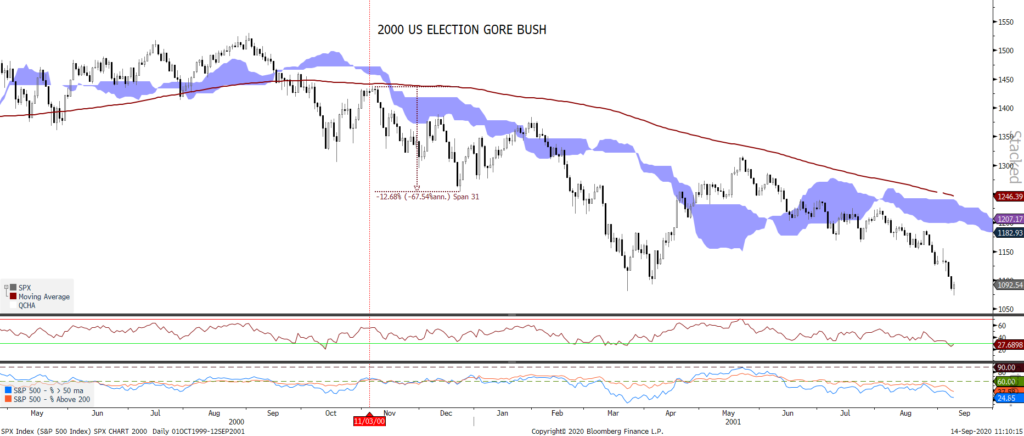
Add the possibility of a contested election in November given the rising share of postal voting and the President’s pre-emptive allegations that this method is fraud-prone, and the backdrop has shades of late 2000. As a comparaison (chart 6), during the Gore-Bush saga, US Equities dropped about 12.7% from their pre-election level, but never recovered meaningfully given that the US entered a recession in late 2000/early 2001.
space

What our Matrix tells us
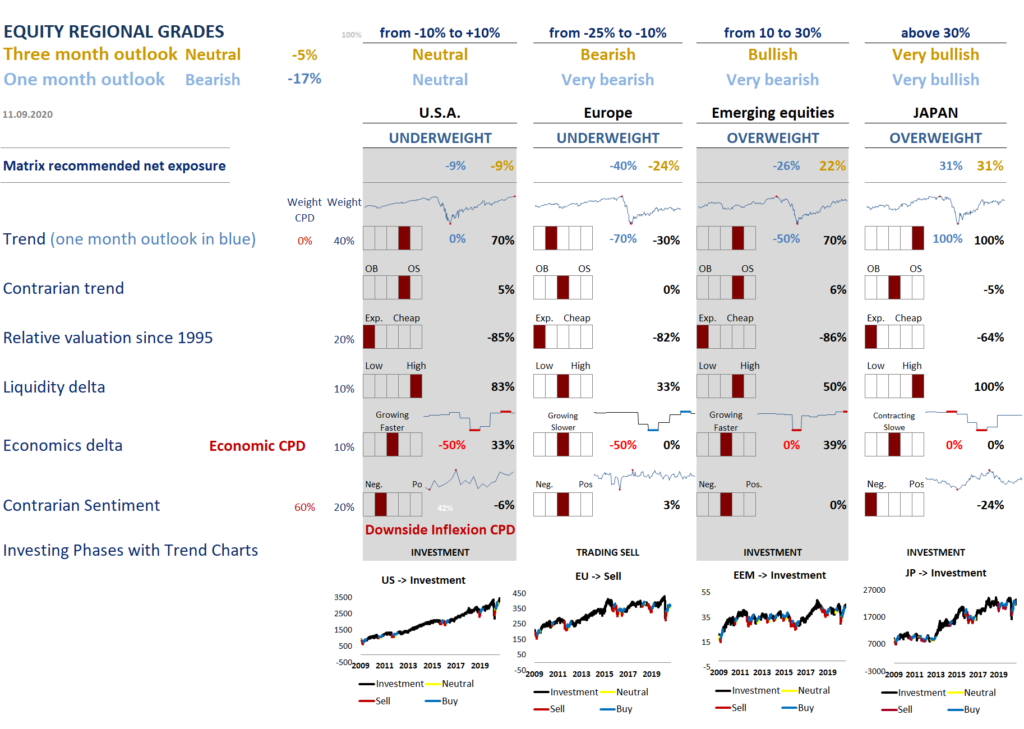
Our Matrix has switched in CPD in August and recommended hedging our US and European exposures, which we did through our recent trades. This CPD could at any time be cancelled (if sentiment becomes less exhuberant) as indexes reached their wave 4 targets. We think equities should stay range-bound until the outcome of the US election.
LIQUIDITY
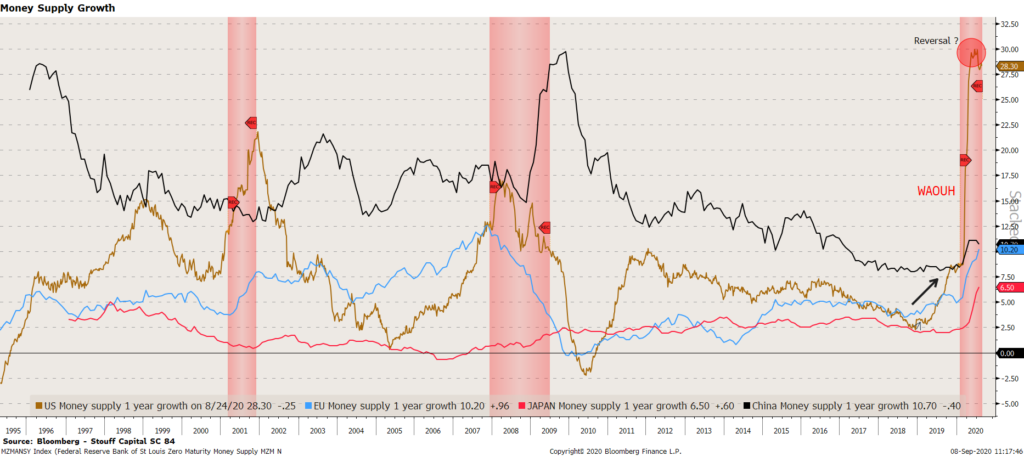
Unsurprisingly, the Liquidity grade is very bullish in US and still supportive in the other regions. The FOMC made history, announcing a shift in its policy stance, the Fed will now target an average inflation rate and will allow prices to run a little hotter to make up for the lost decade of underperformance. Powell said that while US unemployment data for August was positive, the economy’s recovery from the coronavirus pandemic has a long road ahead and interest rates will remain low for a long time. “The recovery is continuing; we do think it will get harder from here.. Today’s jobs report was a good one,” he said, adding that “to get us back to full employment, we’re going to have to get the disease under control.” A change in monetary policy dynamics is likely to feed through to inflation expectation…
ECONOMICS
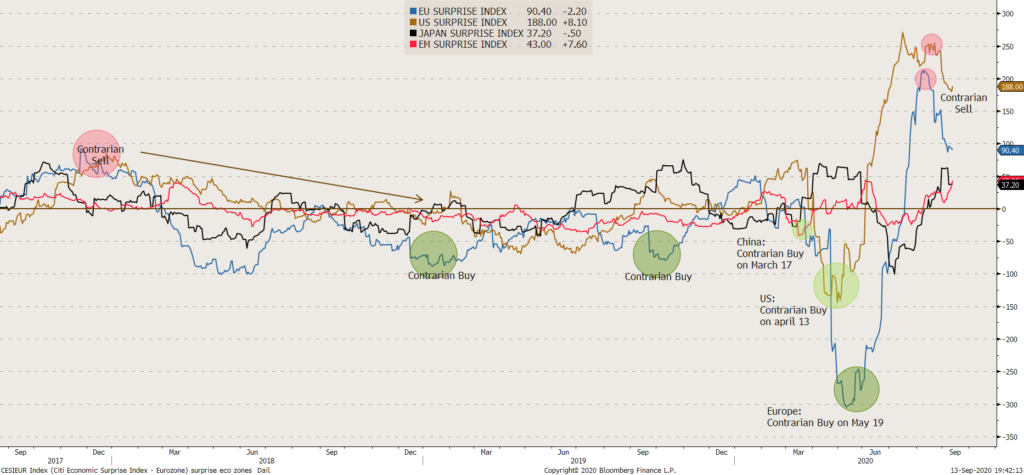
Our Economics grade has switched to CPD (Change point detection) as the Citigroup surprise indexes have turned south from elevated (historical high) levels. This is a negative and while the economy has not suffered the full effects of Covid-19 because fiscal policy plugged the hole in income created by job losses, without an extension of that support, the economy would need to hit the reset button to align with high rates of unemployment and all they entail. What’s more, the failure of Congress to pass support for state and local governments would accelerate layoffs, which could be enough to halt improvement in the unemployment rate.
VALUATION
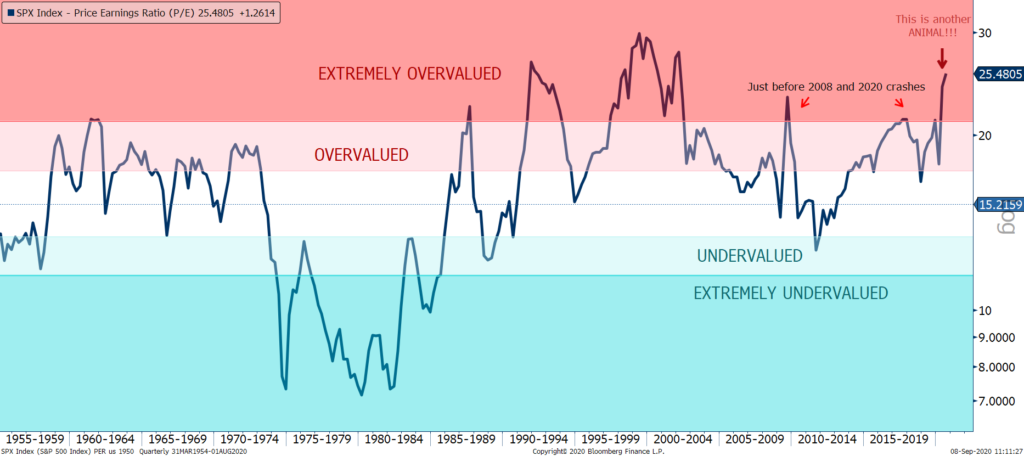
Valuation is now extreme. The chart above shows that US P/E are not far from the 2000 levels. Compared to long term and short term yields, equities stay cheap.
SENTIMENT
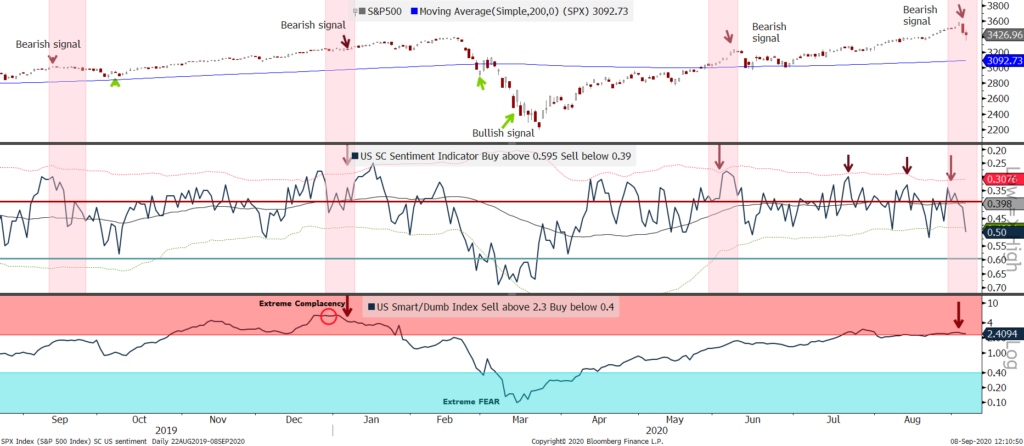
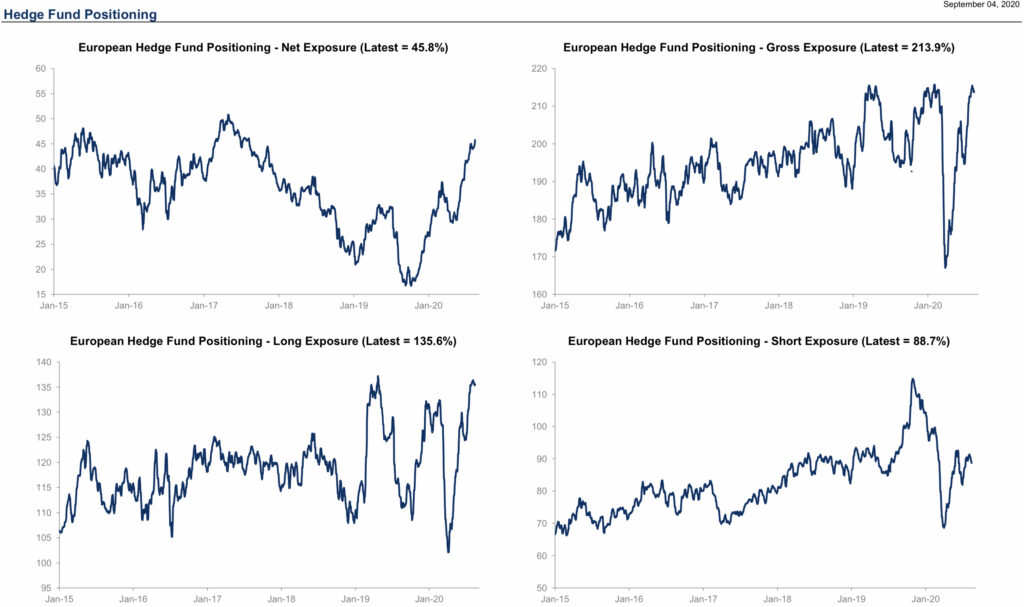
Sentiment has been bearish since the end of July and switched our regional matrix in CPD (change point detection) conditions. In the chart above, our US SC Sentiment indicator gave short term and medium run bearish signals. Specifically our S/D indicator went bearish in August (not as extreme as Dec 2019). But it has given many false contrarian bearish signals. It has been confirmed by the too high exposure of hedge funds (see below) as a contrarian indicator. Finally, it has worked…
Trading Plan
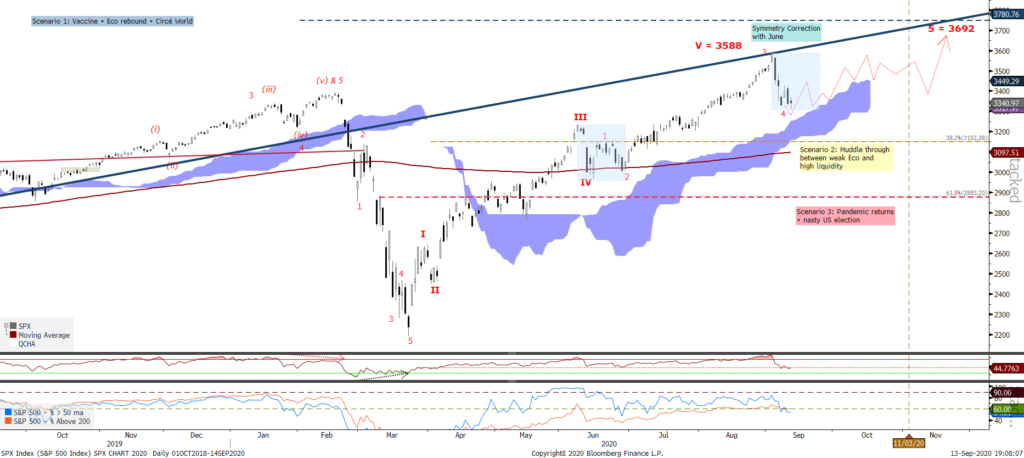
We have updated our scenarii for the end of the year as our wave 5 target is now nearly reached. We think the extraordinary monetary conditions could send equities 10% HIGHER, if economic data rebounds more and the US election goes smoothy . It means a target of 3,690 for the S&P500, which in terms of Elliott wave means a 100% extension from the wave IV instead of the usual 61.8%. This is our new base scenario. 2 alternative scenarii would crate 2 range trading: scenario (2) a muddle through economy hurt by falling economic data but financial markets still supported by excessive liquidity and (3) a negative scenario when pandemic returns and / or the US election becomes very nasty with a fiscal cliff. For scenario 2, the S&P500 should move between 3150 and 3400, while in the third scenario, the range would be between 2880-3150.
With respect to scenario 3, the US fiscal cliff could become a material risk to US markets if it intersects with a contested election, so would continue supporting tactical hedges/ downside convexity on US and European Equities. Just to mention other risks, a hard Brexit is a major negative probably only for the UK economy. Then, Europe’s second virus wave is probably as manageable as the US one was this summer, given strong starting momentum and a surgical approach to mobility restrictions.
Catalysts next week: Japan LDP leadership election (Sep 14th); US IP, China IP/retail sales/FAI & ZEW (Sep 15th); FOMC, BCB & US retail sales (Sep 16th); BoE, BoJ, SARB & BI (Sep 17th); US consumer sentiment & CBR (Sep 18th).