Q3 is ending as a mediocre one for many growth assets, with only a handful squeaking out positive returns since June.Global Equities are flat since mid-year as small gains on the US (+1.5%), Europe (+1.3%) and Japan (+3.5%) offset losses on MSCI EM (-5%).
For the identification of the economic and market regime, our Economics grade is using PMIs. Indeed, the correlation between PMIs and the returns on global equities is extremely high. We identify 4 different phases:
(1) an early-stage upturn (PMI below 51 but rising),
(2) a later-stage upturn (PMI above 51 and rising),
(3) early-stage downturn (PMI above 51 but falling)
(4) later-stage downturn (PMI below 51 and falling).
The current phase resembles a later-stage downturn because global growth has been decelerating for over 18 months, to a rate that is now sub-trend. This phase typically generates returns below 2% per annum on a multi-asset portfolio comprising Equities, Credit and Commodities. Should stimulus trigger a regime shift into the upturn phase, returns tend to average 6% to 8% per annum, so some four to five times higher than in the current business cycle phase.
Our economics grade also use higher-frequency growth surprise indices like JPM’s family of EASIs or Citigroup surprise index, as another assesment of economic conditions. The weakest returns come during a later-stage slowdown when EASIs are negative (more downside than upside surprises to high-frequency data) and falling; and the highest returns come during a later-stage upturn when EASIs are positive and rising. Although JPM’s global EASI has perked up recently due to better-than-expected US data, the PMIs have not. And for those who are faithful to models, our backtests suggest that PMIs issue more reliable tactical asset allocation signals than EASIs.
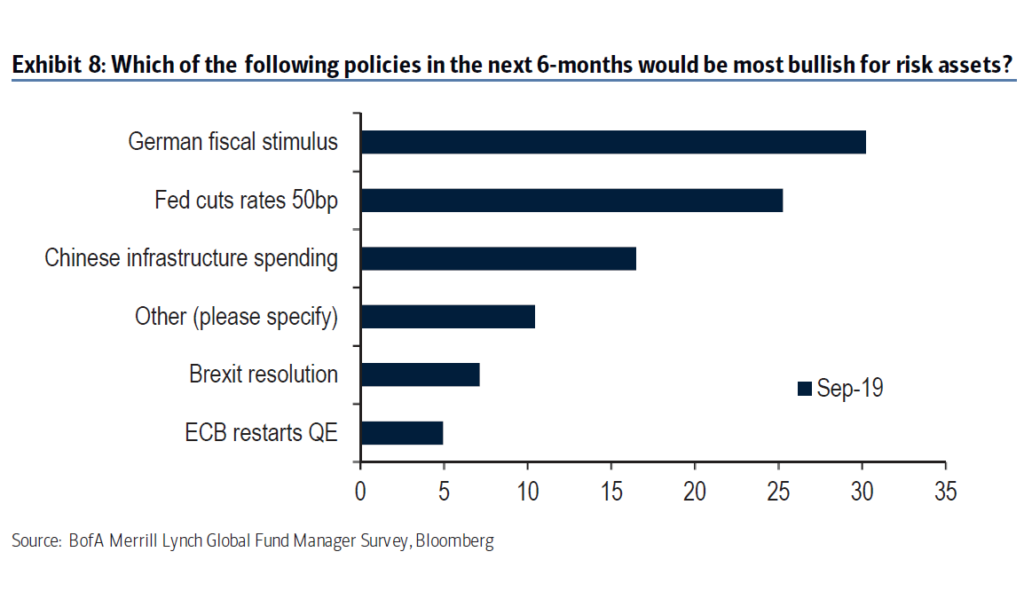
September is unfolding as a major mean-reversion month, with most moves from August reversing over the past two weeks. Within Equities, the rotation into Value from Momentum has been an opportunity awaiting a catalyst, given extremes in performance and positioning over this cycle. More broadly across asset classes, what else qualifies as a tactical value trade versus a strategic value investment versus a best-avoided value trap? For those who believe in trade truce, value trades abound (short duration, long EM Equities). But for those still mindful of regime changes like partial Japanization, value investments are sparse (Yen, some EM rates). Potential value traps like EMU Equities require decisive fiscal easing. Our baseline view that the global economy bends without breaking continues to track reasonably well. This week’s US retail sales report confirmed the US consumer’s resilience despite slowing job growth and falling confidence (see Feroli). We are not convinced that goodwill gestures between the US and Mainland China herald a decisive turn in the conflict, but at least central banks are willing to move decisively, like the ECB’s relaunch of open-ended QE
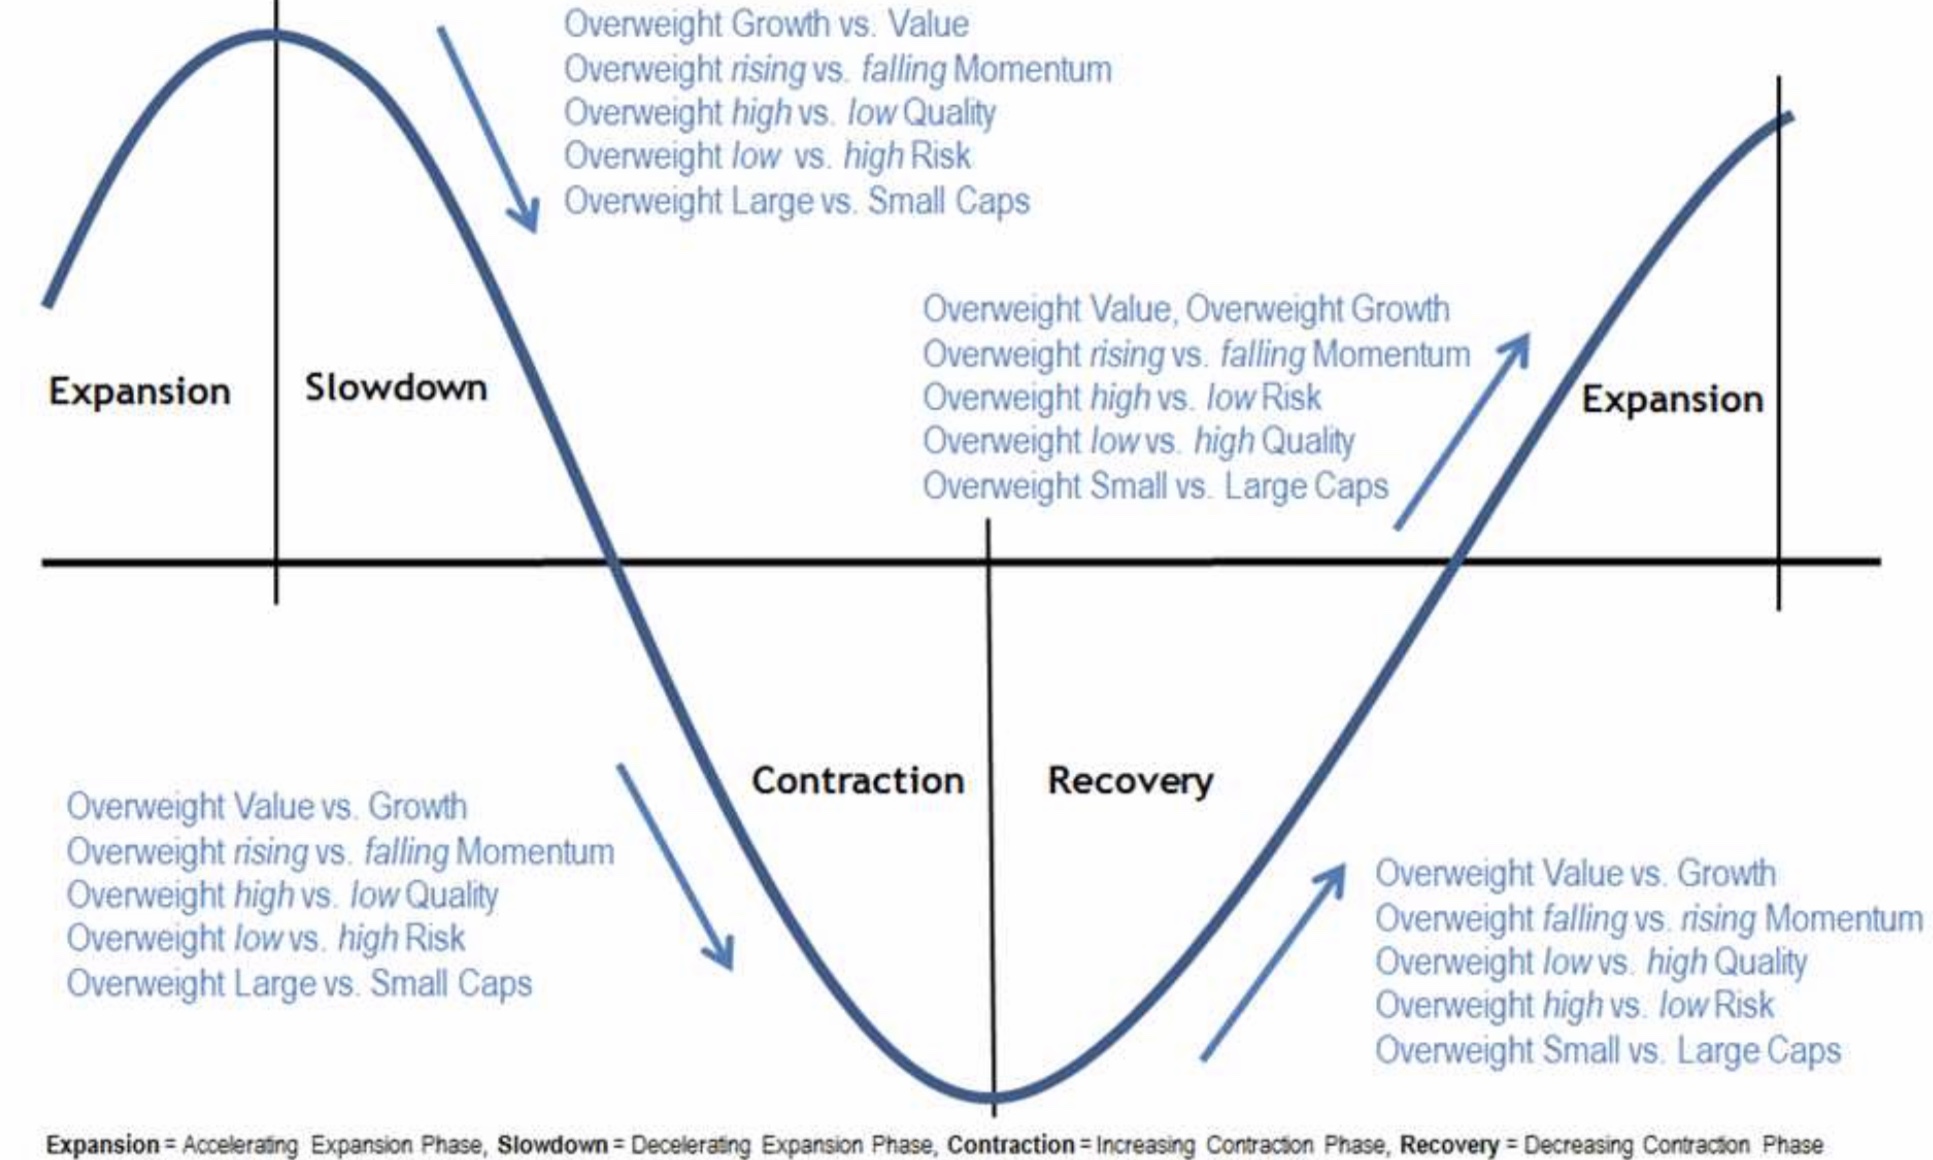
We believe the recent rally in Value vs more defensive style characteristics is potentially the early stages of investors discounting a ‘recovery’ in the economic cycle; whether it be the stabilization in bond yields, potential central bank intervention, or a floor in economic growth expectations.
Our dynamic style investing framework is based on linking cycle phases with back-tested investment style returns. Simply put, the recent performance of more cyclical and high risk orientated styles is consistent with the ‘recovery’ phase of the cycle rather than any other phase. This phase is when investors historically favour cheap Value, falling Momentum, low Quality, high Risk, Small caps and low momentum. We capture these low momentum stocks with our RS grade, which ranks on their relative 1 year return the most liquid global stocks. We insert below a list of the best mix of grades (highest EPS growth, acceleration of the EPS growth, with worst RS grade):
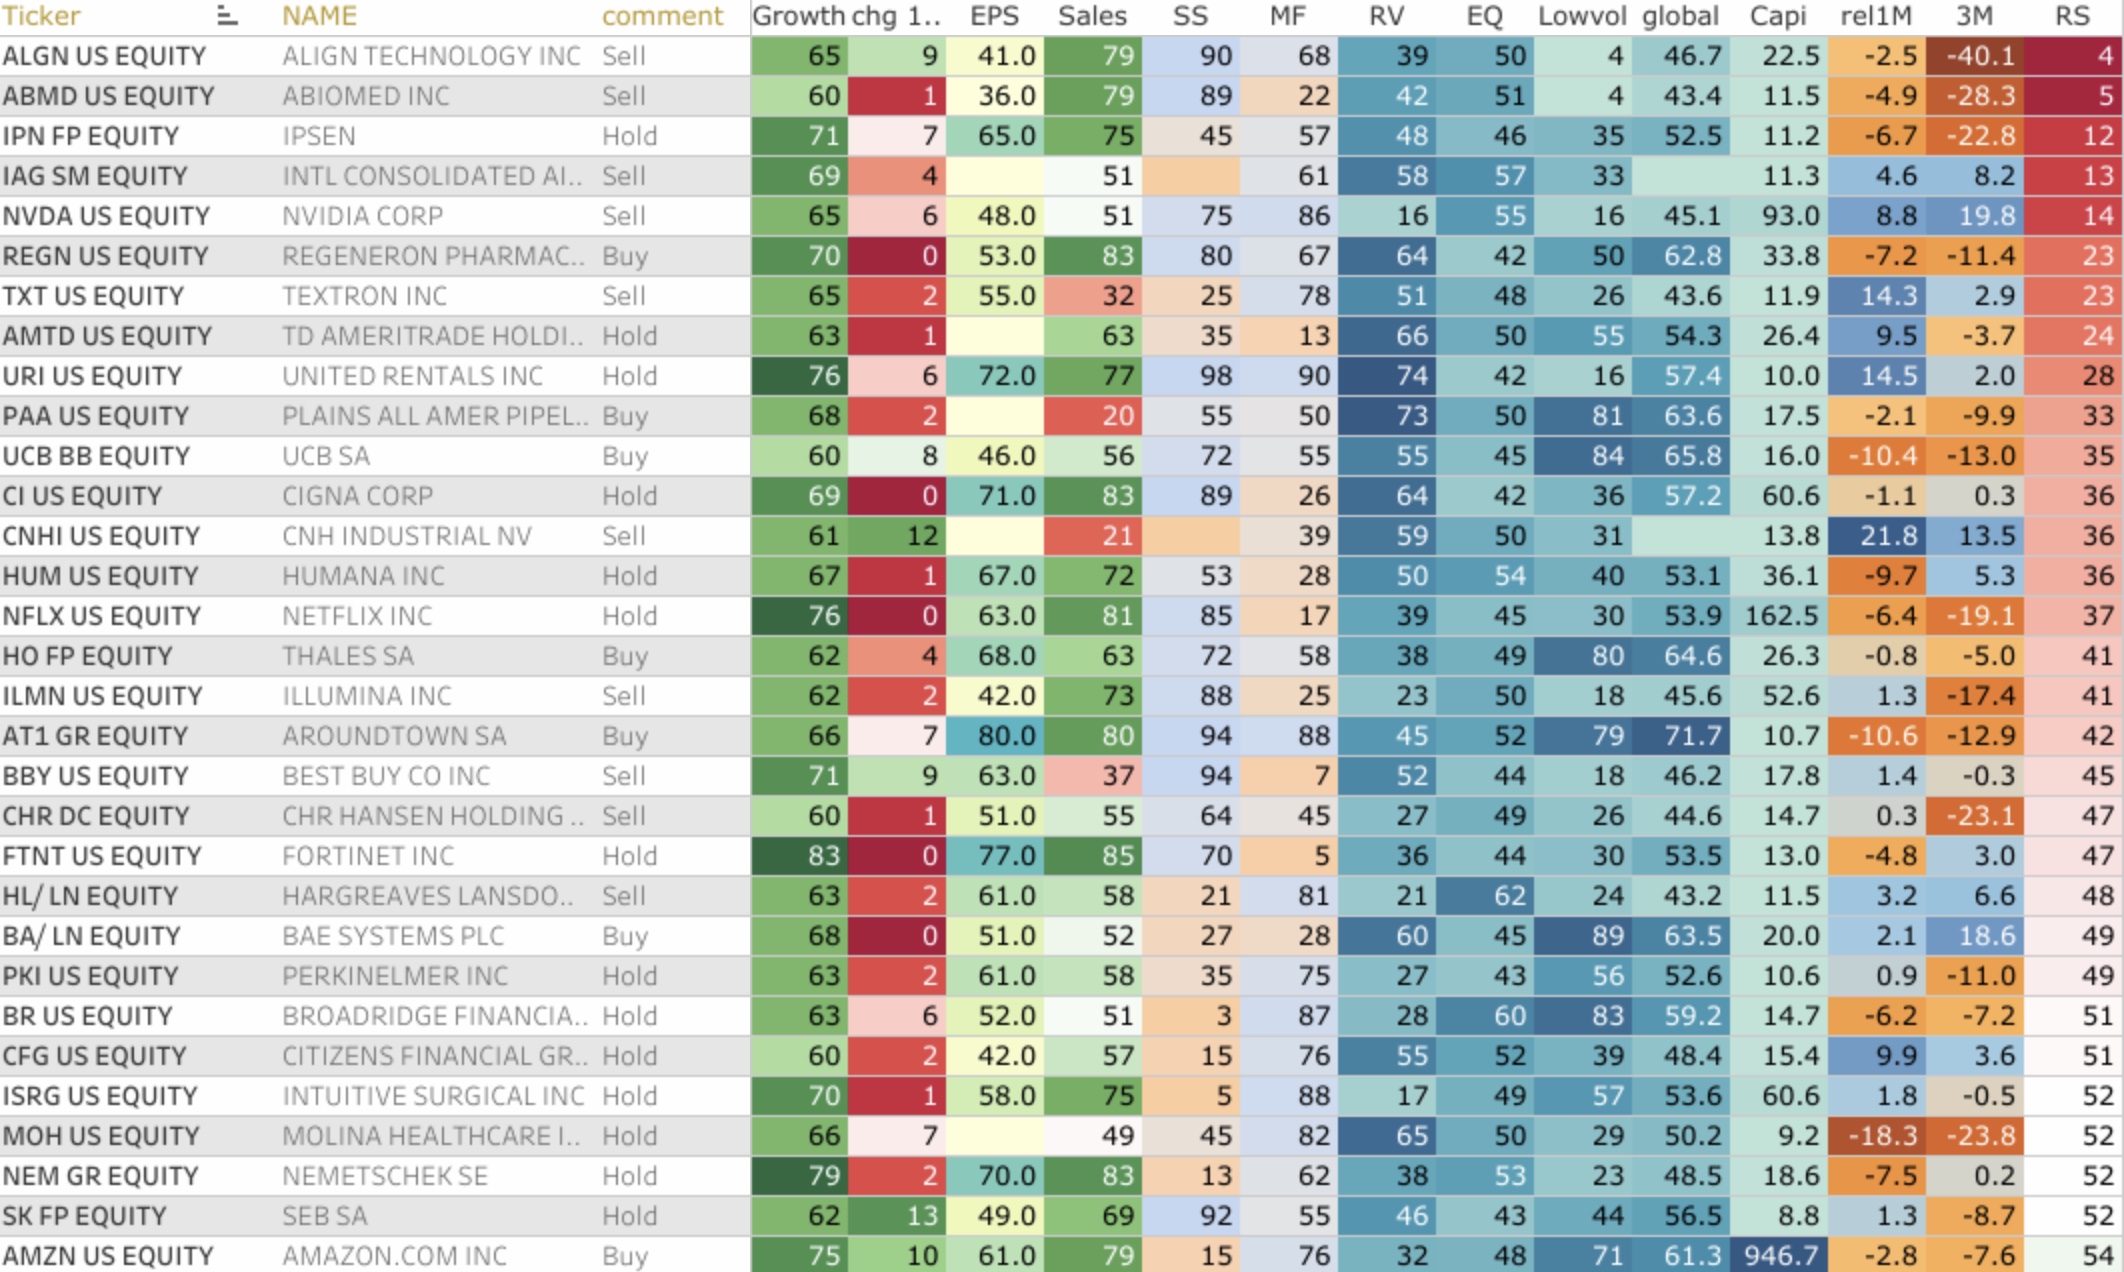
A lot of these names are part of our current quantamental european and us portfolios. We find the following names to be attractive: netflix (we initiate an important convexity exposure into its coming earnings), align, united rentals, ipsen, cigna, fortinet and Amzn. Since the middle of August, Value stocks have mean reverted and jumped sharply taking many investors by surprise. In contrast, Momentum, Quality, Growth and low Volatility stocks have fallen sharply. These moves suggest investors are starting to discount a ‘Recovery’ in the cycle. The key question is whether the recent shift is a short term reversal (short covering) or the start of a more significant rotation (fundamental in nature)? From a top-down perspective the QMI (Quant Macro Index) has improved in September, and at levels that we associate with a trough, from a bottom-up perspective 1) extreme valuations, 2) mean reverting correlations, and 3) a potential peak in defensive style profit expectations suggest the rotation towards Value is likely to be more sustainable.
Why market shall rise until 2020 or 2021 ?
And in 2021, President Xi Jinping and China celebrate the centenary of the founding of the Chinese Communist Party. While President Donald Trump is doing his utmost to ease and make sure the U.S. economy is really juiced up for 2020, Xi Jinping has to have the same occur with China’s economy in 2021. There are clearly defined political dates by which they need the economy to be rosy. People argue that the Fed made a policy mistake by raising interest rates in December. China also made a policy error by introducing draconian tightening measures for the banks to address wealth management products and account for bad loans. And in May and June of last year, China experienced a credit crunch—coincidentally, that was when the trade dispute began escalating. So China has two parallel problems: trade, and it over-tightened. The Chinese authorities do need to put a floor under the economy, because employment conditions have been deteriorating for almost a year. Like the Fed, the People’s Bank of China is very sensitive to unemployment numbers and job growth. Again, there are quite interesting similarities with the U.S. Last year, instead of doing the normal fiscal pump-priming or infrastructure spending, the Chinese authorities did a large-scale overhaul of personal taxation rates, centered on lower-income households. Recently, it did interest-rate reform that essentially pushes the banks to bring down lending rates to be more in line with the rates at which they borrow from the central bank. That would lower refinancing costs for small and medium-size enterprises, and also bring down mortgage rates. Very recently, the Chinese authorities again announced that they will review tax packages. A very Western, consumption-led type of stimulus is being introduced. And, as in the U.S., China has been trying to bring down long-term rates. There are a lot of similarities between what’s happening today and what we experienced in the late 1990s. Back then, central banks were just getting accustomed to low inflation rates. Today, they’re worried about deflation. The U.S. today, like in the ’90s, was the major focus of global growth. The late ’90s spawned the growth of the internet and digitalization. Today, we have a very big sea change in the frontier of technology applications, artificial intelligence, and cryptocurrencies. And back then, the Fed eased only to take rates back up again. That could happen in this cycle. The yield curve in the U.S. is not fully inverted. It’s kinked around the five-year duration, and onward it starts to steepen. This is the scenario we’re using for clients.