In this « every day » updated letter, you will find our current view based on our regional matrix, our fundamental convictions and our charts. The current Market Focus are analysed. Then, you will find our major thematics for the year. Quantitative factors and fractals currently driving the market are presented with the weekly change of our quantamental portfolios. Coming events and earnings are also anticipated. This is a very long letter, so just jump where you have some interest.
Julien Stouff, 2022
Real time letter June: Market focus switches from inflation to recession
Quick links
- S&P500 Charts and trading plan
- Our matrix
- Positioning and recent changes
- Semiconductors
Parodos
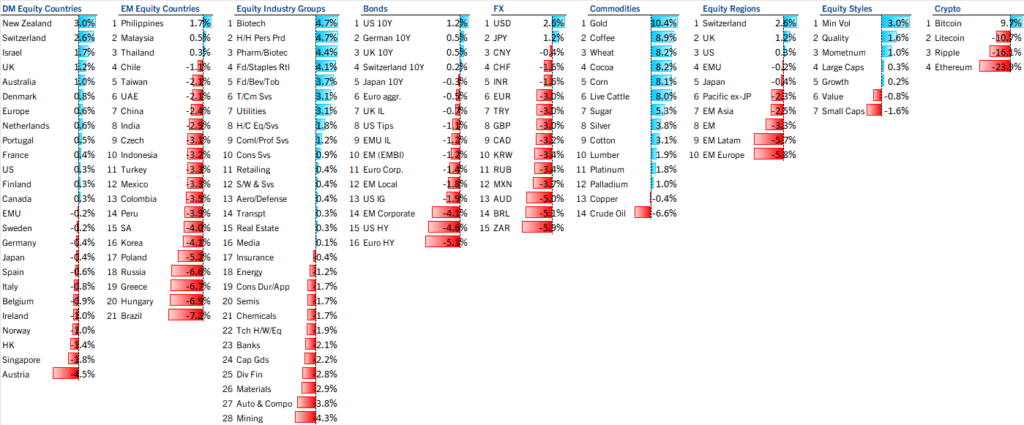
June 30th marks the completion of the first half of 2022 and it has been tough. Coming off the worst first-half since 1970, with the Nasdaq Composite has given up 28.55% year to date, the S&P 500 a mere 19.88%, equities still face a triple whammy of sticky inflation, recession risks and the threat to corporate profits from sinking consumer confidence. After just about everyone on Wall Street got their 2022 predictions wrong, investors are now focused on a toxic mix that spells stagflation, as well as more damage to valuations. Will they be wrong again for the second half of the year with their very pessimistic scenarii ? We think markets choose between 2 scenarios for the coming weeks as a function reaction to the market focus having switched from inflation to recession. On one side, (1) a pricing of the recession (the US economic surprise index has posted its second largest 1-month drop in nearly 20 years with the recent US ISM miss) implies negative earnings revisions and a S&P500 falling to 3000/3200. Kairos, our Market Cycle Matrix expects a switch from the current Fall (lower growth, higher inflation) to Winter (inflation receding with low growth). This would be a recession induced by Fed policycoming alongside a massive inflation shock…not the result of any large structural imbalances being unwound. Earnings reports from some of America’s biggest retailers have added to concern that the highest rate of inflation in four decades is catching up with U.S. consumers and pitching the economy toward a recession. The table below shows which countries/ sectors outperform and underperform in Winter. Mining, Materials and Financials are the worst performers. We understand Winter interferes with a super commodity boom so history may not repeat. We nevertheless think those stocks are now at risk as equities enter a bear market.
On the other side (2) the Recession word helps bond rebound and dollar correct, supporting the Tech/ low vol /Ark cohort and emerging equities. Indeed, with investor sentiment and positioning low, relatively modest shifts in the macro outlook had triggered a bear market rally, with better newsflow out of China (easing of monetary policy and covid restrictions) and hopes that the Fed may slow policy tightening into the Fall. All in all, 2022 is playing out in ‘four acts‘: uncertainty around growth, inflation, policy and geopolitics in 2Q (‘Act 1’); A moderation in inflation and better growth, helped by China with the lockdowns end, in July, creating the first significative bear market rebound (‘Act 2’) – with inflation receding and growth somehow reaccelerating.; Then (‘Act 3’) the largest QT episode in history gets under way . QE-sensitive assets may struggle again with uncertainty until QT actually begins (‘travel versus arrive’). In Act 4, probably with a S&P500 around 3200, voire 3000 and in Q4 or Q1 2023, the Fed pauses when Fed funds near 3%, or we get a geopolitical amelioration. We are probably switching from act 1 to Act 2 now, as Valuations now are also significantly less demanding, with global stocks rerated to 15.3 times forward earnings and the benchmark U.S. Treasury note’s 10-year yield easing to 3.05% from a recent intraday high of 3.50%
Coming events susceptible to move the market this week can be found here. The main changes of our quantamental portfolios are described below:
Trades recap and Quantamental portfolios
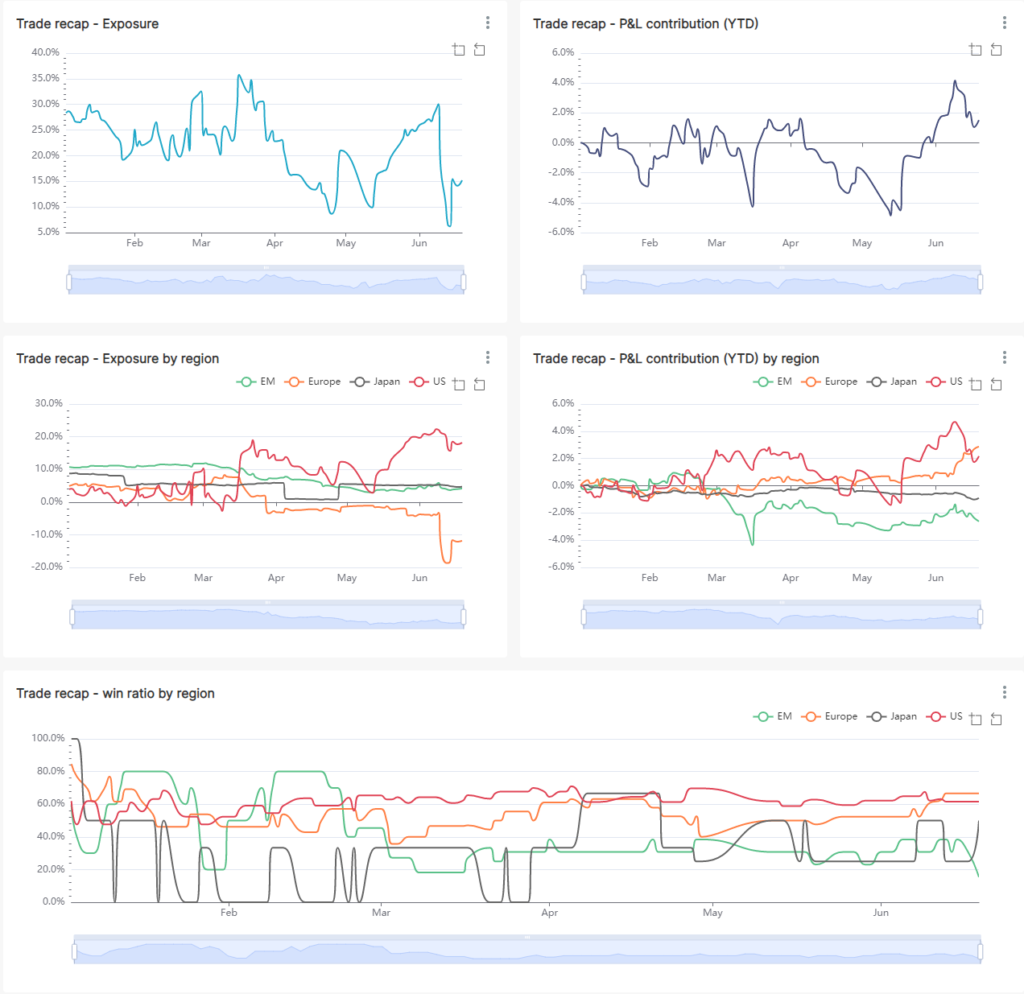
The table below shows the evolution of the net exposure and Profit and loss based on the various trades sent by mail. As of June 9th, trades have produced a +4.15% gross result. The win ratio has rebounded to 56%. Net exposure near the top of its range at 30% on June 9th fell to +10% post ECB and US CPI.
Big changes – we have initiated a risk-on by closing hedges in US and Europe, with a new short in UW Japan.
We are now net long +30 to 45%, in reaction a CPD buy in US, Europe and China. That CPD will be cancelled if global equities break their lows. OW US, OW Europe, UW EM & Japan, OW China. In Sectors, OW Health-care with Sanofi, Pfizer, Merck, Strauman; while OW all energy has been trimmed (recession or Winter is negative for the sector), OW Telecoms with DTE GY. We have no more FAANG in the portfolios except Netflix (becoming a Value name). We are UW banks as they suffer directly from Winter. On June 9th on ECB meeting, we added downside convexity on the DAX and sold short Siemens and FTSE, a pure value proxy. Indeed, except energy, we are now cautious of OW in value as we enter Winter: nowhere to hide except long convexity. We also initiated contrarian shorts in some US materials and stocks like Arcelor Mittal, but in a balanced way buying Mosaic in a dip. With respect to China, we closed our short in US and EU companies with high sales in China, even adding name like Moncler (see quantitative chart below).
Please go directly to our daily trading plan here…


Our regional SC portfolios can be found here. On the top right corner, under Portfolio name, select any of our portfolios (SC SPX long for the US quantamental portfolio, SC SXXP long for the European portfolio, etc…). Then, all the components of the selected portfolio are sorted by sector, with their respective quantitative grades and recent performance measures. These portfolios are updated at least on a weekly basis after the calculation of the quantitative grades of our universe of the most liquid global stocks. First, our algos identify the best companies based on their respective 6 factors, which are weighted with respect to the current market cycle. Then, this purely quantitative crop of the cream is generally halved based on fundamental/ thematic/ risk-reward/ esg or other discretionary purposes.
Main market focus for the near future are enumerated below:
Market focus – What drives markets currently ?
China positive newsflow – (1) China govt concludes investigation into three US-listed names with regulators preparing to lift a ban on new users as early as this week; (2) China reopening continues as Beijing allows indoor dining and Shanghai returns to normal after two months; (3) US mulls lifting some China tariffs to fight inflation; (4) White House set to pause new tariffs on solar imports for two years, (5) China’s midyear online shopping promotion paves the way for consumption recovery. “US Commerce Secretary Gina Raimondo said on Sunday that President Joe Biden has asked his team to look at the option of lifting some tariffs on China that were put into place by former President Donald Trump, to combat the current high inflation. (Reuters)
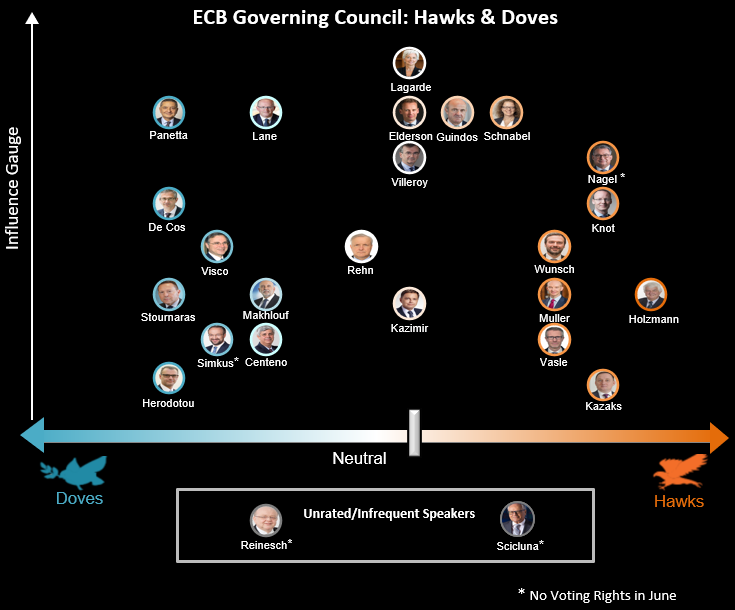
Major Monetary policy catalysts: (1) ECB —The European Central Bank laid out plans to increase interest rates for the first time in more than a decade. The ECB said in a statement that it intends to raise its key rate by a quarter percentage point at its next policy meeting in July to minus 0.25%, and increase it again in September, possibly by a larger amount, with no pre-commitment to slowing back down to 25s. The ECB staff forecasts now look for headline and core inflation at 2.1% and 2.3% respectively in 2024 – this is a clear hawkish admission that they are well behind the curve… The ECB will likely be forced to meaningfully revise up their inflation forecasts in Sep precisely at the time they open up 50s…hence, I struggle to see one 50bp hike only…my rate hikes will be multiple. Now calling for 25bp in July, followed by 50s in both Sep and Oct… We are now priced to reach ~1.85% next May and finish 2023 at just above 2%. The ECB will also end its large-scale bond-buying program on July 1. Ms. Lagarde said the ECB would act to avoid “fragmentation” of its monetary policy—a code word that indicates the bank is ready to buy the debt of fragile eurozone governments like Italy’s, if needed, to avoid what it considers an undue increase in market rates: the details of the anti-fragmentation tool (discussed at an emergency meeting this week) remain to be seen but suggestions centre around a yield cap + flexible reinvestments. Flexible reinvestment likely means funds from maturing core countries’ debt on the balance sheet are re-routed to the periphery to support spreads. GS estimates that over 6m that will be worth 86bn in total redemptions, 60bn of which come from the core. If the ECB were to completely skew this to periphery, and then distribute by capital key, Italy would receive nearly half or around 30bn of extra purchases over the next 6m (Italy cap key ~17% vs ~34% total periph). This compares to ~145bn of gross issuance expected in 2022 H2. Also, Bloomberg reports that President Lagarde “told euro-area finance ministers that the ECB’s new anti-crisis tool will kick in if the borrowing costs for weaker nations rise too far or too fast” implies a relatively robust yield cap. Tackling the fragmentation issue head-on allows the ECB to hike through the neutral rate, taking policy rates into restrictive territory and should allow the EUR to appreciate and deliver a strong tightening in EUR FCI. Just what the doctor ordered.. But, before all that is enacted, As we mentionned on our trading alerts (short Siemens, long put dax, short FTSE), we are worried that the ECB is destroying the Draggi put, set up in July 2012, or the famous »what it takes ». Thus we also decided to close our European value call.
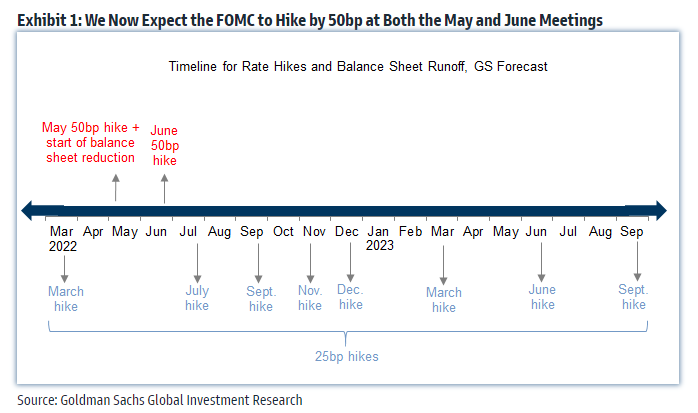
FED – (2) FRIDAY’S CPI INFLATION BEAT WAS IMPORTANT. Headline came at 8.6% yoy (vs consensus +8.3%, last +8.3%)…Core printed at 6.0% yoy (vs consensus +5.9%, last +6.2%)…looking at the breakdown the key was elevated levels of shelter and auto inflation…the stickiness of shelter is meaningful in raising the odds of inflation persistence, putting even more pressure on the Fed… durable goods demand should be moderating from high levels, and as bottlenecks ease, goods disinflation takes some of the pressure off headline and core. But what if the pressure in durable goods – which is a hangover from the pandemic economy – is replaced by the same kind of oversubscribed demand in the services sector? the sharp rotation from goods to services activity (as the post-pandemic economy normalises) will be the next source of inflationary pressure. An example of this is the travel sector – Wizz air reported this week that bookings were +50% higher than their 2019 levels (at a time when jet fuel prices are rocketing up as well) and there are global reports of ongoing air travel chaos caused by worker shortages/strikes and frenzied demand. Then the debate will be…do the Fed go “all in” to crush inflation or do they decide to live with higher structural inflation …
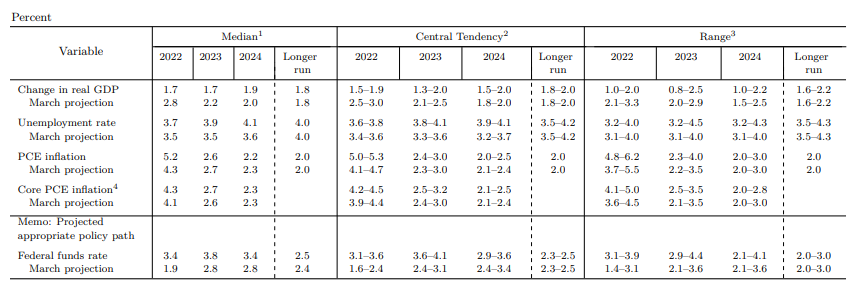
(3) THERE’S NO DOUBT THAT THE FED IS TAKING THE PROBLEM SERIOUSLY NOW… as they dropped the line “the Committee expects inflation to return to its 2 percent objective and the labor market to remain strong” which is an implicit upgrade of the relative importance of the inflation mandate vs the employment mandate…and given that it came with a 0.5pp rise in the unemployment rate by end-2024 (from 3.6% to 4.1%), it suggests the FOMC is willing to soften the labour market in order to bring down inflation. This fits with the argument that’s been articulated by Gov Waller that “we can worry about the employment leg, but if inflation expectations come un-anchored, we’ve got to put that aside and get those expectations re-anchored”. Whilst the FOMC still projected a growth rate of 1.7% for both 2022 and 2023 (far from deep recession), there has never been an increase in the unemployment rate of 20bps per year without a recession. The Fed is clearly telling us they will put aside all other considerations for the sake of controlling inflation.
The third increase in the target rate preceded negative to somewhat flat returns with below-average win rates in the first month. While medium to long-term performance is positive, some win rates are less than historical averages. The 1973-80 signals was the last time inflation levels were similar.
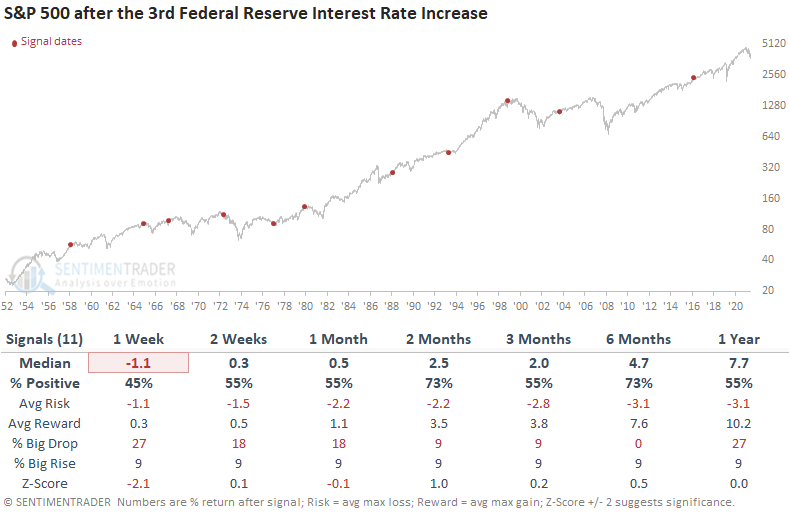
Interest rate-sensitive groups tend to struggle, especially the automobiles and components industry. One should keep a close eye on the financials as they typically provide a vital message concerning credit. Not surprisingly, defensive groups like staples and health care perform better, and commodities tended to perform well.
(4) – THE BOE AND BOJ STAND OUT AS BEHIND THE CURVE…especially after the SNB stepped up with a surprise hike. Whilst the BOE under-delivered vs market pricing by hiking just 25bps, their forward guidance was more hawkish. The BOJ face a similar fx vs policy trade off…despite the recent sharp depreciation of the Yen, they decided to keep Yield Curve Control (YCC) in place, making them the outlier amongst G7 central banks with an ultra-loose monetary policy. Given core CPI will likely hit 2% this summer and the decision to stick with YCC will likely drive USDJPY higher in the short term, the market will likely rightly keep building pressure on the BOJ to act. There are increasing tones in Government officials’ speeches that FX depreciation is undesirable and Governor Kuroda has clearly used up a lot of political capital keeping YCC in place…so unless there’s sharp downside in growth vs market expectations, the BOJ will almost inevitably need to walk away from the YCC policy or risk losing control of inflation expectations. Watch this space. We keep our short on NIkkei…
PEAK LIQUIDITY – THE ART OF TRAGEDY, FROM QE TO QT – Quantitative Tightening looks like QE in reverse. Instead of creating central-bank reserves (held by the private sector) by purchasing bonds, the central bank drains reserves by refraining from reinvesting as bonds mature. The three channels through which qe works also operate in reverse. First, qt sends a signal that rate rises are coming. The peak in excess money supply/ excess liquidity is behind us and the steep downshifting in QE expected for 2022 and 2023 is set to significantly shrink both narrow and broad liquidity over the coming two years. With asset purchases ending in March, the Fed faces a decision over what to do with the extra $4.5 trillion in Treasuries and government-backed mortgage securities. QT is the real worry: It’s when the Fed does the harder job of shrinking its $9 trillion balance sheet. When the Fed embarked upon balance-sheet normalization in 2017, then-Fed chairman Janet Yellen suggested it would “run quietly in the background”. Back then, the balance sheet was half today’s size and, there is a growing sense that Fed officials realize the asset purchase program in response to the pandemic has been too big and lasted too long. If you assume a relatively aggressive pace of run-off, say ~100bn/month, then you take the balance sheet from ~$9tn to $6.5tn in the next two years… Looking at the numbers you can assume roughly 400-500bn of annual MBS runoff + ~200bn in USTs …so call it 600bn of MBS+UST which is 1.35trn over 2.25y…which is roughly 5.5% of GDP…so 4.5bp*5.5% = 20-25bp impact on UST yields – with most of that impact in real rates and assuming the treasury replace a significant portion of lost Fed financing via bill issuance.

Real US long term yields have rebounded to a positive level (see chart above) at +0.82% . The steep rise from March 31st has generated a longer consolidation for equities. Indeed, unlike the last 6 times, the correction is longer and stronger: we are switching from the Art of Tragedy, meaning the expectation of the first rate hike to the effective rate hikes and switch from QE to QT. It finally let real yields rise strongly, and by ricochet hurting more pronouncedly equities. It’s worth noting the 10Y UST yield fell more than -30bps the last week of June to settle in near parity with the 5Y. Markets are now pricing in ~7 more 25bp hikes by the end of this year but have also recently begun to reflect expectations for rate cuts coming in early 2023.
Our research report The Art of tragedy analysed in March 2021 what the impact can be on stocks from the start of tigntening conditions; the below chart shows that the Art of Tragedy has not derailled bull markets but instead created many intermediate corrections. In the below chart, we extrapolate past tightening on the path of the S&P500 (black Long dash line) and the US 10YR (blue line). After a correction period (ending in dec 22 or march 23), both rebound to new highs.

Peak liquidity is being followed by peak fiscal reform. After governments pumped in fiscal and monetary stimulus totaling $23 trillion globally in 2020 and another $9 trillion in 2021, their policies are reversing dramatically this year, draining $2 trillion.
What charts tell us
S&P500
The S&P500 had reached a long term support (below charts, dark line) at 3810, started a bear market rally towards 4170, and fell back to new lows at 3630. 3500 is the next target and ultimately 3195. Based on history, there probably are a few more months of pain ahead for the bulls. There have been 19 U.S. equity bear markets over the past 140 years with an average price decline of 37.3% lasting 289 days. If past is prologue, this bear should bottom on Oct. 19 with the S&P 500 at 3000.
Chart 1: game plan on the S&P500 weekly – Bear market towards 3500/ 3200

Chart 1b: game plan on the S&P500 daily 12 month – breaking down the bearish channel

Chart 2b: game plan on the S&P500 intraday – NEW ESU2

Since the June 17th low in ES, we have essentially rallied everyday. Tuesday 29th June was the 1st pullback of this rally leg off the lows, and the 1st pullback after a breakout or rally looks like is critical to define what comes next. Pullbacks are healthy, but they *must* hold the levels that triggered the breakout originally, and/or critical retracements like the 50% fib retrace or 61.8% fib retrace. The overbought RSI was a big concern (see on June 24th, the strong overbought RSI), and is now resolved with yesterday deep selloff. It has plenty of room to cool down still, which suggests rocky waters still ahead”. Price chose the deep selloff route, triggering the bear scenario outlined in yesterdays newsletter to 3855, 3805. The good news? The RSI is now corrected.
Bulls absolutely needed a good upside move to close the week and start July as the seasonality suggests, and they delivered. July 1st is seasonally the most bullish day of the year on average, green 85% of the time over the past 20 years, and the seasonal tendency tracked today with a firm green day. July in general is a seasonally a very strong month (third strongest on average), after a fairly bearish seasonal May to late June which tracked – the seasonals are good context to keep in mind while taking into consideration the technical setup. It was absolutely critical bulls put in a green day today and defend the 3800 level, which keeps the setup for continued relief rally in play. We broke out of this level last Friday, and held it today. The question now becomes, can bulls keep it going?
To start, its important to remember how critical the 3800 zone has been. It was last Friday, one week ago, that we broke out of that level. We had been building a base under it for two weeks (shown by the dotted red line in the above chart). This resulted in a 4%+ rally that took us to 3950. We then sold off to back-test it (Technical analysis 101, levels that trigger breakout moves often back-test). It was a major battle around this level for most the week, but bulls reclaimed into the close, which puts the upside case firmly in play as long as it keeps holding next week.
There are now two major structures worth watching, both of which are likely familiar: 1) The dark red declining channel. This is a picture perfect downtrend channel with two resistance touches, and three support touches. We hit support at 3630 in mid June, and channels usually fill out. This is bullish overall.
The second structure to watch however, is not bullish. This is the channel that is rising inside the red dark channel. Note that this channel is also perfect: It has two support touches, and two resistance touches. The problem? A channel that forms in a downtrend and slopes against it is the classical definition of a bear flag, and therefore, has downside risk if it breaks down at 3755 now.
I reconcile these two structures by leaning towards the bear flag filling out for another leg up, with resistance now being 4015. As always though – and this is very important – this is forecasting.
On to Monday/Tuesdays action:
- In yesterdays newsletter, I said I’d be triggering longs either on the recapture of 3765-75 or 3790, and both those worked well today. I am currently holding a maximum long over the long weekend, since we have broken out.
- Supports Monday/Tuesday are now: 3810, 3790, 3755-65. 3755-65 is support of the bear flag and we selloff hard below there to 3705, 3675, 3650, 3575, 3500. If we lose 3755 we’d likely drop all the to 3675 or 3650, bounce, then head to new lows
- Resistances Monday/Tuesday are: 3845-55, 3895-3900, 3935, 3985, 4000-4015. I’d trade level to level, but 3895-3900 is a big resistance and we probably reject there and build a multi-day sideways base before continuing up.
- Bull case (my lean): Would like to see continuation up the levels to 3895-3900, dip, build a base sideways, then up. I would certainly lock in some gains at 3845-55. In terms of supports, one could buy the 3810 or 3790 backtest, but I have 0 interest in longs below 3790. Best bet is to wait for those supports to test then spike out back into 3820s to get long if you want more confirmation.
- Bear case: Bear case is easy here and begins if the bear flag breaks down at 3755-65. Below 3790 is a major warning shot. I’d be getting short probably mid 3740s for a move down to the levels mentioned above. 3705, 3675 1st targets.
In summary: General lean is the bull case shown above. However, today was low volume pre-holiday trading so the action must be taken with a grain of salt. Recall that Monday futures are open until 1pm but the NYSE is closed, which will also make it a very low volume trading day. I’d like to see bulls push this to 3895-3900, dip, then up but will be prepared to react to whatever happens, bull or bear, and would be very excited to take the short if we fail.
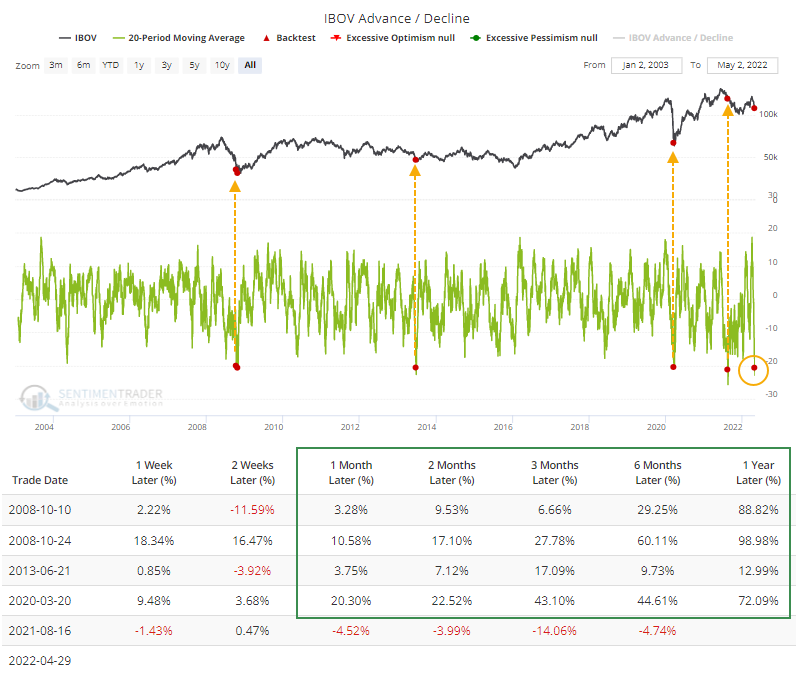
Sentiment stretched into the excessive pessimism zone
We use our Sentiment grades as a contrarian tool: when investors are greedy with their too exuberant Sentiment, we add downside convexity (but out the money Put) when markets are bullish and/ or reduce our long. We can even go short if a CPD (Change Point Detection) condition is enacted. To the contrary, when investors are too pessimistic, we add some longs in a bullish market, or even pass net long in a bearish market.
Our US SC Sentiment indicator has given a contrarian bullish signal in May: it reached 62%, just like at the low of January. This signal is based on many sub-indicators, such as the VIX reaching an extreme level, or the AAII survey showing a disguste for equities, among others. Sentiment has dropped close to pandemic panic levels. But again, this should not make you a buy all-in; sentiment goes like this, during a short-sharp (and then back to business) correction… but it can also go like this during the transition to bear market. I would say that with sentiment this repressed that the odds of a rebound is high, but also noting that bear markets are basically downtrends that do have plenty of short-lived rebounds and rallies.
Chart 3: SC US Sentiment indicator, short term signal and medium run still bullish

The chart above shows our two SC Sentiment indicator, one for the short and the other one for the medium run. Let’s analyse what they told us in the last 12 months: Sentiment toward stocks reached its peak soon at the end of 2020 (denominated extreme complacency in the bottom panel of the above chart). The speculative orgy heading into February coincided with a peak in some higher-risk assets but not the major indexes. Even as those indexes have trudged higher, sentiment has become less and less optimistic. Then, the ultimate rise of the S&P500 by the end of December triggered a contrarian sell signal from our Sentiment indicator. The January debacle has cooled down the Sentiment so much that our SC Sentiment indicators are now flashing green. In the above chart, the 3rd chart shows the ratio of Smart money Versus the Dumb Money” traders. When the Dumb money grade is down to less than 21%, the Win Rates for two weeks to 3 months in the table above are impressive. Still, with the character of the market seemingly in a state of change – and with more significant concern about a potential bear market – it can be helpful to look at action during previous bear markets. During those stretches, any rallies that may follow a Dumb Money Confidence signal tended to be short-lived (i.e., two weeks to three months).
Going into details or components of our sentiment indicators, the American Association of Individual Investors is full of fear. With the recent market sell-off, it has even fallen to the 19 level: fear is strong.

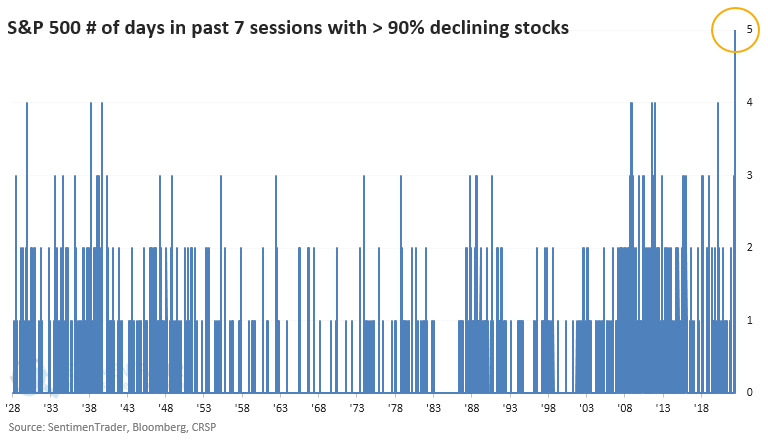
This week, stocks saw a historic bout of selling pressure. Over a 7-day stretch, 5 days saw more than 90% of stocks decline, a first since 1928.
- Stocks suffered a historic bout of selling pressure entering this week
- It got even worse, and over a 7-day stretch, the S&P’s internal damage was the worst-ever
- The selling pushed almost all stocks into short-, medium-, and long-term downtrends
- More than 90% of tech stocks have fallen into bear markets
- Inflation may get a reprieve if some commodities follow through on seasonal trends
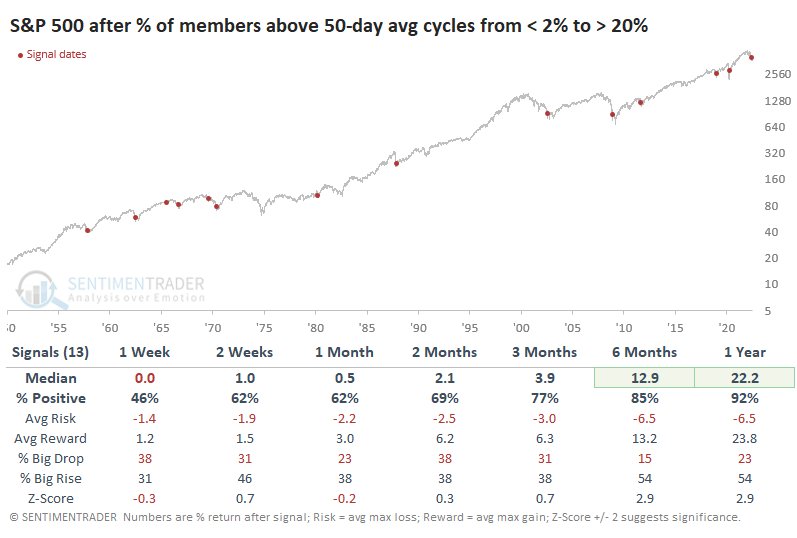
The recovery in the indexes showed broad participation. Recently, fewer than 2% of stocks within the S&P 500 were holding above their 50-day moving averages, one of the lowest readings in 70 years. Now, more than 20% have moved above their medium-term trend lines. The only times this happened in recent years marked the ends of bear markets.
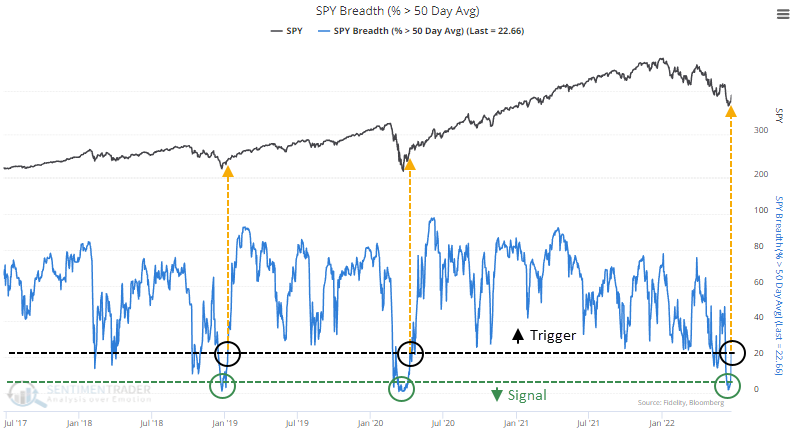
If we go back to 1950, it’s mostly the same conclusion. Out of 13 signals, only one of them failed to lead to a positive one-year return.
On volatility, implied volatilities have not worked’ during this bearish cycle. Volatility of actual puts are down despite the selloff, reducing the P/L of anyone who hedged earlier in the year (normally fixed strike vol rises in selloffs)… the VIX has now underperformed versus what its historical beta to SPX would imply 59% of the time this year with an average underperformance of -0.9v, because (1) little hedging demand from end users given low HF nets, (2) little put demand from exotics desks given the selloff has reduced client effective notionals, (3) vol markets discount a lot and offer poor sensitivity and leverage to market weakness, as 1y 1σ tails of 3,200-4,800 in S&P 500, 2.0-4.0% for US 10yr and US$70-160 in Brent illustrate the challenging breakevens for long-vol trades (4) which lead market makers to need to sell vol on a move lower. One reason equity vol didn’t explode at nearly the magnitude of rates vol yesterday was that the street does have capacity. – Recall the large SPX Put Spread Collar that we talk about each quarter comes due at the end of this month. The customer is long 43k SPX Jun30th 3620/4285 put spread vs short the 4695 calls. The only part of that trade with real greeks remaining is the 3620 put (which the customer is short, the street is long). This vanna profile means that as the market sells of towards that strike, the dealer community is actually getting LONGER VEGA. The gamma on the trade is also getting dealers shorter delta on the selloff so on each 1% selloff, dealers need to buy almost $1bn in S&P futures to cover that exposure. This is a total gift of a trade for dealers to have on in this tape and it is definitely helping keep things orderly in equities and equity vol on a relative scale. So volatility markets have been orderly and understated in their sensitivity to the weakness in risk assets. It still seems that Derisking/selling assets is a better choice than being long vol. Thus, we continue to hedge our long convexity with short VIX futures. Implied volatility and skewness would rise only if there is a new unknown…
FLOWS – In the last 4W there have been over $50bn of outflows from US equity funds, which is the worst since 2020 but not unprecedented… however previously when you saw such outflows from equities it went to bond funds – not so this time around as bond funds are also seeing large outflows…
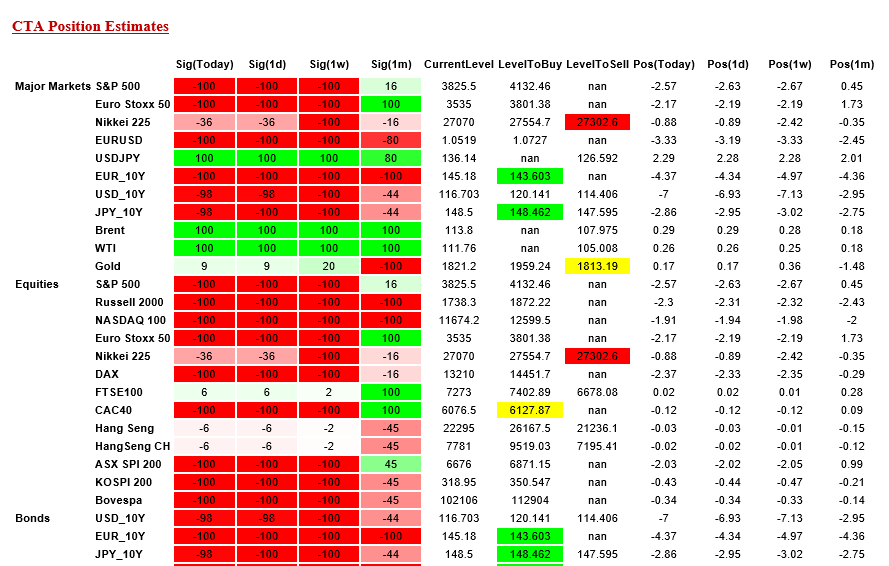
CTA positioning is shown on the above table. It shows that CTA are -100% bear on the S&P500, with 4132 as level to buy back. In other regions, CTAs have just sold Nikkei. They are fully short on Bonds.
In terms of gamma exposure from US market makers, Gamma is now long on the nasdaq, stabilizing the underlying. As shown on the below charts, it is slightly long for the SPX future.
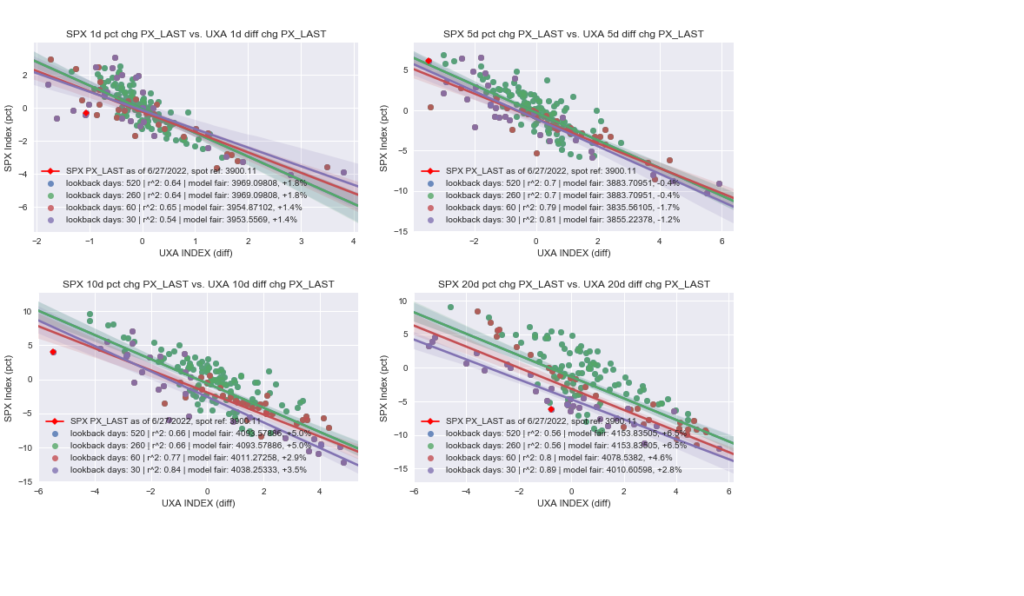
The 4 charts below show the relationship between a 1 day, 5days, 10 days and 20 days changes in the S&P500 versus changes in the Vix future. One can observe that the vix future is lagging (should be higher) the changes in the S&P500. (except for the last 5 days). Indeed, our VIX model currently gives a SPX future at 4000 instead of 3830:
What the research tells us…
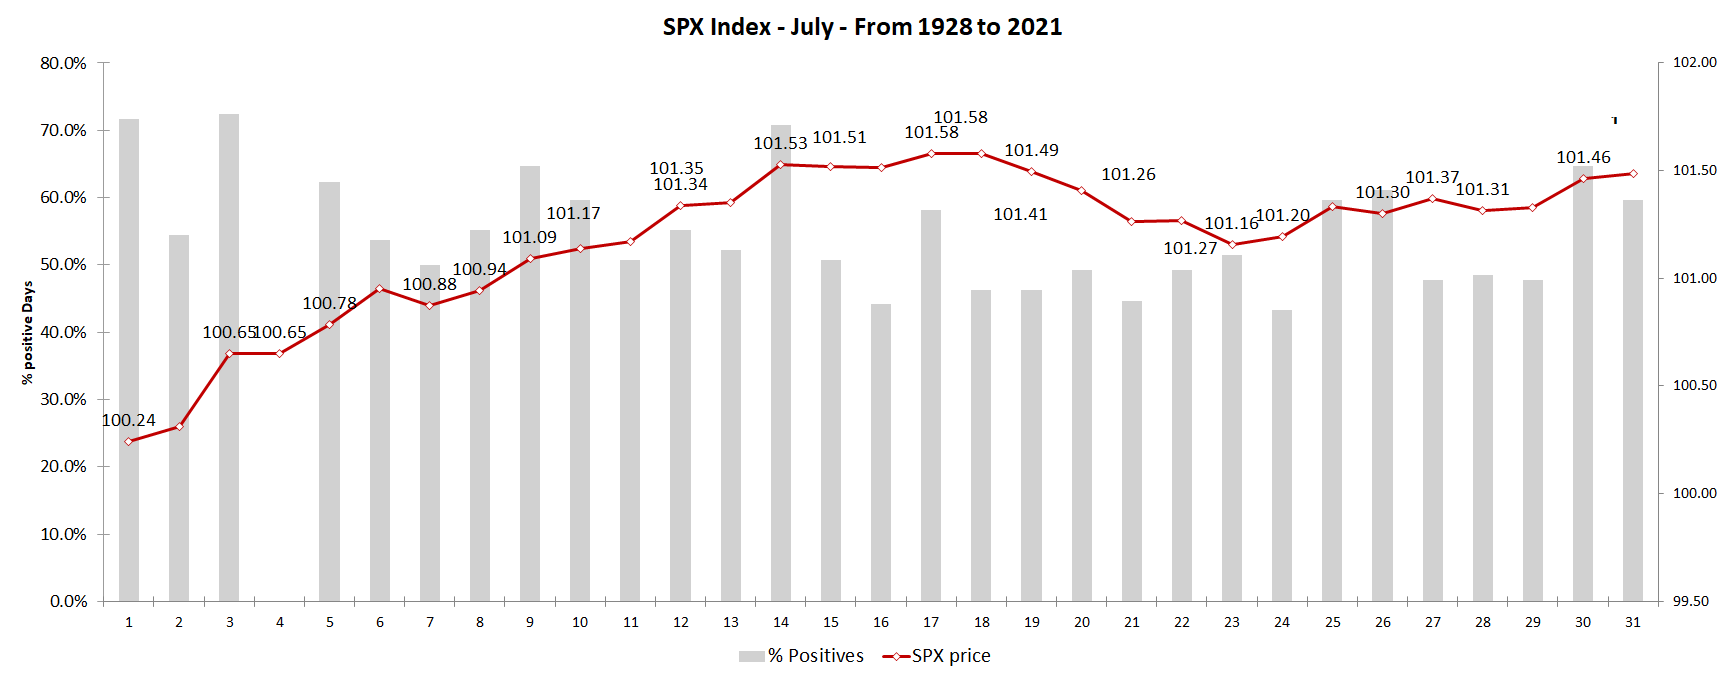
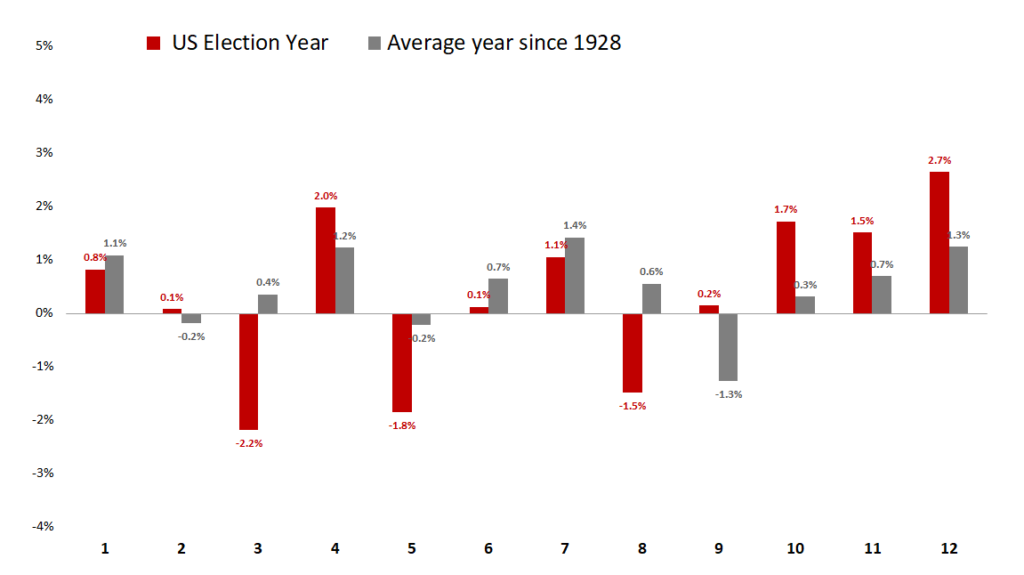
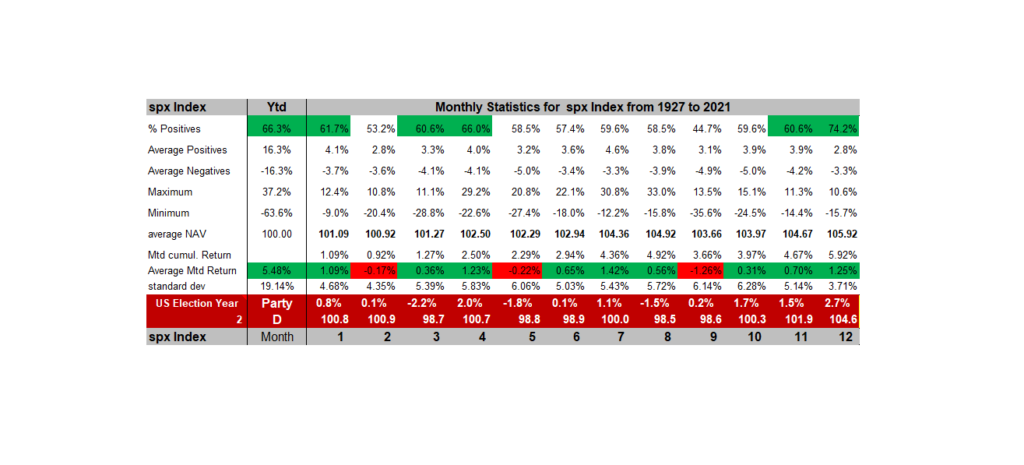

Seasonality is another headwind, with generally poor returns during the summers of mid-term election years. All these statitics on seasonality can be found here.
Global charts
With respect to global equities, the MSCI World has reached a wave V target at 580 and has rebounded since June 20th. 2 scenarii to watch: (1) either a contination of the fall towards 525 or a 100% extension at 525, which is also the 61.8% fibonnacci retracement of 2020/2022 rise, (2) or a rebound towards 656 and then 670
Chart 4: chart on the MSCI World daily :

Chart 17: Nasdaq 100 NDX – rebound on bearish channel support

Chart 18: Nasdaq 100 NQU2 – target 11,000

The Nikkei 225 Index had made a dog out of the prairie, below 25750, falling as low as 24750, before making an incredible rebound to its 200 days moving average. We have re-shorted the Nikkei at those levels for a first target at 26,000, but took profit on our short as low Yen entertains its outperformance over other global equities. It is currently moving around its Ichimoku cloud, but still outperforming global equities. Resumption of a bull market depends on 27945 MA 200 being broken up.
Chart 5: chart of the Nikkei – neutral and outperforming other equities

Chart 5b: chart of the Sentiment on Nikkei – contrarian buying level

The Dax is underperforming global markets for the last 3 years. It was specifically hurt when Russia attacked Ukraine in March, falling to 12,500. Since then it is outperforming global equities, and on the verge of breaking up its ichimoku cloud … After ending a bearish elliott wave pattern at 12,438 – it has rebounded to the 61.8% fibo retracement of 2022 sell-off with a high at 14,925 – on the ECB meeting, it reasserted its bearish trend… Ultimate downside target is 11,320.
Chart 6: chart of the DAX – back in bear market

Chart 6b: Intraday chart of the DAX – top of the range and underperforming recently global equities

The EURO STOXX 50 Index is capped by a 3810 resitance (bearish red trend line) and still supported on the black bullish line from March 2020 at 3520:
Chart 7: Eurostoxx50 – break of

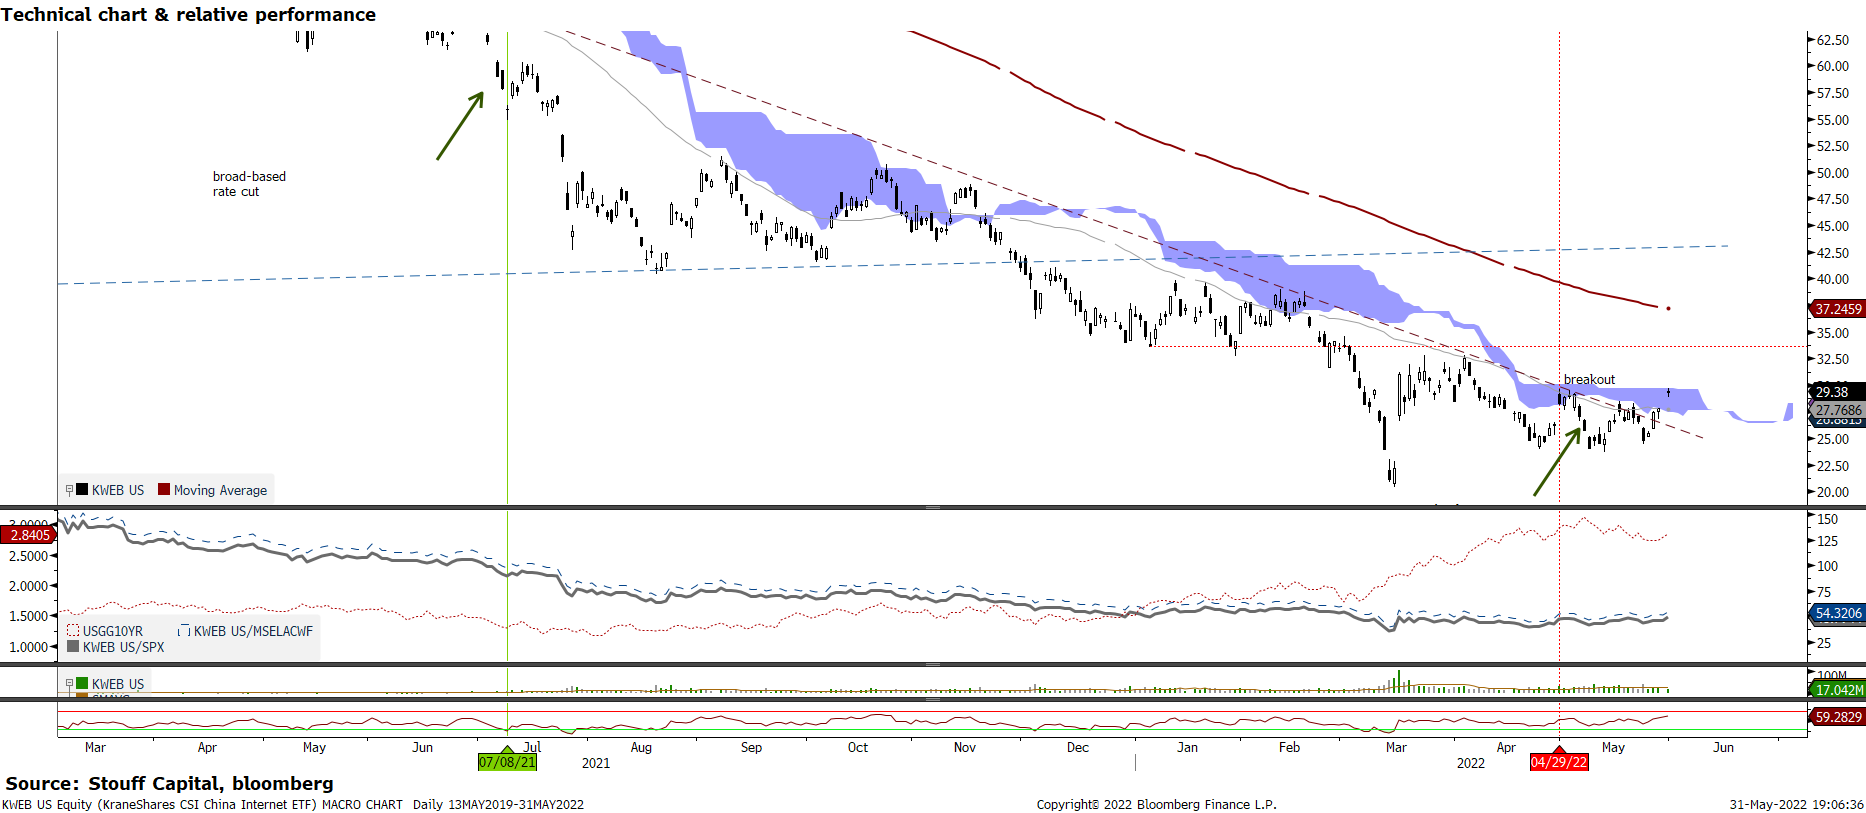
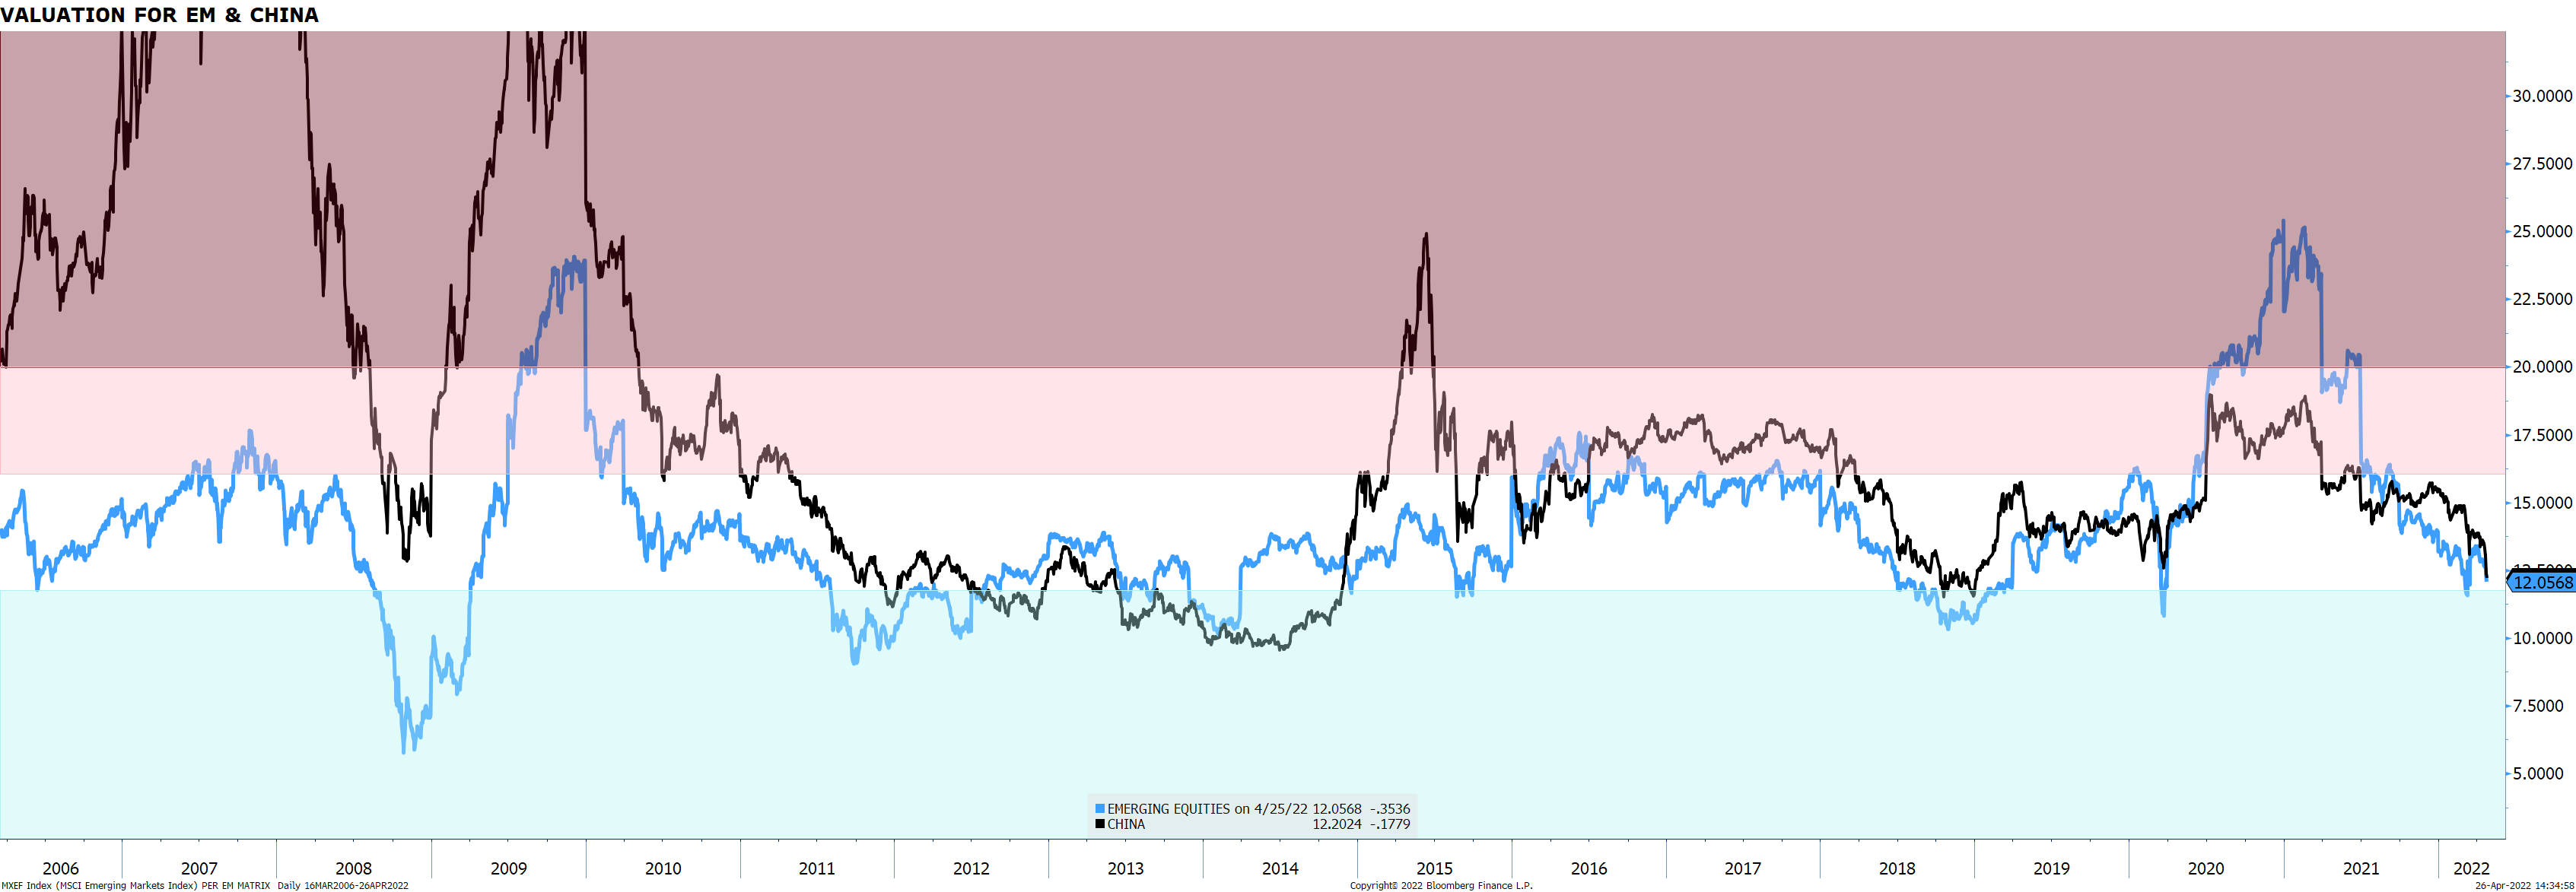
Chinese tech stocks are showing panic-level breadth. The most popular domestic fund for trading Chinese internet stocks KWEB, based on the CSI Overseas China Internet Index, has just over 50 member stocks, and it’s hard to find an uptrend among them. During mid-August, exactly 0% of these stocks were trading above their 50-day moving averages before bouncing. It’s an even uglier picture when looking at the percentage of these stocks in long-term uptrends. In recent days, only 4% of them have closed above their 200-day moving averages, ranking among the very worst readings in available history.
The plunge in late July caused more than 50% of Chinese internet stocks to fall to a 52-week low, only the third time in 15 years that so many have done so at the same time. Not only have they been falling to new lows, but they’ve also suffered gigantic drawdowns. Across the 53 stocks in the index, the average stock is down nearly 60% from its 52-week high. The only period that (barely) exceeded this rout was the depths of the global financial crisis. From a contrarian point of view, this is good news. in fact, Our SC sentiment China Grade is in a bullish CPD posture.
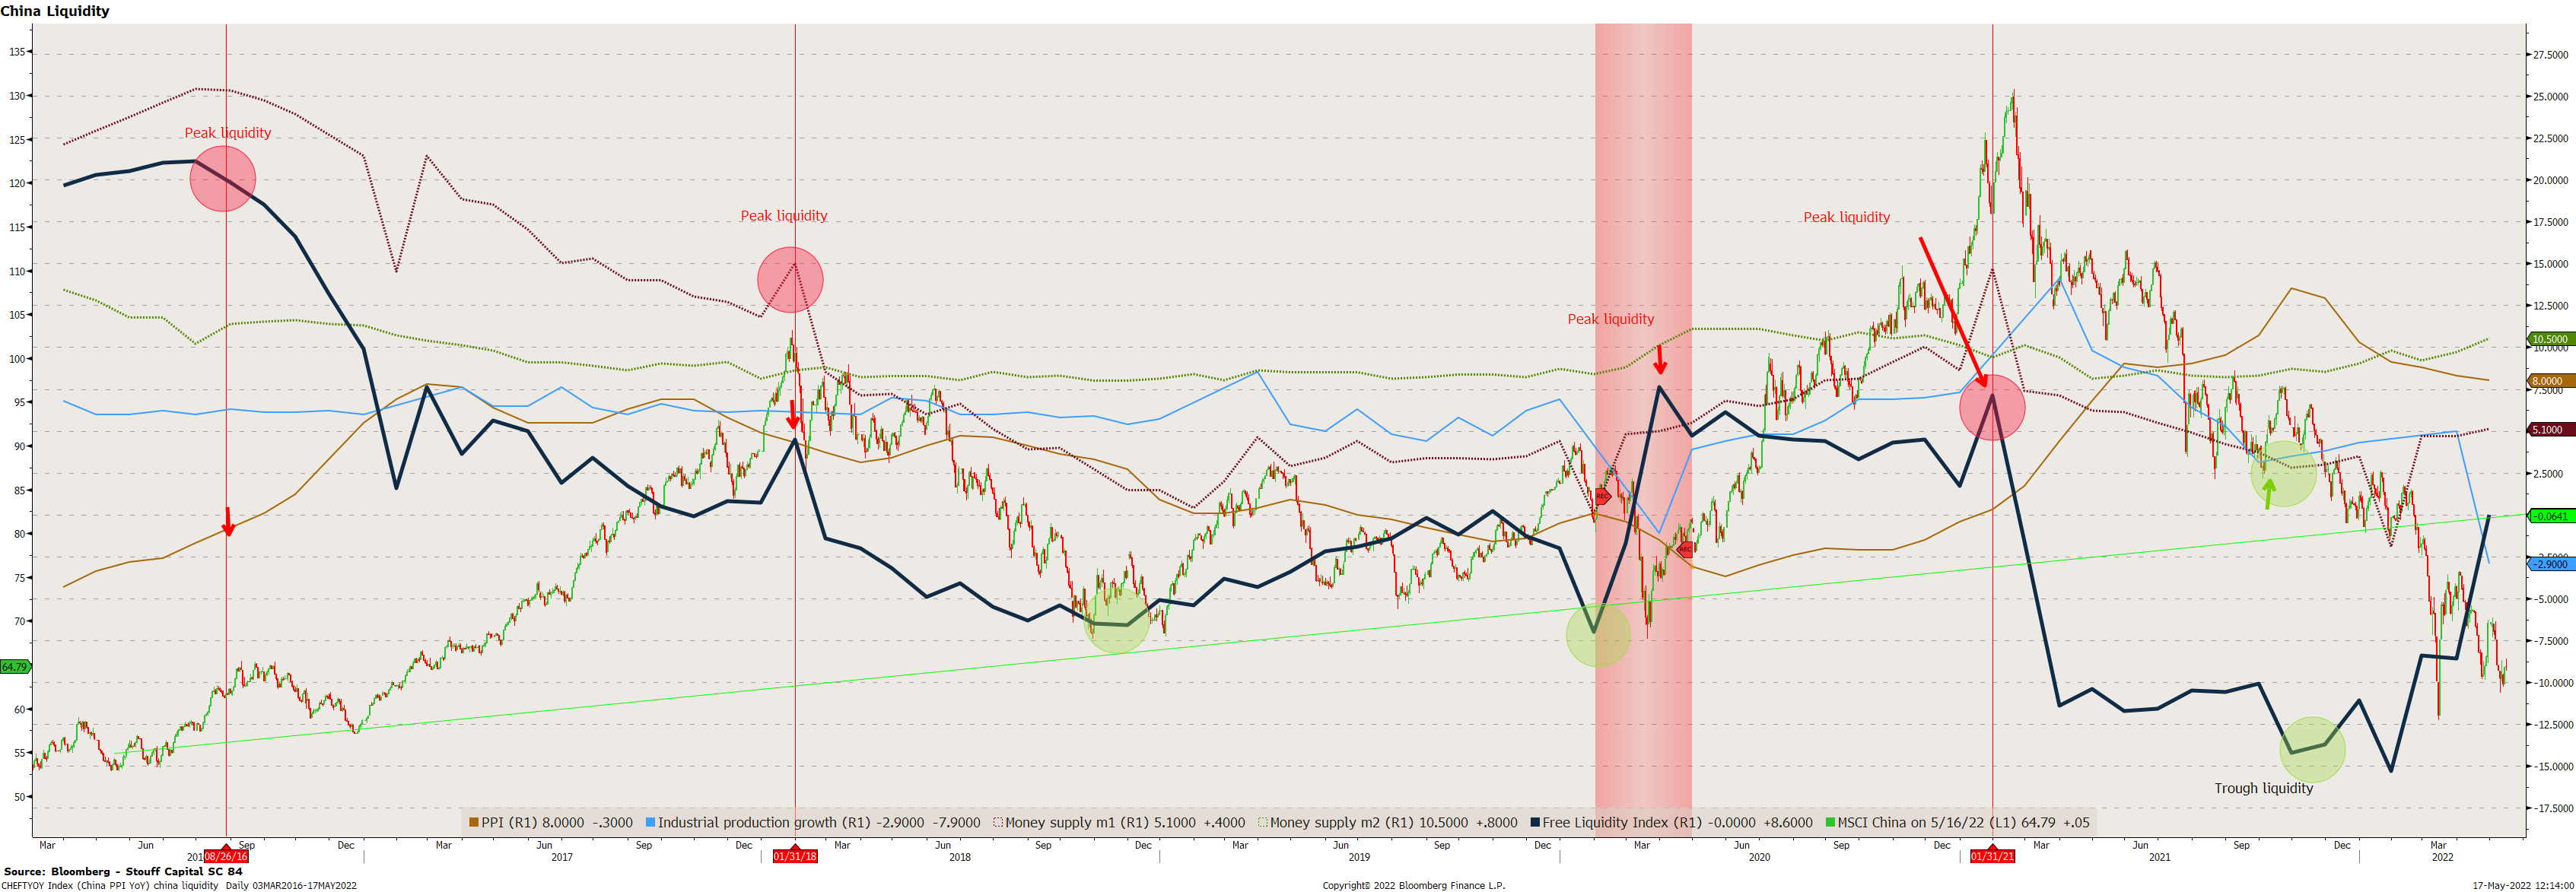
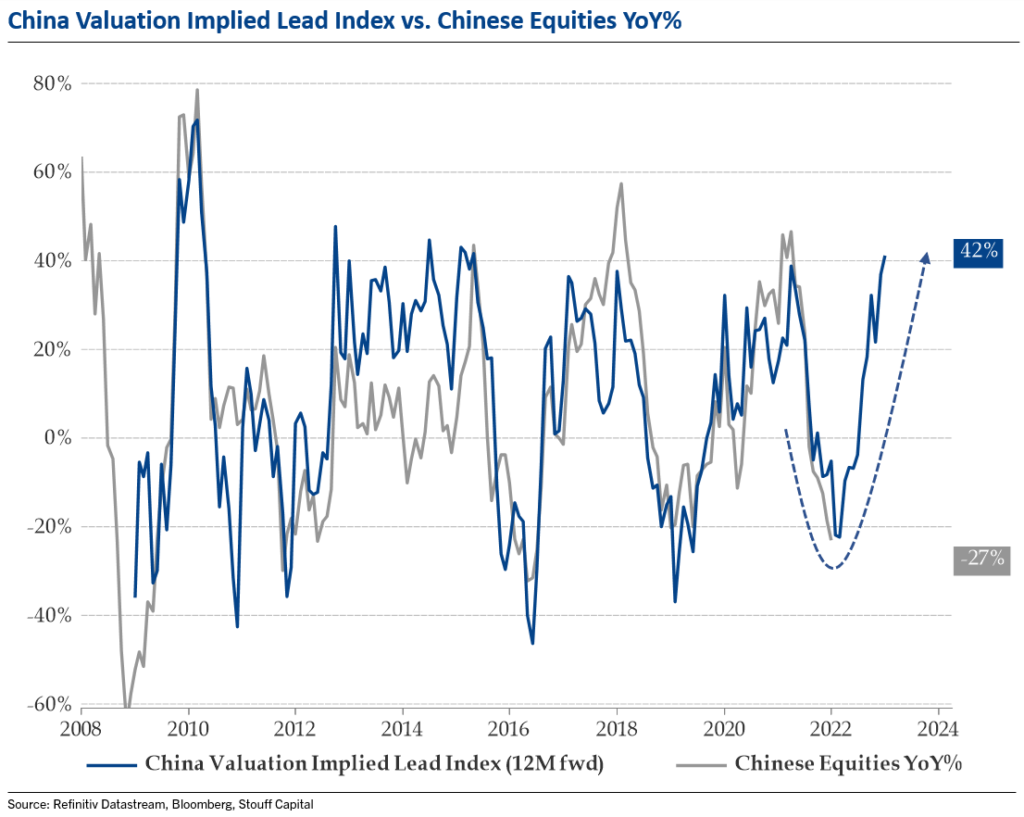
And, while Chinese equities were down nearly 30% YoY as of March 15th, our relative valuation lead implies Chines equities could be up by 42% 12 months forward. We were waiting for a frank reversal of Chinese equities to be comfortable again: right now FXI is breaking-up its 2022 bearish trend line. The Hang Seng Index struggles to put in a bottom despite another set of momentum divergence buy signals and meeting the lower end of the target zone associated with the 2021 bear market. While economic data may remain on the softer side, policy support is accelerating . The government announced measures to support property demand and reforms to incentivize power generation. What’s more, our Chinese Liquidity indicator is rebounding (unfortunately because of falling industrial production growth).
Chart 7: fxi us (chinese adr) – Breaking up above 34

Chart 7b: fxi us (chinese adr) – Long Term Chart still bullish
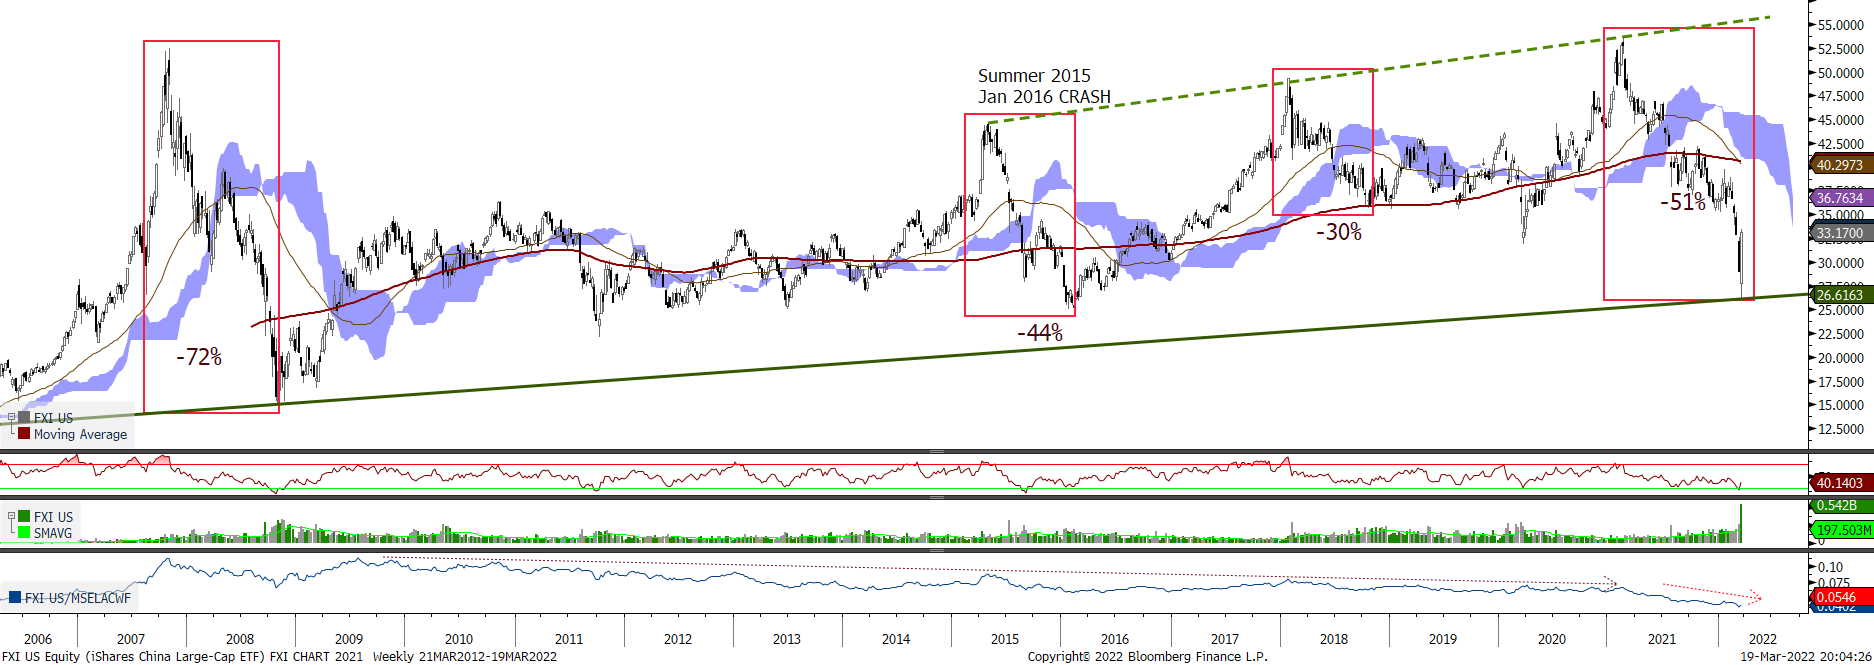
Chart 8: chart of the Shanghai stock exchange – bear market rally over ?

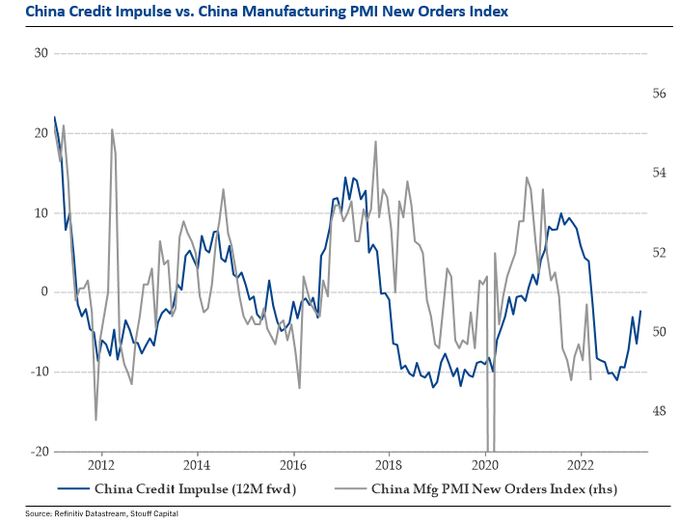
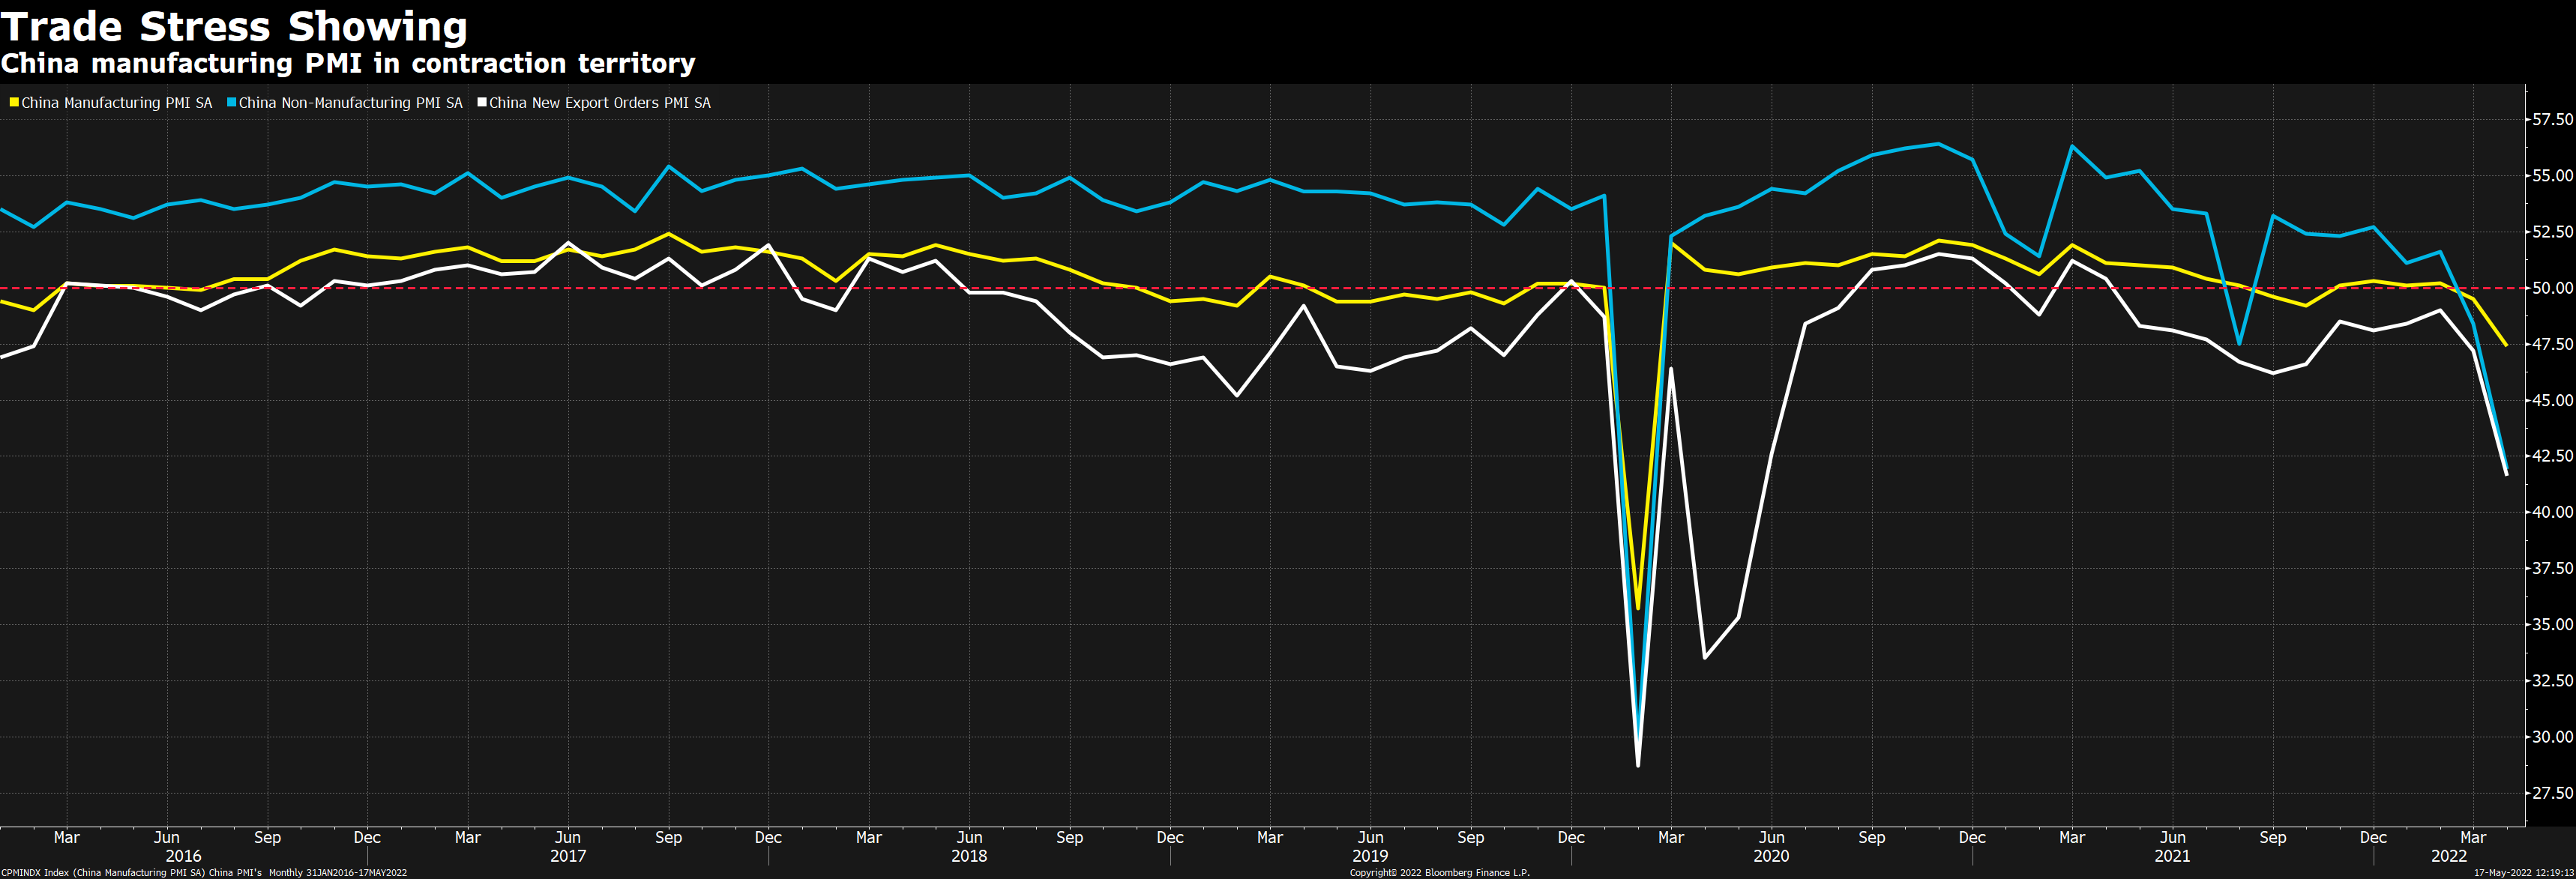
Chinese data have turned the corner, with China Credit impulse rebounding from a trough. One bright spot in data from China on June 30th with both manufacturing and non-manufacturing PMIs rising above 50 amid easing lockdown, coupled with policy easing and a stabilized regulatory reset could lift GDP to 2.7%Y in 3Q and 4.7%Y in 4Q. This helps FXI to break its bearish trend line. China is in a considerably better position today than a few months ago while positioning and sentiment remain near historical lows in the region.
EEM continues their bearish slide in line with higher US interest rates as shown in the below chart:
Chart 9: chart of the MSCI Emerging equities – bottom formation – breakup at 50.5
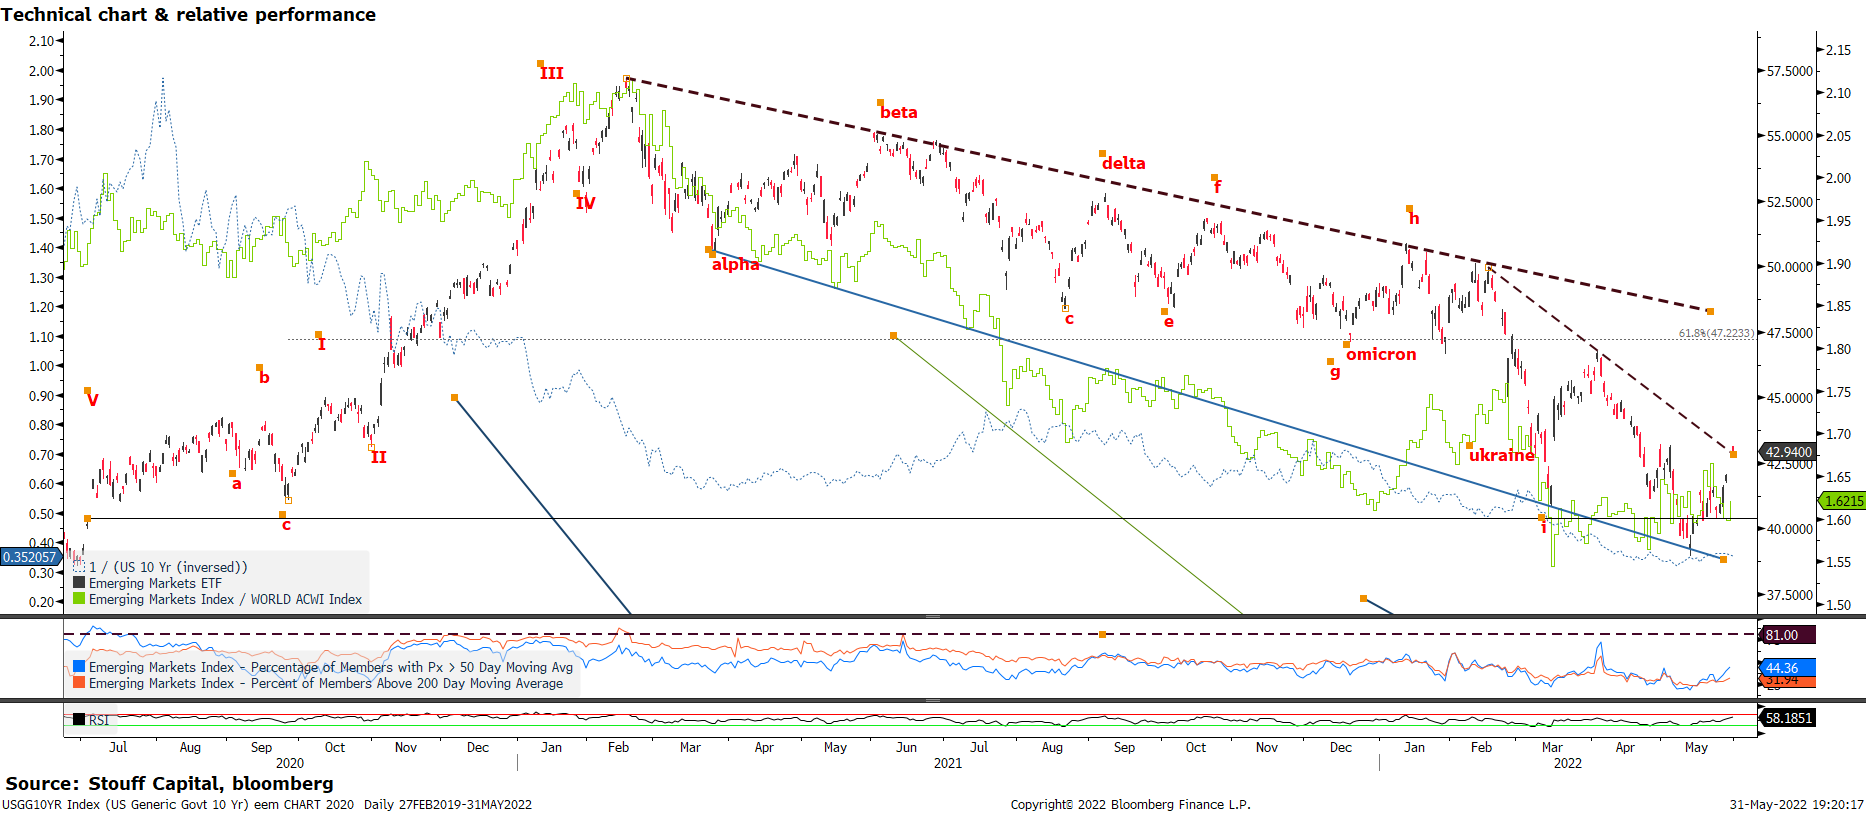
Table: Macro Season for various countries in January 2022
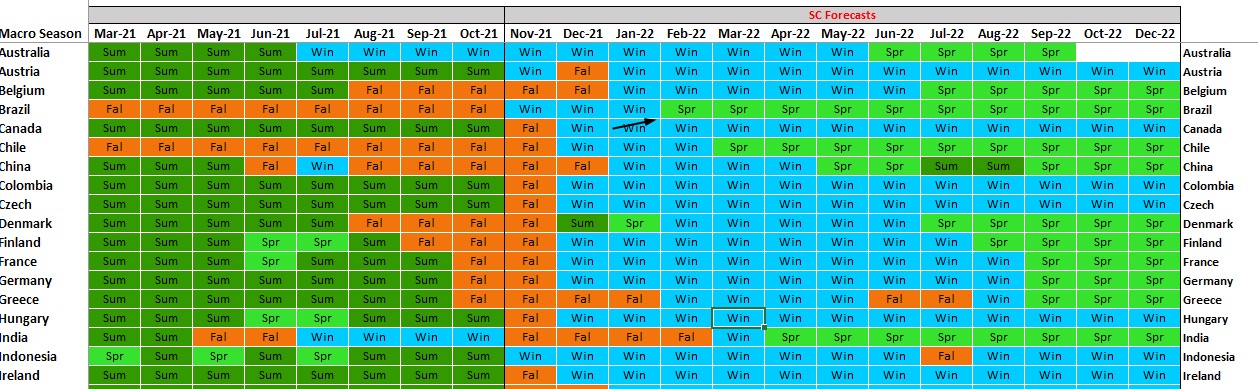
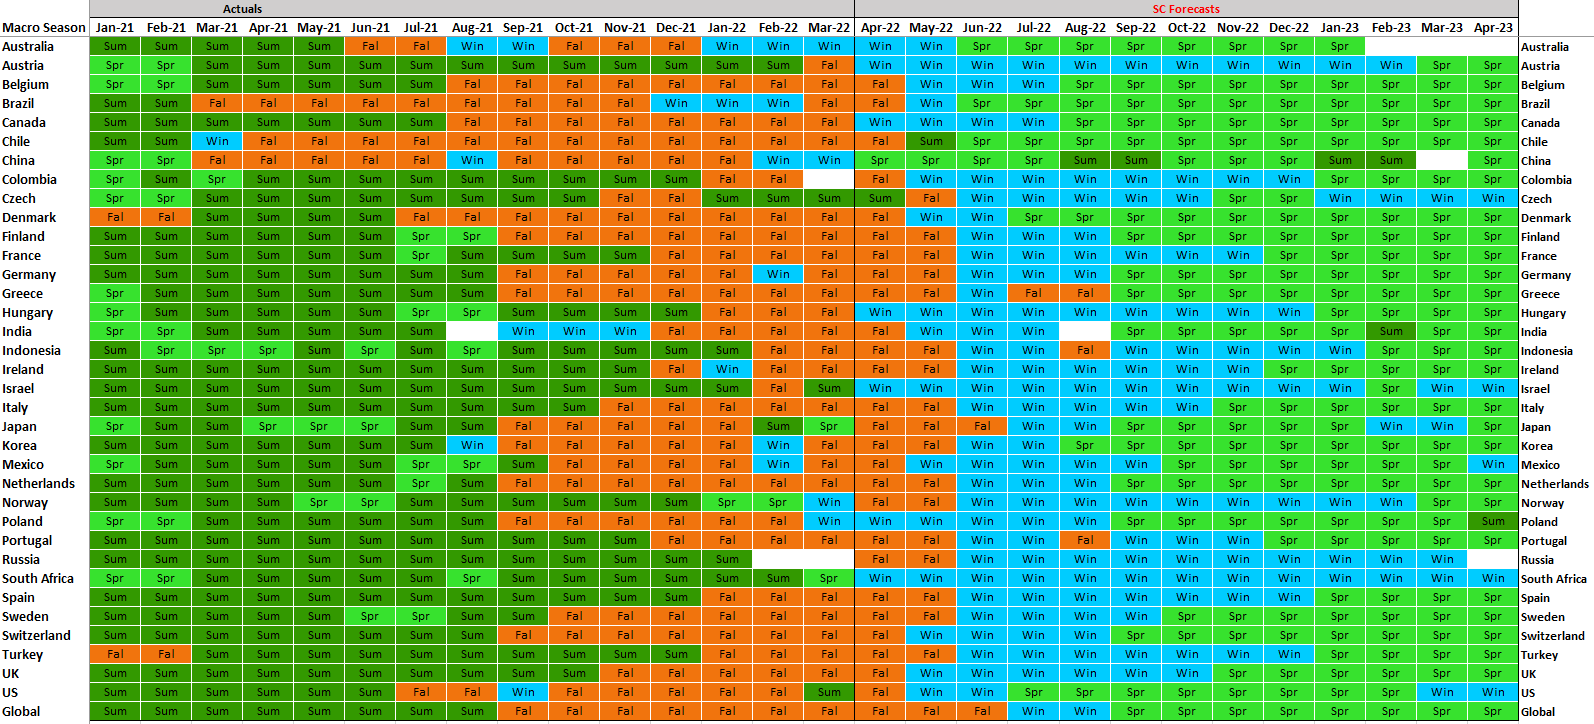
Table: Macro Season for all countries in April 2022
That market skyrocketed into early April (when we closed half of our long trade), but it’s been in a freefall ever since. The etf had already retraced 61.8% of its low March 2020 to high June 2021 at 42.05, and from a relative point of view, it had started outperforming again since the summer (below chart). There have been meaningful inflows to Brazil year-to-date, with the region being a beneficiary of investors’ cyclical/value rotation.
Chart 10: BRAZIL – EWZ US

What our Matrix tells us ?

The Regional Matrix shows we are in a Bear market with a short term bullish CPD with UW in Japan and EM and OW in Europe, US and China. All “3 month outlook” trend grades are maximum negative at -100%, but are replaced by contrarian bullish sentiment indicators (meaning dumb investors are too bearish). Thus the OW/US status depend on Valuation, which favors Europe with a better valuation grade at +56%.
In terms of business cycle, our economics grade is falling like a knife in US, Europe, EM, and China. This has created negative Economics CPD in US and Europe. Liquidity grades stay supportive, even if that should worsen with coming QT; a brighter point comes from Valuation being less expensive.
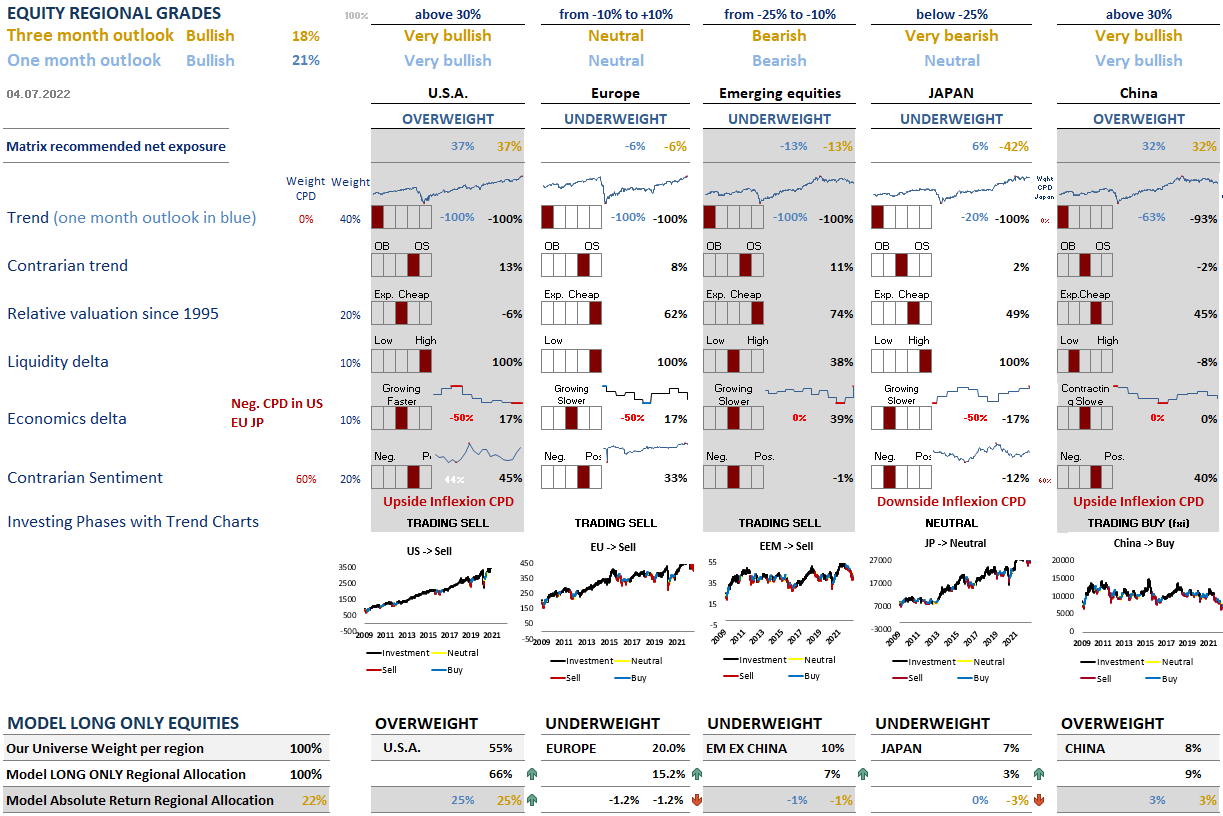
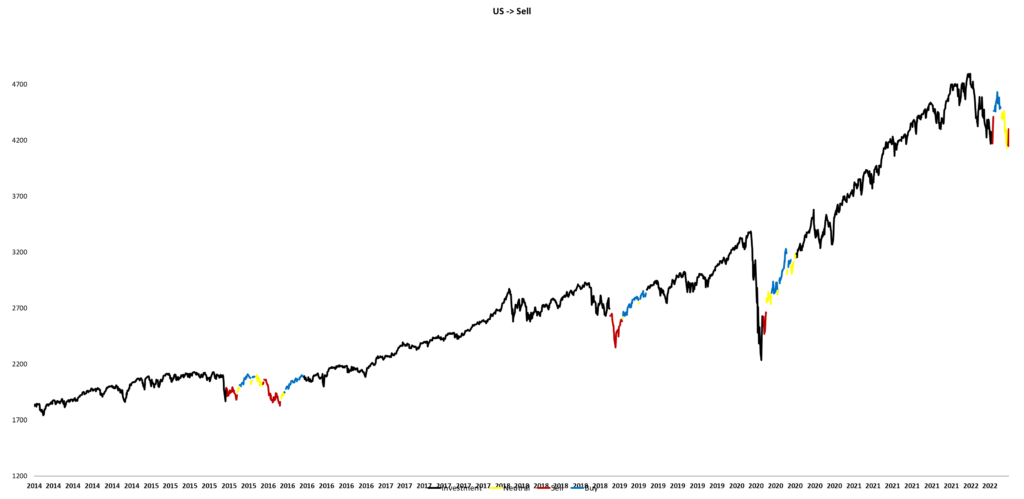
FIRST PILLAR OF MATRIX: TREND
The Trend model is assigning a Trading Sell (chart in red) to global equities and specifically US ones, as shown in the below chart. This is very important, and may signal a bear market, which has been rare in the last 10 years. Most regions have a maximum negative trand (except for Japan and China for the short run).
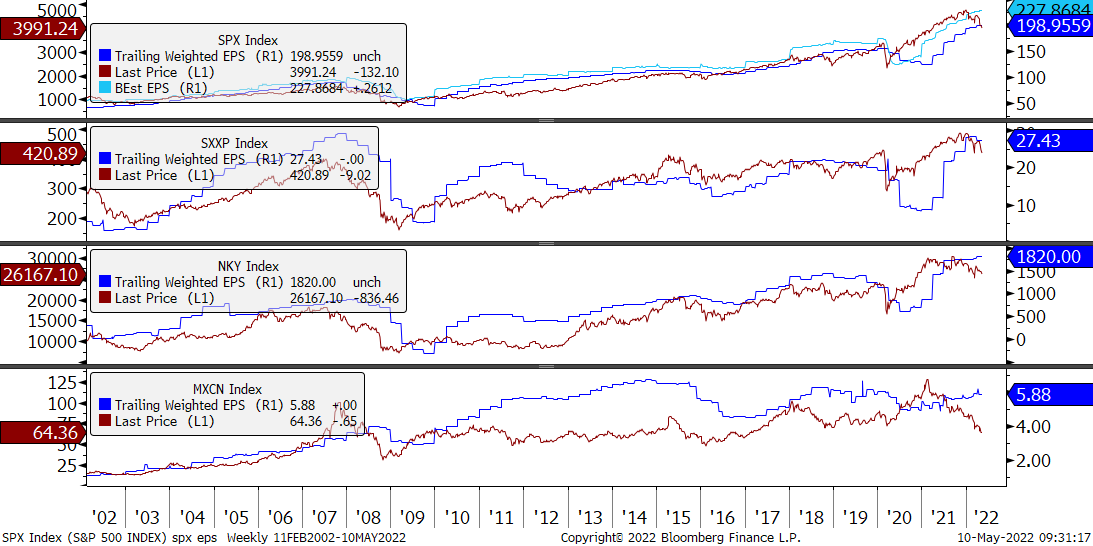
FIRST PILLAR OF MATRIX: VALUATION

The S&P 500’s PE is now down to the lowest level in 2Y, trading fractionally below the 10Y median… while the ERP on the S&P 500 has gone up 75bp from recent lows, it remains 70bp rich to the 10Y average… Investors have slashed the forward P/E of the S&P 500 since the start of this year resulting in a 17.0% drop in the S&P 500 stock price index from its record high on January 3 through Friday’s close. Meanwhile, industry analysts collectively have been raising their 2022 and 2023 revenues and earnings estimates:
(1) S&P 500 forward revenues per share is up 5.1% ytd to yet another record high of $1749.
(2) S&P 500 forward earnings per share is up 6.1% ytd through the April 28 week to a record $236.
(3) The S&P 500 forward profit margin edged up to a record 13.4% during the April 28 week.
(4) The S&P 500 forward EPS edged up to a record 227.8 as shown on the below chart:
European valuations are back to the cheap. Specifically Italy PE are down to 8.


SECOND PILLAR OF MATRIX: LIQUIDITY
US money supply is falling to a +6.55% yoy growth, coming from +27% in 2020. Europe yoy money supply growth is also down to +5.56%. The bright spot come from China with a rebound of money suplly at +11.1%.

THIRD PILLAR OF MATRIX: ECONOMICS
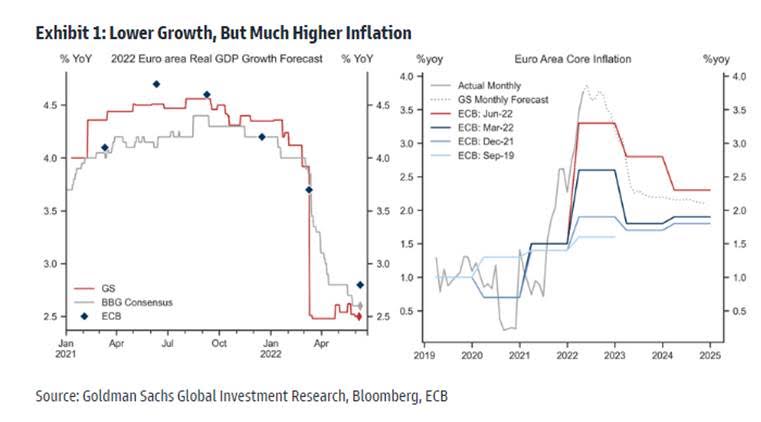
The latest forecast changes call for a Euro Area technical recession in 4Q22 and 1Q23… For 2022, US GDP growth is down to +0.9% 4Q/4Q (vs. 1.4% previously), and 2023 at 1.3% (vs. 1.6%)… June 30th Personal Income & Spending data points to lower than expected spending: concerns over inflation are paramount and consumer confidence continues to weaken… In fact, 2/3 of consumers are planning to reduce spending over the next 6 months in response to inflation… The US Economic Surprise Index is below -70 (first chart below) and ISM Manufacturing is in focus today where economists forecast a 1.6pt decline from May to a still healthy 54.5…
There is also a laundry list of negative economic data: the drop in the Conference Board’s Index of Leading Indicators, falling existing-home sales, weakening sentiment among home builders, slipping truck orders and purchasing managers’ indexes, an uptick in unemployment claims, plus the drop in real retail sales after inflation. Retail sales volumes are falling and inventories are rising, the latter potentially weighing on gross domestic product. Except Japan, all the Citigroup surprise indexes have fallen and generated a negative CPD for US, EM and China. All in all, the Economics grade is falling in all regions (except Japan) and preach for the coming of Winter.


What our Sector Matrix(es) tell us ?
In Europe, OW sectors are Energy, Health Care, Utilities, Communication and UW Real Estate, Discretionary, Industrials & Tech.
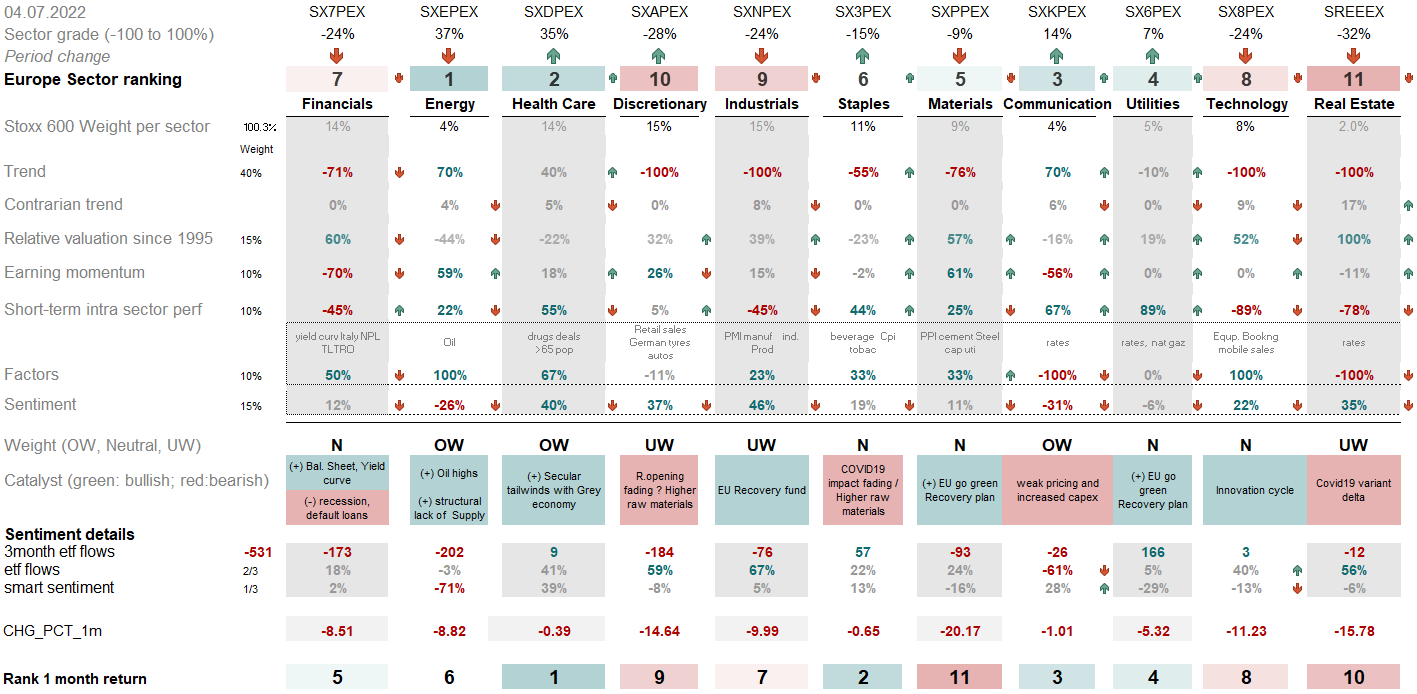
European Financials (SX7E Index)
European financials have fallen from OW to Neutral. Specifically, insurers have a Demark 13 short, with earnings diverging negatively. Added to that, the ugly ECB meeting and mention of European fragmentation, banks and specifically peripherial banks are at risk:


European Utilities (SX6P Index)


European Telecomm (SXKP Index)


European Technology (SX8P Index)


European Energy (SXEP) is breaking out its march 2020 high, with earnings “sky is the limit”.


European Industrials (SXNP) have already strongly corrected, mean reverting to their relative earnings trend.


In US, on the below table, OW sectors are Energy, Materials, Real estate and nearly Health-care. This is explained by a the Ukraine war driven risk-off bearish market, favoring defensive sectors like the Health-care or Real estate in the 3rd position. Staples have been downgraded to neutral with the sell-off in WMT and TGT. Discretionary, Tech, and Communications are UW. But, when looking at Contrarian Sentiment, Utilities, Staples and Energy are sold, while the UW sectors are strongly bought like communication, Financials (upgraded to Neutral): this is to be followed…
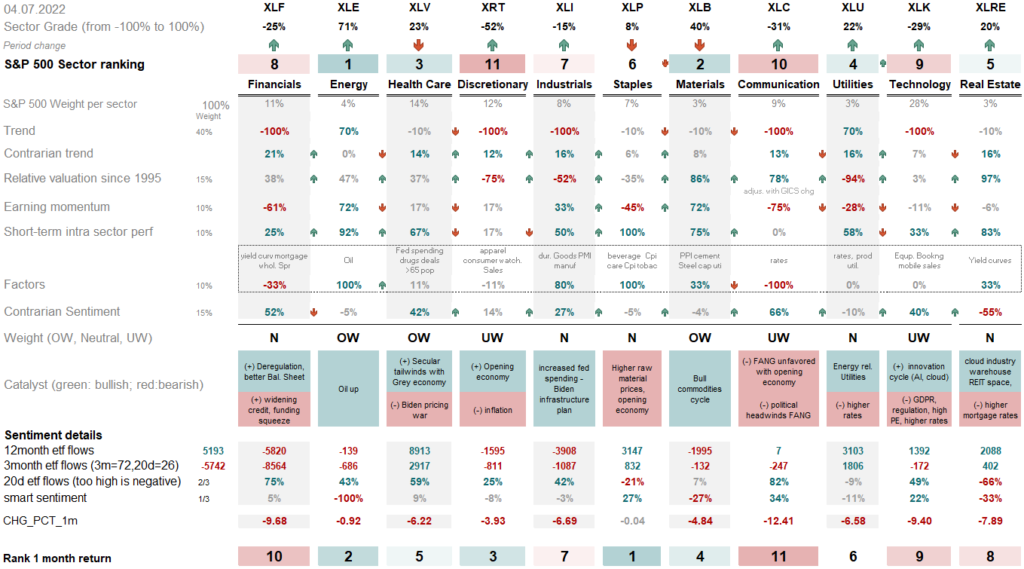
Staples have outperformed in 2022. But when they were too overbought versus their 200 days moving average and their relative earnings (top left chart blue line), we initiated a tactical short. Thursday 18th May sell-off on WMT and Target has confirmed our tactical short. We recently closed it on June 14th for a +9% return, as the spread to the mean is now too low.


Energy was firing on all cylinders (except being sold by the Smart Money, see table above). It finally reversed last week, and prices come back near their 200 days moving average. There is a long term relative breakout, showing that it is a new secular trend: buy any dip or breakouts.


Materials finally underperformed the S&P500 (we went short Materials on May 19th as a tactical trade). There was a divergence with falling copper . The 4 charts below shows that XLB broke-down, reached 1 negative sigma versus its 200 days moving average and reversed its relative outperformance versus the S&P500. Now that the extreme outperformance has been cooled off, we are looking for long term entry levels. On a medium run, outperformance is justified by ultra strong relative earnings momentum and (bottom right chart) just the start of a secular bull…
Chart: US Materials; relative performance versus S&P500 in black compared to relative earnings momentum


US financials broke their 38.2% fibonnacci ratio on their way to 26.18 or the 61.8% fibo retracement. They still face many obstacles: declining relative earnings, winter is a bad season for them, no leadership in whatever timeframes.
Chart: US banks; relative performance of US Banks versus S&P500 in black compared to relative earnings momentum


US Health-care are outperforming since December. This is not justified by the earnings momentum ratio versus the S&P500.
Chart: US Health-care; relative performance versus S&P500 in black compared to relative earnings momentum


Technology – Our triptych shows that US tech is very oversold versus its moving average – the ratio is at the same level than the start of 2020, and its relative earning is stable since the end of 2020.


Industrials are supported by their relative earning momentum, but their relative performance follows the China credit impulse which is still bearish until the end of the year (ratio industrials versus precious metals). The right hand chart shows the China credit impulse delayed by 11 months versus the ratio of Industrials / precious metals:


Consumer Discretionary is one of the worst performing sector, with its relative return back to its March 2020 !!! Relative earnings do not justify such a derating. Long term ratio charts (below right hand side) show how extreme the derating has been: time to buy ?


Utilities
After a massive outperformance owing to Russia-Ukraine conflict, utilities had reached the upper band of the uptrend channel since march 2020. Then, they have fallen and even underperformed the S&P500, now breaking their bullish channel.


Communication Services


Real Estate


Which factors work: Is Value reversing ?
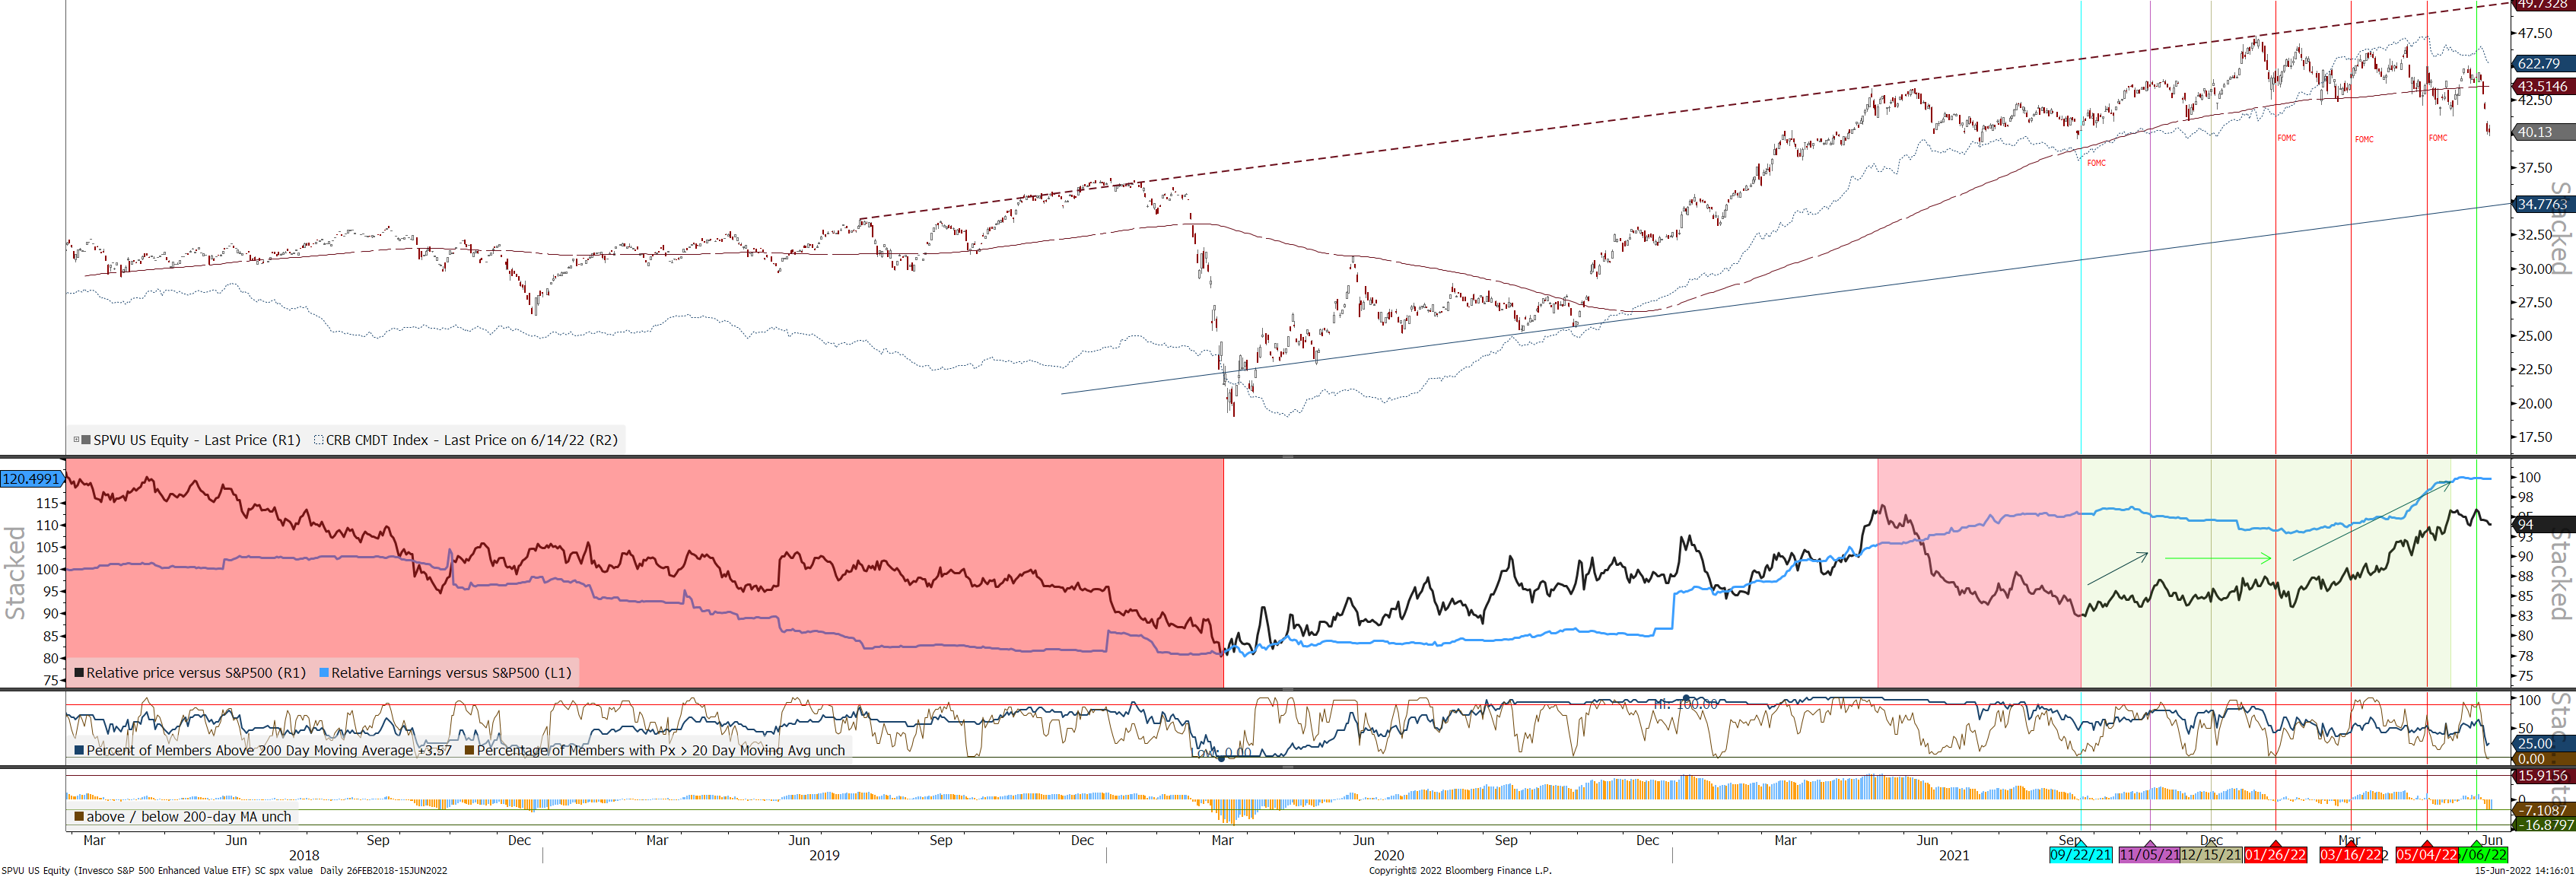
Value has outperformed since the September 2021 FOMC meeting. This outperformance has really increased after the 2022 January FOMC meeting and always more at each March and May FOMC meetings. However we observe a reversal since June 7th. Does it mean a new trend is evolving or a Regime change? Since the June 15th FOMC meeting, Growth has outperformed Cyclicals by 18%, Software has outperformed Semis by +10%, and Unprofitable Tech is up +10% for the second best performance over a 7-day period in two years.
From March 2021 to the end of the summer, quality has outperformed, in anticipation of peak earnings and peak economics. Since MID AUGUST, this had reversed in line with rebounding rates. There was a pause in the outperformance of small caps versus quality in sept/ oct, despite the move in interest rates. From the start of November Quality is outperforming again versus small caps. Since May 12th, Small caps are outperforming, and this is aligned with an outperformance of software versus semis (with rates stabilization)…

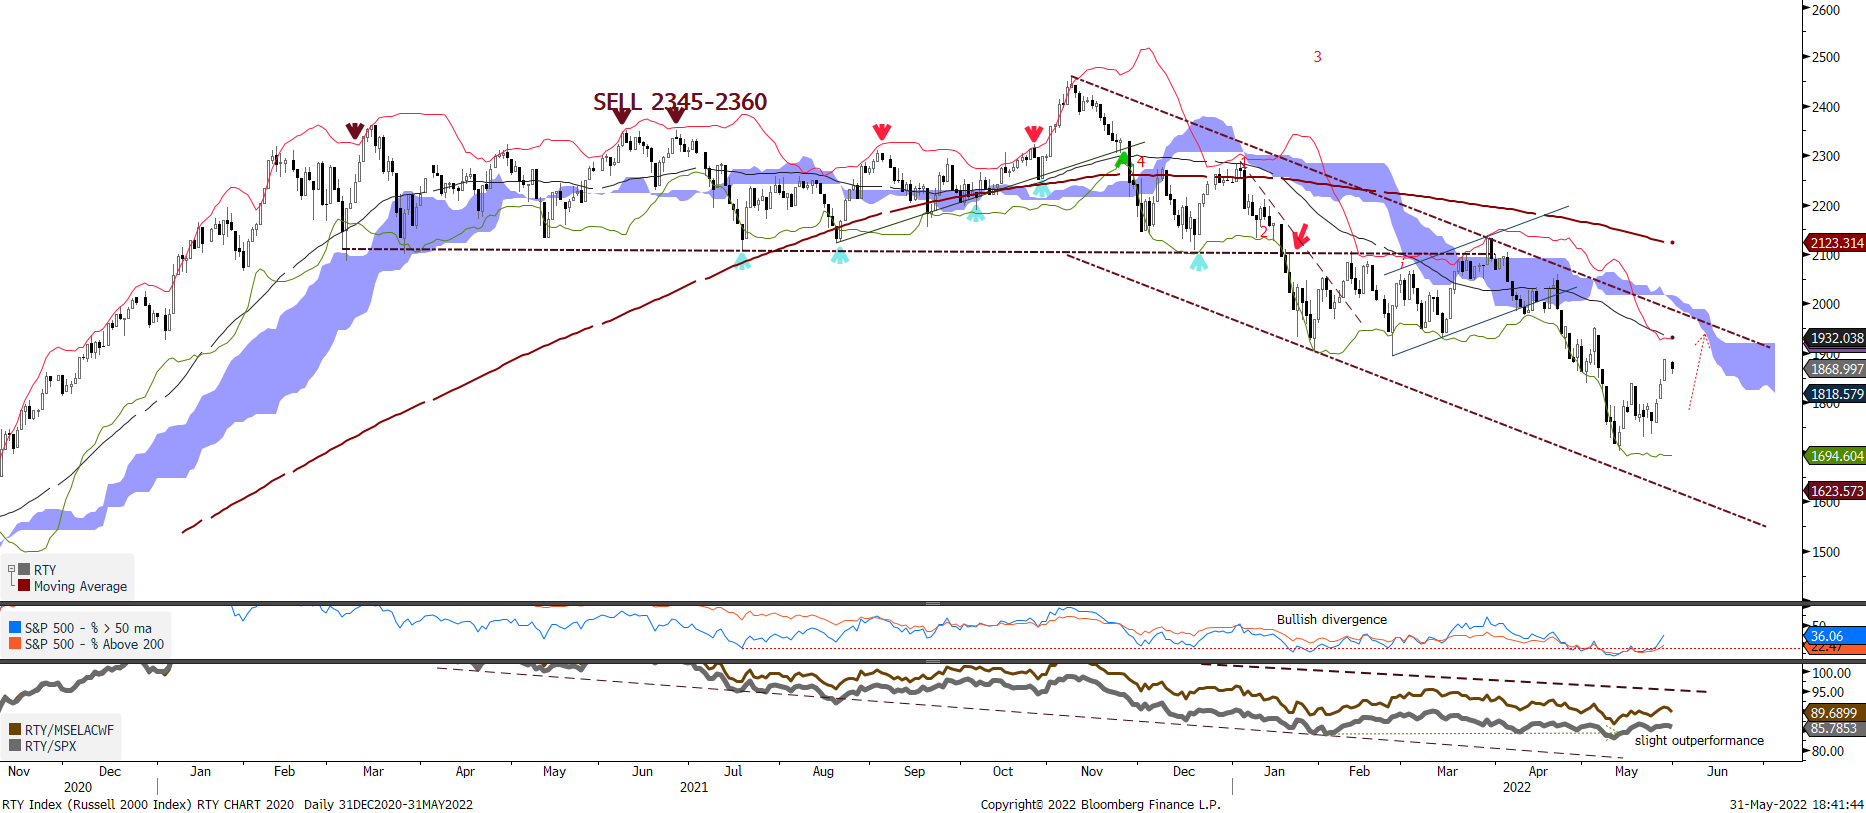
The small-cap Russell 2000 has underperformed from March 2020 until now. But, they are cheap and sentiment is extremely negative; “smart money” commercial hedgers added to net longs in the small-cap Russell 2000, now holding the most net long contracts since 2016.
2Q22 earnings: inflexion point
As 2Q22 earnings are now quickly approaching, this could finally be the true inflection point for a market that has been overwhelmed as of late. Earnings revisions breadth across the S&P has now been firmly negative for weeks (now -1.9%) but at the same time, we have yet to see earnings cuts from companies broadly roll over. That being said, we did see some startling prints from Nike (NKE) and Restoration Hardware (RH). This may serve as a fair warning of what’s to come from others as we hear challenges for the second half of 2022 from the likes of Micron (MU), Meta (META) and General Motors (GM). Nike (NKE) fell -7% despite stronger than expected bottom-line results, yet the company continues to struggle with supply chain pressures causing in-transit inventory to account for 65% of total inventory by the end of the quarter in conjunction with posting a conservative guide. Restoration Hardware (RH) cited “softening demand trends” and cycling the “extraordinary growth from COVID-driven spending shift” among other factors contributing to an uncertain macro environment, leading the company to cut full year revenue guidance to 0-2% from +5-7% prior. This led the stock to shed more than -10%, dragging peers like Wayfair (W)* and William Sonoma (WSM) down in sympathy as well.
As bears continue to pound the table on further risks to earnings, the ultimate question will become whether or not we’ll fall into a recession. There is a general comfort with the idea of entering a recession as a means to simply “get it over with.” While the prevailing thought may be that we’ll see a painful correction for equities but a shallow recession for economic growth contracting,
Current trend: earnings revisions breadth for the S&P500 stays negative. This means that that there are more downward than upward revisions , a dynamic that often precedes a consolidation in forward EPS. earnings estimates are likely too optimistic and margin compression would reduce the median stock’s expected 2023 EPS growth from +10% to 0%. In addition, rising borrowing costs will likely continue to pose a headwind for net corporate profits…for context, excluding Financials, a 100bp increase in S&P 500 borrow costs (interest expense/debt) would lower net profit margins by roughly 40bp and reduce earnings by about 3%.

In the US,
- 453 SPX companies have reported 1Q22 earnings, representing 90% of the index by weight. So far, 77% of companies have surprised to the upside on EPS while 73% have delivered an upside surprise on Sales – with earnings misses increasing in Discretionary over the past week while Sales came in above expectations.
- On average, earnings have come in 7.3% ahead of expectations, while sales have come in closer to in line (2.8% average beat). This is up on both measures since our last scorecard. Discretionary companies notable fared poorly on earnings over the past week, with the sector earnings beat percentage declining from 69% to 57%, while Comms and Financials finished out with more companies missing Sales than beating.
- As earnings come to a close, growth figures are beginning to cement. Financials growth has performed mildly better than expected (-24% consensus at the beginning of earnings season), while Discretionary growth was much worse than expected (around -12% growth consensus). Discretionary weakness is due to a variety of factors – margin concerns (inputs, labor, supply chains), slumping demand and a migration away from e-commerce.
- Companies have gained another ~5bps of performance vs. the index after reporting earnings since our last update. Companies that have delivered beats on both EPS and Sales have seen milder rewards than typical, up +1.1% on a relative basis (-20bps beneath long term average). Missing on volume but not margins (beating EPS but not Sales) heavily punished type of performance with -1.3% relative losses, still a much higher penalty than average (-20bps historically – 77 companies have so far reported results of this type). Those beating Sales but missing EPS suffered a penalty of –0.8%, about half the long term average. The penalty for missing both Sales and EPS is now worse than average, -3.4% relative to SPX vs. -2.8% long term average. Discretionary and Communications companies that missed over the past week often cut guidance, potentially exacerbating this trend.
- Commodity stocks (Energy and Mats) have been the best performers after reporting earnings, with honourable mentions to Food Staples and Utilities.
1Q results globally have actually been remarkably strong: Unfortunately, evencompanies posting beat and raise prints have been unable to escape falling into the red this week. Look no further thanDatadog (DDOG) falling -8.9% and Sprout (SPT) -15.4%. It’s worth noting there were some bright spots along the way, with Airbnb (ABNB) and Booking Holdings (BKNG) beating expectations into what is slated to be a “busy” summer travel season ahead. From a macro perspective, it was probably most concerning to see Zillow (Z) guide down this week on broader concerns for the housing market. With inventory levels falling -23% YoY and interest rates surging, housing affordability has been under considerable pressure with no signs of letting up.
In Europe, record breadth of sales beats from Europe’s 1Q earnings season. Results have improved and now point to a record breadth of sales beats, a narrower breadth of EPS beats and rising risks to margins with EPS – sales revisions deep in negative territory. Price action has been balanced for EPS beats vs misses, but markets have punished top-line beats heavily. this earnings season is set to deliver an upbeat surprise on 1Q results look set to deliver a record of +57% breadth of sales beats and strong breath of EPS beats of +36%, but also sees continued margin uncertainty and negative skew to price action for both EPS and sales misses. For EU, materials, information technology and financials delivered most net beats and top picks within these sectors are Caixabank (CABK SM), Lloyds Banking (LLOY LN), ArcelorMittal (MT NA), and Adyen (ADYEN NA).
Here is our list of the Good and the Bad
THE GOOD:
V (Williams, Buy, PT: $275) Co reported impressive F2Q results this week as EPS of $1.79 beat by ~8% driven by upside on cross-border revenue. To that point, we note that cross-border travel recovered to 90% of 2019 levels in March and 92% in April, while the company’s updated FY22 outlook assumes recovery to 100% by September. Additionally, we point out that suspension of operations in Russia is expected to drive ~4ppt negative impact in 2H to both payment volume and cross-border volume indexed to ’19. That said, the impact to processed transactions will be minimal. We continue to recommend V given its conservative 2H guide, favorable end market exposure, and a multi-year climb back to pre-COVID cross-border trend line
MSFT (Thill, Buy, PT: $400) The company reported F3Q and shares are outperforming on the result. We note that F3Q total revenue came in 0.7% ahead of cons, which is in the face of 60 bps incremental rev. headwinds from the time guidance was given. In addition, mgmt. expects F4Q Azure growth to be 47% cc following its 3 pt acceleration to 49% organic cc in F3Q. Commercial bookings growth also decelerated slightly to 35% cc vs 37% in F2Q22, however still impressive given the significantly harder comp in F3Q. We note that shares trade attractively at 29x our CY22 EPS vs large-cap peer median 32x.
Qualcomm easily beat EPS and revenue expectations on sales growth of 41.1%, while guiding the current quarter well above consensus. The company’s QCT business, which includes revenue from products used in mobile phone handsets, increased 52%.
ServiceNow crushed earnings expectations while beating sales estimates. Subscriptions grew 26%, while the company landed 52 transactions worth over $1M in net new annual contract value for the quarter (+41%). The company guides toward Q2 subscription revenue of $1.67B to $1.68B and cPRO growth of 28%.
United Rentals topped both top and bottom-line expectations, while feet productivity increased 13%. The firm guided full-year revenue up to $11.1B – $11.5B from $10.65B – $11.05B.
AMD (147) the company reported 1Q22 results in which revenue growth guided up 700bps to ~38% Y/Y from 31% YY. 1Q/2Q Revs Ex-XLNX both beat by ~6%. We estimate AMD Gained ~250bps to ~300bps of server revenue share Q/Q consistent which is consistent with our estimates. The 2022 Full-Year Rev Guidance ex-Xilinx Raised ~5%, Organic Rev Growth Raised 700bps from ~38% Y/Y vs ~31% Y/Y prior. Furthermore, 1Q revenues are $5.33B ex-XLNX above consensus of $5.01B with 2Q revenues outlook expected of $5.5bn ex-XLNX above consensus of $5.14B.
Turnaround
PYPL (Williams, Hold, PT: $95) Last night, the company reported 1Q results, which included a lower FY22 revenue outlook reflecting a continued normalization in consumer behavior as spend shifts back to brick & mortar retail, services outpace goods, and inflation curbs demand for discretionary categories among lower-income customers. The new range of 11-13% also assumes a modest amount of incremental macro pressure for the balance of FY22. In our view, the cut to FY22 should help put a floor under the stock, however, we expect the macro to remain unfavorable for ’22 and believe greater visibility into ‘23+ is needed to begin the process of re-rating.
MISS
GOOGL (Thill, Buy, PT: $3,400) Last night, the company reported 1Q and shares are underperforming on the result. We note that search ad revenues of $39.6B grew a healthy 24% Y/Y, while Google Cloud revenues grew 44% y/y to $5.82B. That said, YouTube missed Street estimates for the third straight quarter as it faced multiple headwinds. To that point, these headwinds are likely to continue into 2Q, compounded by the toughest comp of the year. As a result, we lower our estimates and PT. We continue to view the FY22 profile as attractive, however, the company needs to clear 2Q first, in our view.
Amazon (AMZN) bringing their 2Q profit guide down due to cost inflation headwinds (fuel, shipping, wages) and Apple (AAPL) calling out ongoing supply chain headwinds affecting production, It’s clear that we are not out of the woods yet with respect to supply chain pressures, which may make the case for owning more asset-light companies that may be better insulated from these headwinds.
weak earnings results by retailers like Walmart and Target where results indicate that increased supply chain costs, high labor costs, and unfavorable product mix has led to sharp decline in gross and operating margins; The squeeze on retailers was dramatically evident in the massive hits to an array of stocks led by Target (ticker: TGT), resulting from the painful squeeze on margins from the inability to pass on to consumers all of their steeply rising expenses
SHOP , Co reported 1Q results yesterday that underwhelmed consensus. Our sense is that the company is seeing a rebalancing in consumer spending toward services and travel given a GMV growth of 16% Y/Y, affected by consumers shifting spend from online to offline retailers and travel. In addition, the acquisition of Deliverr is expected to contribute to top line growth in the back half of 2022 as Deliverr’s asset-light network will fulfill the majority of its near-term order volumes while it continues to build out SFN’s in-house network. That said, we are reducing our 2022 total revenue estimate by ~2% with our 2022 GMV estimate ~10% lower to account for 1Q results, macro headwinds, and expectations for fewer net adds than previously anticipated.
4Q21 earnings – will be moved to archive here …
Here are 2 lists of companies able to sustain their margin despite higher Inflation with long names like M, TPR, KSS, WMT, HD, LOW, CAT, ABNB, FCX, PEP, STZ, LEVI and FANG* and short names like ANF, M, and BBBY, SWH, NKE, FDX, BOO, H&M, DPZ, TWLO, PYPL, TGT, YETI, JWN, ADSK,
Other charts
We are starting a new blog on Cryptos, preparing our coming fund. It can be found here…
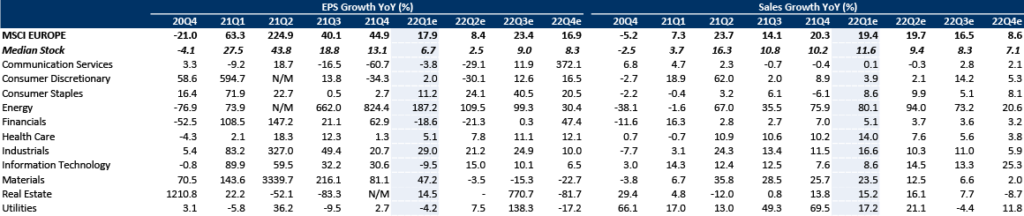
Chart 20: Ethereum – end of triangle
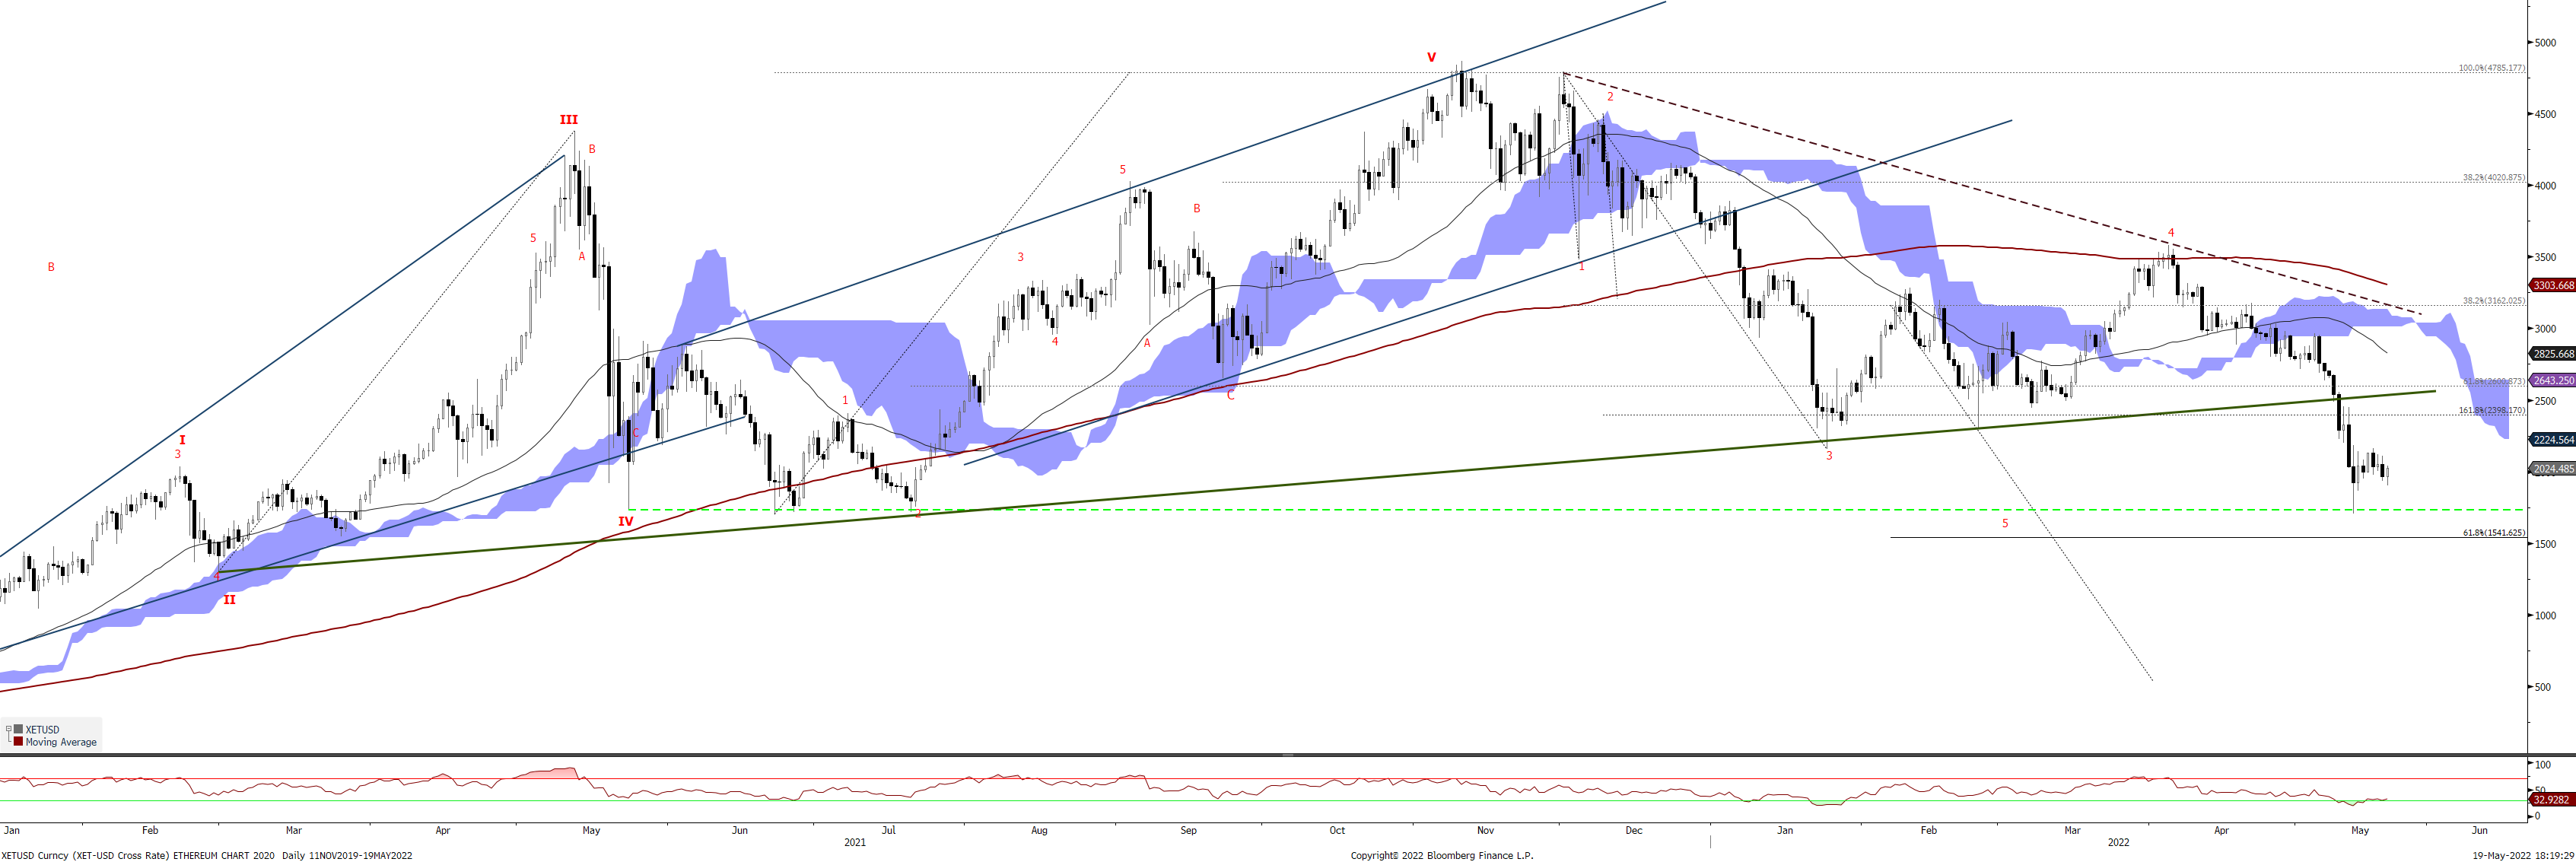
Bitcoin prices have broken 42000, reaching lower band at
Chart 21: Bitcoin – reached the low band of the long term bullish flag
Chart 22b: CAC40 – We sold the rebound, but outperforming

Chart 23: US 10 YR – US 10 YR RATES BREAKING UP
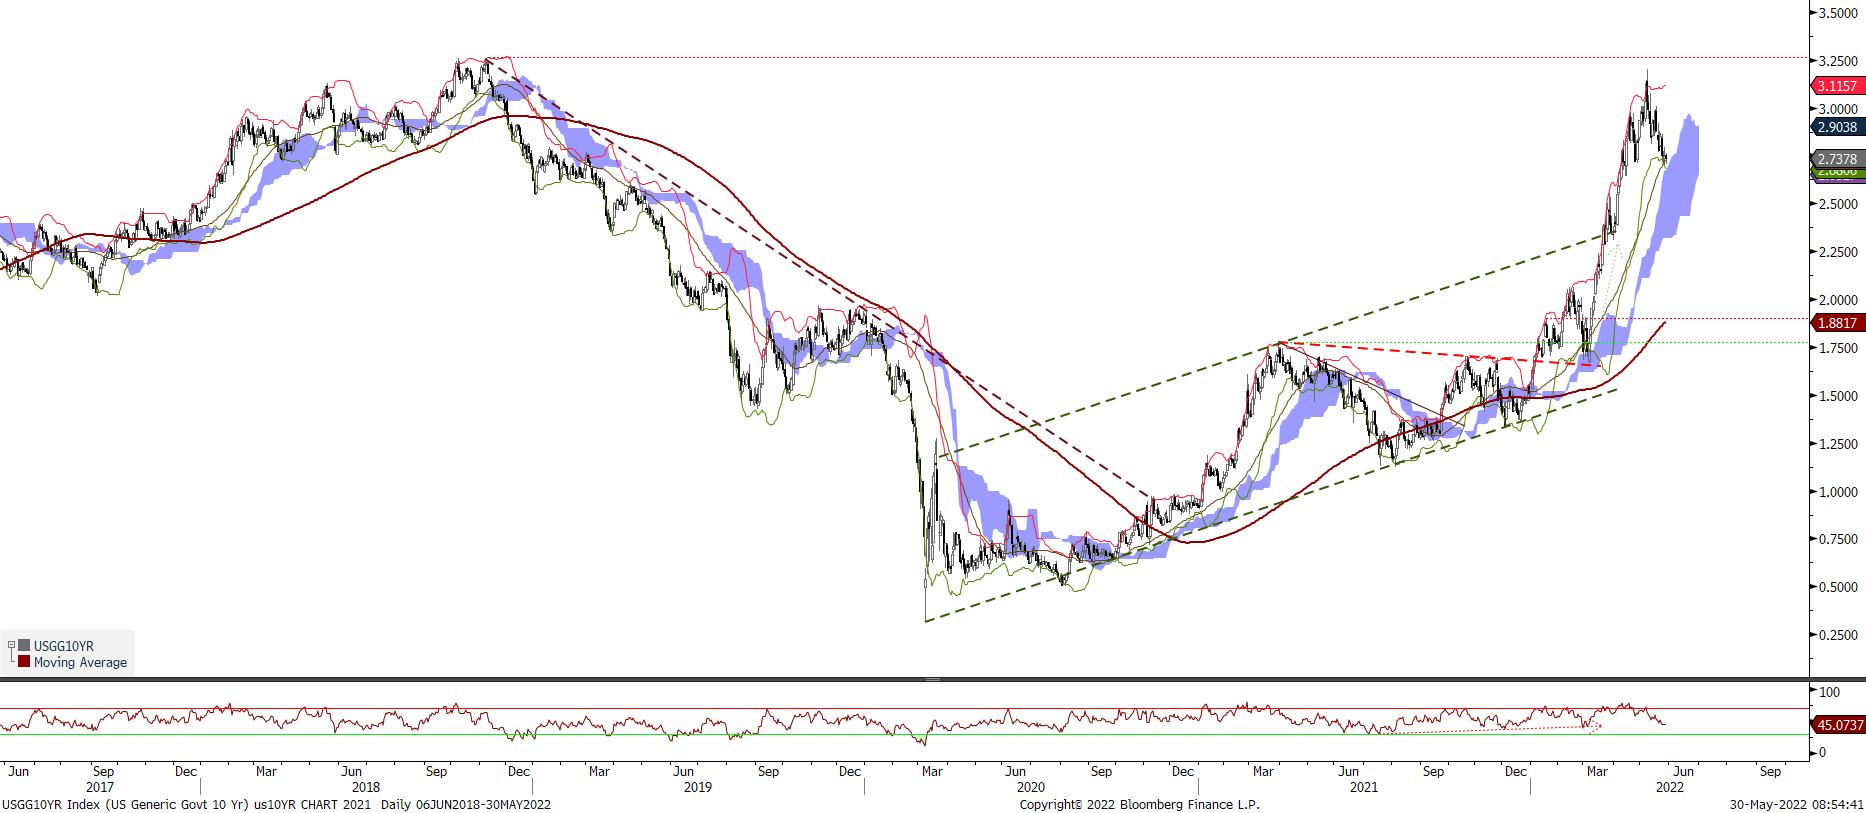
The move in 2-year Treasury notes after the FOMC meeting on Wednesday seemed to significantly dampen investor sentiment in equities. Yields have skyrocketed, especially on the short end of maturities, and especially especially on Wednesday, with the biggest jump in 2-year yields in almost a year. The fact that 2-year yields rose more than 10-year yields means that the yield curve got flatter. When a flattening occurs because the yield short-term maturities rises faster than longer-term maturities, it’s considered to be a Bear Flattener. This is usually taken as a negative for stock investors because it means money is getting more expensive for consumers and businesses, and the Federal Reserve may be on the cusp of making it even more expensive, potentially triggering a recession. The chart below shows the growth of $10,000 (using next-day returns) based on which regime the Treasury curve was indicating at the close of each trading day. Since 1976, the worst regime has been a Bear Flattener, which unfortunately is where we find ourselves now. Like we saw with the McClellan Summation Index when it’s below zero and declining, this kind of regime has resulted in almost no gains over nearly 50 years. Over the past 20 years, it has preceded a net loss.
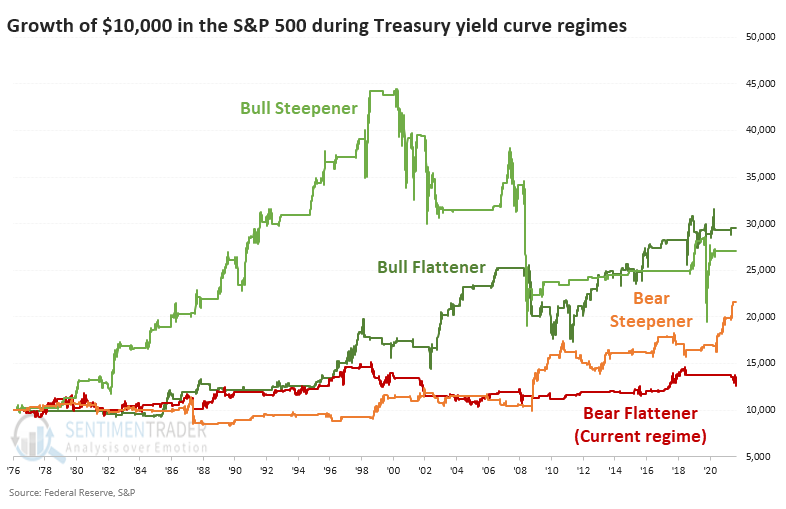
Chart 24: FTSE has reached its wave 5 target

SEMICONDUTORS
Chart 25: Semiconductor sales are expected to slowdown

Chart 26: Semiconductor sentiment is entering in an excessive pessimism zone

Chart 26: Semiconductor daily chart

FRACTALS
WARR Fractal: March 1st, fractal on mainly European stocks reacting to Kiev invasion and escalation with European Parliament giving EU candidate status. Here is a link to JPM Ukraine war.
FED Fractal – November 22, 2021: Powell Re-nomination – first 15 minutes moves: USd up from 1.1287 to 1.1238, SPX up from 4709 to 4728, XLF up 1%, US 10 year reates 1.58% to 1.59%, TAN uip 2%, XLV/XLP down, XLB up 1%, smh up 2%, xop/xle flat, rty up 0.8% (down after 5 minutes to 0.3%), – after 2 hours: esz1 0.7%, NQZ1 0.25% down, RTYZ1 uè 0.8% up, XLF up 2%, AMZN from +0.56% to -2%, XOP +3%, xlu up 0.7%, xlp +1.2%, FB from +2% to -0.8%, aapl stays up 3%
Inflation risisng Fractal – December 14th, PPI very strong before Fed meeting. RTY up, nasdaq down, 10yr rate up, dxy up, sectors: xlb +0.6%, XLf +1%, xlu -0.3%, xlp -0.2% , xly -0.66% , xle +0.6& at 16 swiss time. With the record-breaking PPI read, the pressure on the Fed to pick up the pace of tightening is only mounting. And with higher prices Stocks Drop as Inflation Spike P
COVID resurgence – Covid is not anymore a powerful force in the markets. There are the following prior fractal dates: (1) November 22, 2021: Covid resurgence – usual suspects: MA US -5%, ABNB -8%, PYPL -4%, SQ -8%, AFRM -10%, UBER -4%, shop -5%. MRNA +9%, (2) November 26, 2021 : new variant from South Africa, B.1.1.529. In 2021, other dates for Virus resurgence are July 19th, surging Covid-19 cases in the U.K. and concern that the spread of the delta variant will halt the economic recovery – this fractal has similarity with Nov 26 as in the middle of holidays (less liquidity). The selling followed a familiar Covid-era pattern. Shares of companies that cater to stuck-inside consumers, like Zoom Video Communications (ZM), and vaccine-makers Moderna (MRNA) and Pfizer (PFE), rose, while reopening stocks like Delta Air Lines (DAL), Ryanair (RYA ID) and Meituan (24551 HK) each down more than 8%.
China trade war fractal – Michelin Seen as losers from easing freight (more imports), raw mats easing (puts the brakes on pricing) and improving production (OE mix headwind, rotation into component names). Also FSLR suffering from localizing in US its production of solar panels.
THEMATICS
SLOWBALIZATION – Geopolitics are accelerating slowbalization and the multipolar world, providing more incentives to near-shore or “friend-shore” supply chains: All this “geopolitical capex” has to drive capital somewhere. Some geographies and sectors are likely beneficiaries: For US and European companies, friend-shoring is more attractive in countries with larger labor pools, competitive wage costs, and trade agreements with key end markets. In varying ways and to varying degrees, Mexico, India, and Turkey are recipient candidates. And regardless of the location, building these new supply chains will almost surely drive a pick-up in demand – and profits – in sectors like semiconductor capital equipment, automation, clean tech, defense/cybersecurity, industrial gases, cap goods, and metals/mining.
COMING EVENTS
TUESDAY JULY 5
Japan Labor Cash Earnings: We expect total cash earnings to increase by 1.5%Y in May.
Australia RBA Rates Decision: We expect the RBA to raise the cash rate by 50bp to 1.35% in July.
US Factory Orders: Consensus expects factory orders to rise by 0.5%M in May, vs 0.3%M prior.
WEDNESDAY JULY 6
German Factory Orders: We expect a 1.0%M fall as overall activity in the economy cools.
Euro Area Retail Sales: We only expect a partial 0.5%M rebound in retail sales in May after April’s 1.3%M slump.
US ISM Non-Manufacturing Composite: Consensus expects the ISM non-manufacturing component to be 54.2 in June, down from 55.9 previously.
THURSDAY JULY 7
German Industrial Production: Industrial production expected to slow but remain positive in May, at 0.4%M.
US ADP Employment Change: Consensus expects the ADP employment change to be 193k in June vs. 128k prior.
US Trade Balance: Consensus expects the US trade balance to be -US$86.6 billion in May vs. -US$87.1 billion prior.
Poland NBP Rates Decision: We expect the NBP to deliver a 75bp hike. We see risks as balanced and assign an equal 20% chance to a 50bp or 100bp hike.
FRIDAY JULY 8
Brazil IBGE Inflation IPCA: The 12-month inflation print should be back above 12%Y, pushed by the fuel price increase announced in mid-June and the health care plan adjustment.
US Change in Nonfarm Payrolls: We forecast nonfarm payrolls to rise by 325k in June, after rising by 390k in May.
US Unemployment Rate: We forecast the unemployment rate to remain unchanged at 3.6% in June.
ECB MEETING – two-day meeting starting July 20