In this « every day » updated letter, you will find our current view based on our regional matrix, our fundamental convictions and our charts. The current Market Focus are analysed. Then, you will find our major thematics for the year. Quantitative factors and fractals currently driving the market are presented with the weekly change of our quantamental portfolios. Coming events and earnings are also anticipated. This is a very long letter, so just jump where you have some interest.
Julien Stouff, 2022
Real time letter July: Animal spirits are back
Quick links
- S&P500 Charts and trading plan
- Our matrix
- Positioning and recent changes
- Our current fractals
Parodos
Please go directly to our daily trading plan here….
The major indexes enjoyed solid-to-strong weekly gains amid a an extremely busy one for global central banks. There was limited surprise to bond markets as the Fed and ECB raised another 25bps with more hints they are getting close to the end of their tightening campaigns. Tame inflation bolstered hopes for no more hikes. More specifically for the Fed, the bond market is currently pricing in no more hikes this year and close to 125bps of cuts next year. The equity leadership has changed in July, with the AI hype slowly fading away as rates climb higher in front of stronger economic data. Since the July 12th 3.00% CPI print, the top two performing sectors have been Energy and Materials. Energy (equal weight) traded to its first 3-month relative high vs. the S&P since 4Q ’22, and Materials are not far behind.
Our quantitative process gives the following outlook for the coming weeks:
- The Regional Matrix is bullish overall with a +15% recommended net exposure.
- This constructive positioning is justified by technical charts showing that indexes broke-out very strong resistances. What’s more, in the past, a strong 1H for equity markets has been followed by a strong 2H: in the 10 observations with Nasdaq up more than 20% (Eurostoxx50 more than 16%) in 1H, the market has been up 7 out of 10 occasions in 2H, with a median move of +18% (the SX5E has been up 8 out of 10 times in 2H with a median 2H return of +9%). Looking back to 1928, there have been 19 prior years where the S&P500 was up +15% or more in 1H. Market history tells us the average return in 2H in those 19 years is 2x the average.
- Our Sector matrix favours TMT (Technology and Communication) and Discretionary in 2023: this is confirmed by the outperformance of the Nasdaq100 versus the rest of the world. It is underweight defensive sectors like staples or health-care.
- While China reopening has felt like a clouded dream for months, it has not been a straight line with many pauses and pivots: The overall bullish direction should provide a buoy for global demand – perhaps we are finally seeing light at the end of the tunnel.
- Risks: the next several months see the weakest DM growth, the most risk to US EPS and the biggest uncertainties for liquidity through end-2024. For instance, expectations for 2Q numbers are for -4.6% y/y earnings growth at the index level, up from -5.6% realised last quarter (read more here for coming earnings).
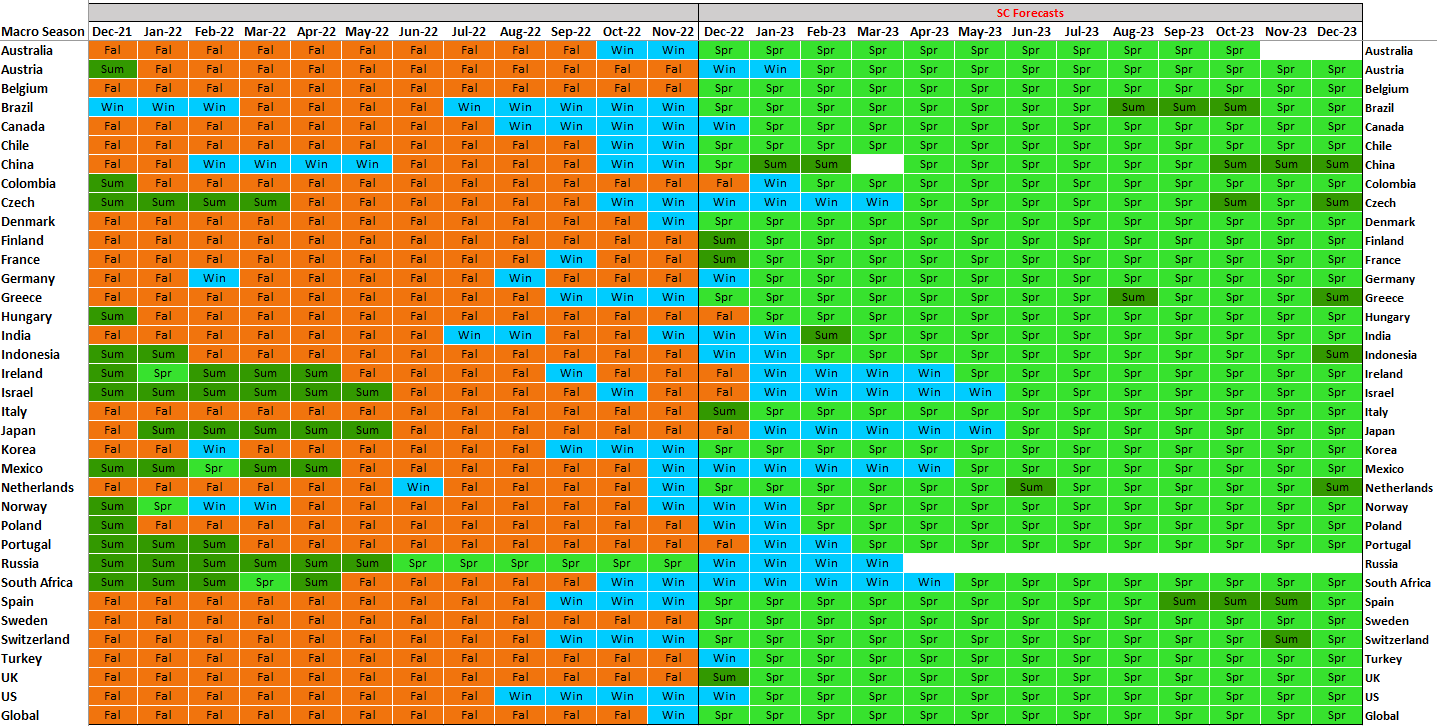
Looking at our Macro tool, Kairos, finding out on where we sit in this cycle and how much further we have to go, the start of the year pattern of performance resembles post-crisis/recession periods, which we define as Spring in terms of economic season or Hope in terms of market cycle. Spring means that this new leadership is supported by falling inflation, declining recession risks, and expectations of a Fed pivot.
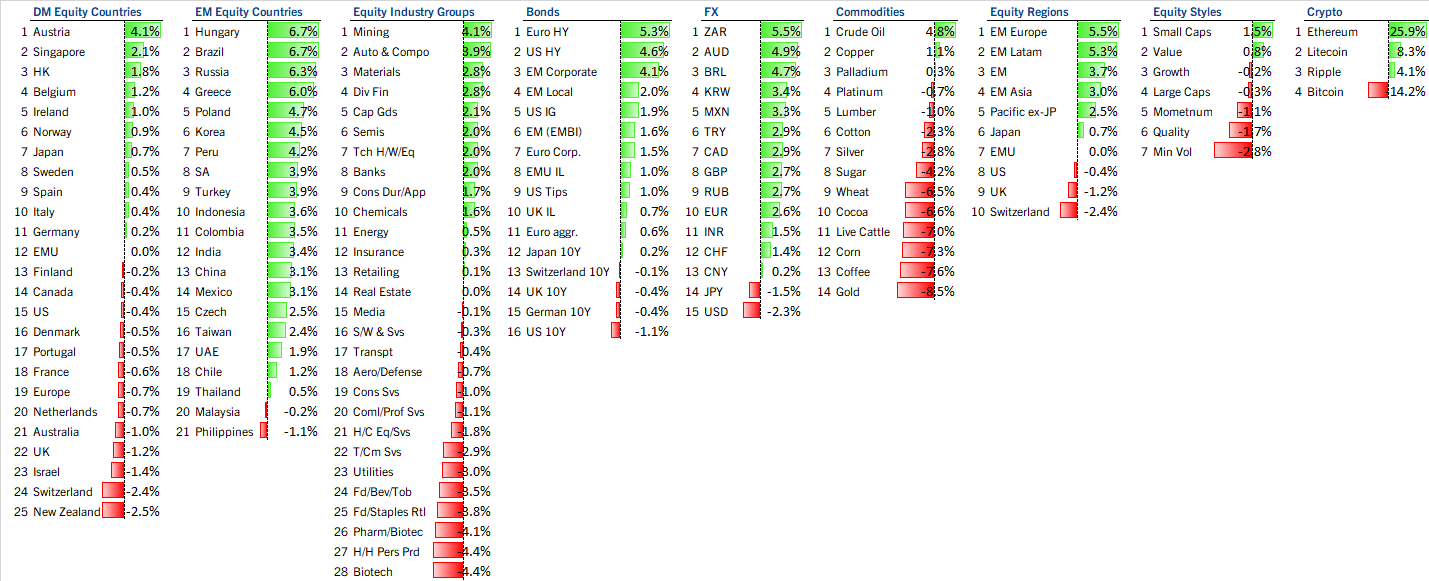
As a remainder, Kairos, our Market Cycle Matrix is switching from Winter (inflation receding with lower growth) to Spring: more growth and less inflation. Indeed, a lot of countries are going to switch to a new cycle which we call Spring (higher growth with lower inflation). The table below shows which sectors to own (Mining, Auto, Materials), which factors (Value, small caps), which regions (Europe, EM) and commodities (crude oil, Copper). Spring is a total reversal of Winter; thus the switch from Winter to Spring is producing massive rotation from defensive/ low vol/ US centric towards Small caps/ Value/ cyclicals. If there’s no recession, inflation may not subside as quickly. Long-term Treasury yields, instead of collapsing in an economic downturn, might act as a headwind for growth stock valuations. Yet international stocks, long out of favor, might extend their recent run as growth recovers overseas, justifying all the more the Spring suggestions.
The table below shows which countries/ industries outperform and underperform in Spring:
Coming events susceptible to move the market this week can be found here. The main changes of our quantamental portfolios are described below:
Trades recap and Quantamental portfolios
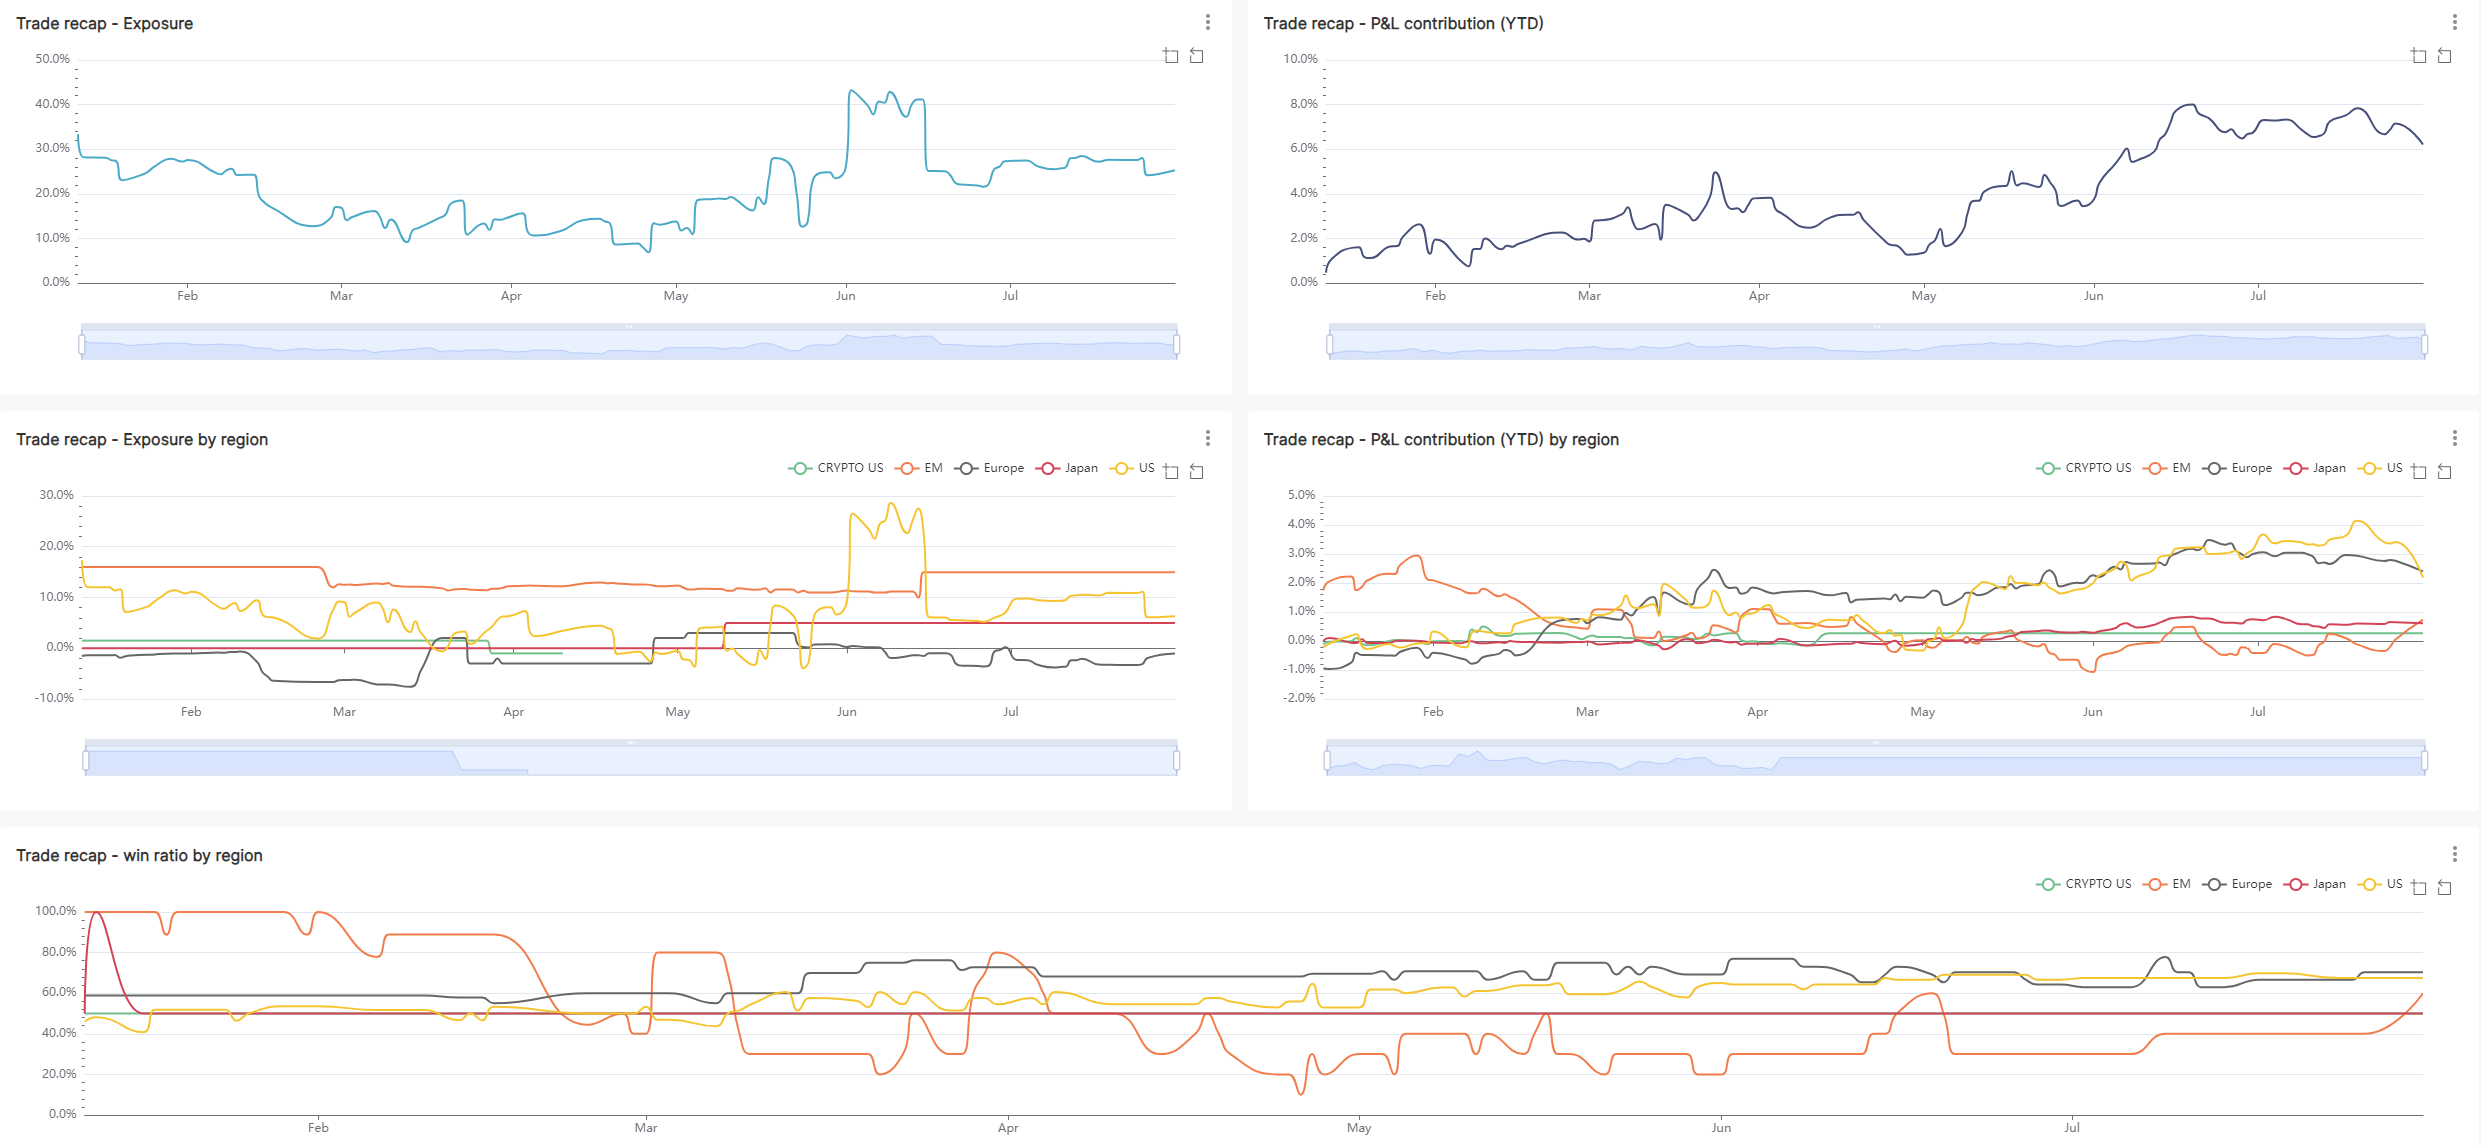
Net exposure is around 22% on July 31st. In terms of regions, we are OW Japan and EM/ China. Europe is neutral/ ready to be shorted and we are reducing our US allocation. In Sectors, we are OW TMT, Discretionary. We communicated through a trading alert an increased allocation in materials.
Our regional SC portfolios can be found here. On the top right corner, under Portfolio name, select any of our portfolios (SC SPX long for the US quantamental portfolio, SC SXXP long for the European portfolio, etc…). Then, all the components of the selected portfolio are sorted by sector, with their respective quantitative grades and recent performance measures. These portfolios are updated at least on a weekly basis after the calculation of the quantitative grades of our universe of the most liquid global stocks. First, our algos identify the best companies based on their respective 6 factors, which are weighted with respect to the current market cycle. Then, this purely quantitative crop of the cream is generally halved based on fundamental/ thematic/ risk-reward/ esg or other discretionary purposes.
Main market focus for the near future are enumerated below:
Market focus – What drives markets currently ?
The Fed – Fed hikes, but Powell dovish
The Fed hiked its key rate a quarter point to a 22-year high, but chair Jerome Powell took a some- what-dovish tilt. “We’re coming to a place where there really are risks on both sides,” he said. Monetary policy, he says, is now put-ting downward pressure on economic activity and inflation, so the Fed can be patient. Powell seemed open to standing pat or raising rates at the September Fed meeting.
Soft landing for economy?
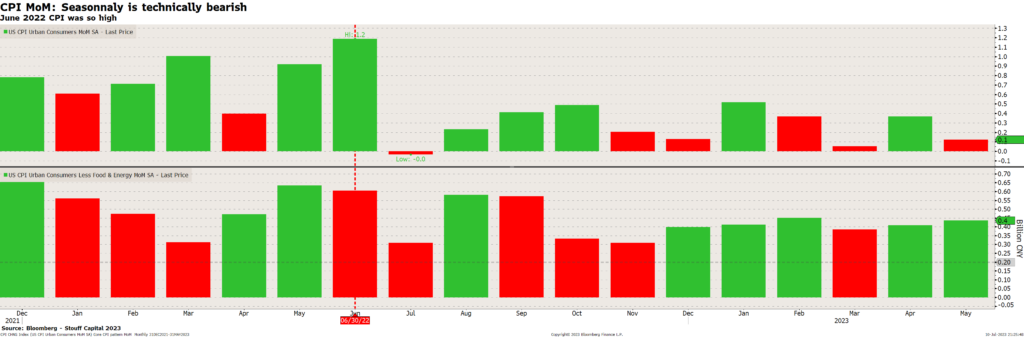
The Fed’s primary inflation rate, the PCE price index, showed core prices up just 0.2% in June. The core inflation rate eased a bit more than expected, to 4.1% from 4.6% in May. Overall inflation fell to 3% from 3.8%. Meanwhile. U.S. GDP growth accelerated to a 2.4% annual rate in Q2 from 2% in Q1. Business investment is ramping up as consumer spending cools. Initial and ongoing jobless claims were surprisingly low.
Dovish ECB LEAVES SEPTEMBER ON A KNIFE-EDGE. The ECB softened its forward guidance and is now fully data dependent. The market read this as dovish, focusing on a few interesting changes in language. Future decisions will ensure that rates “will be set” at sufficiently restrictive levels to get inflation down to 2%. Secondly, Lagarde did not repeat her previous guidance that there was more ground to cover, and instead noted that data will determine “whether and how much more ground” there is to cover. While acknowledging the deterioration in growth, there continues to be a lot of emphasis around sticky services inflation and wage data. But The combination of falling headline inflation, firm wage growth and ongoing employment gains points to a notable improvement in real household disposable income. So, unless growth assets fall and financial conditions tighten, the case for insurance hikes will stay on the table beyond September. November and December meetings are probably not pricing enough premium (5.4bp and 2.4bp priced respectively). Remember Schnabel: “we need {to} err on the side of doing too much rather than too little”.
A POST COVID WORLD -. The long tails of fiscal stimulus, have propped up the economy for far longer than anyone expected. That government spending was meant more or less as an emergency buffer to get the U.S. economy back on track in 2020 and 2021 after months of shutdowns and other restrictions. But given the sheer amount of it—a sum equivalent to roughly a quarter of U.S. gross domestic product—and given how much of it was structured as direct payments to individuals, the aid has continued to stimulate the economy years after the first packages were passed. Green infrastructure initiatives, is just beginning to flow out. Excess consumer savings and an ebullient labor market fueled demand for travel, restaurant dining, and other services, where spending still has room to grow. And years of low interest rates have transformed the debt dynamics for the overwhelming majority of U.S. households, leaving them largely shielded, through fixed-rate mortgages, from the impacts of the Federal Reserve’s primary tightening tool. The result is an economy that has yet to fully react to the policy tools designed to slow inflation, which more often than not have forced a recession. The recent spate of positive economic data has fueled hopes of a “no landing” scenario, rather than a hard or soft landing, in which the economy continues to expand. But a more realistic outlook is less benign: Interest rates are likely to stay higher for longer to tamp down stubborn price growth, probably forcing at least a mild downturn along the way. Then came the banking crisis. Banking panics aren’t something to be trifled with: it is the equivalent of a rate hike, at a half-point or even 1.5 percentage points. The problem, isn’t only the possibility of more bank failures. It’s that banks are likely to curtail lending—lending they had already started to limit. Even before the failure of SVB, the Fed’s January Senior Loan Officer Opinion Survey showed that the percentage of banks tightening lending standards had risen to 44.8%, the highest reading since July 2020, at the peak of the Covid lockdowns. Given the problems at regional banks, that percentage is likely to go even higher.

Our research report The Art of tragedy , analysed in March 2021 what the impact can be on stocks from tightening conditions; the above chart shows that the Art of Tragedy has not derailed bull markets but instead created many intermediate corrections. In this chart, we extrapolate past tightening on the path of the S&P500 (black Long dash line) and the US 10YR (blue line). After a correction period (ending in march 23), both rebound to new highs (4510 then 4900).
The 2022 macro focus was dominated by the highly positive correlation between bond and stock prices (i.e. rising yields and falling stocks), where exogenous central bank action drove real rates higher (above chart) pushing discounts rates up, sharply impacting equity valuations. The explicit intention of the Fed to tighten financial conditions meant that both bonds and stocks were consistently under pressure. Looking ahead, as central banks prepare to stop (or pause) hiking by the summer, the FCI loop becomes less of a driving force…moreover, as the market flips from obsessing about inflation risk to obsessing about growth/recession risk, we see a period where bond/equity correlations turn negative again.

The above chart is our favorite to monitor the relationship between Real US long term yields and equities. Indeed, there has been a tight link since 2017 between after-inflation Treasury yields (real yields) and the valuation of the market using forward price/earnings ratios; a higher yield on benchmark 10-year Treasury Inflation-Protected Securities has meant lower P/E ratios. The steep rise from March 31st until mid-Octobre 2022, had generated a longer consolidation for equities. From mid-October to now, real yields have been range bound between +1.05% and +1.75%, currently in the middle at 1.64%. This has enabled equities to breakout.
What charts tell us
S&P500
Daily chart shows the S&P500 has broken its strong declining resistance, which opened the road to higher levels at 4947.
Chart 1: game plan on the S&P500 daily 12 month – breakout towards 4950

Chart 2: game plan on the S&P500 intraday – ESU3 high band channel reached

From May ES is in a broad dip buy regime. On June 1st ES broke out, beginning a substantial leg up and “buy all dips phase” towards 4520. This has been one of the most impressive uptrends in recent memory. We have also broken out a multi-week chart pattern, and the targets on this are much higher at 4950.
Plan
- Supports are: 4555, 4545-40 (major), 4534, 4520-27 (major), 4507, 4493 (major), 4486, 4475, 4467 (major), 4558 (major), 4447, 4435-40 (major).
- In terms of lvls I’d bid direct: The core structure I am watching remains the purple triangle with resistance at 4568-66, and as of now, we are just under it. Long-term readers know the drill now, and bears are in short-term control until a resistance clears, now 4568. I’d consider adding long exposure on the clearance of this level, perhaps 4571 or so. Ideally, I’d want to see the zone accepted first (price base at the level), as I do not chase. Level to level profit takes as always. If we continue the sell lower, understand that because of the failed breakout, longs will have lower win rates. Treat them as high fail rate knife catches. The levels marked as (major) would be spots I’d look to catch level to level moves and I particularly like the 4527 area.
- Resistances are: 4566-68 (major), 4573, 4584 (major), 4592, 4600, 4608 (major), 4613 (major), 4623 (major), 4628, 4636, 4644-47 (major), 4656, 4664, 4673 (major). I consider 4584 and 4608-13 as being the strong resistances on the upside and decent spots to look for possible initial reaction shorts.
- Bull case: The presence of a failed breakout now of the purple ascending triangle is a bearish macro setup. As a result, I will assume are higher risk now until proven otherwise by level reclaims. The 4568 reclaim would be the first minor success for bulls, with 4584 being the second. In order to cleanly resume the leg up to new highs, the triangle must break back out again at 4608-13. In terms of spots to add on strength, any of the above reclaims represent long opps for me. As always, I do not chance – I’d need to see an initial dip at the level to drain supply, followed by acceptance, then get long a few points above. For the 4584 level, this would be 4586ish. A bull case tomorrow would look something like reclaim 4568, back-test 4584, dip again, then try back to 4608.
- Bear case: Short term, begins on the fail of 4555 now. I’d be interested in shorting here. As always, I don’t chase. I’d need to see a bounce at the level, or failed breakdown, followed by acceptance. Then I’d consider short perhaps 4553 for a move down the levels.
In summary: We are into very volatile, complex action now and this is where fully unbiased, level to level day trading is required. I do not like to “predict” but if I had to give a coin toss lean, it would be that ES could try to engage more inside the triangle. Perhaps something like reclaim 4568, run to 4584 or so, dip again, then try back to 4608. If 4555 fails, the triangle will be confirmed broken down and we can work down the levels to 4540-45, then 4527 (and ultimately, all the way to 4490).
Sentiment – Optimism is back but statistics are outright bullish
We use our Sentiment grades as a contrarian tool: when investors are greedy with their too exuberant Sentiment, we add downside convexity (but out the money Put) when markets are bullish and/ or reduce our long. We can even go short if a CPD (Change Point Detection) condition is enacted. To the contrary, when investors are too pessimistic, we add some longs in a bullish market, or even pass net long in a bearish market.

Barrons cover is famous for being wrong at major junctures. This weekend cover speaks by itself. Optimism is back and this is shown by our SC sentiment indicators. As we always say this is not (yet) a sufficient reason to sell everything. We would wait for a reversal. However and this is a good news – most bull markets breakout with strong optimism. So we are either still in a bear market rally and it is time to sell or this is a NEW BULL MARKET.
But recently, Smart Money fades the bullish trend. These traders are typically the most confident in a rally after a prolonged decline, and stocks often soon trough. Dumb Money mainly reflects trend followers, and it’s correct during the meat of a move. But they’re also the most confident just as stocks tend to peak. As stocks have rallied for nearly three weeks, these models have become bearish from a contrarian point of view. Indeed, the strong rise of equities in the last days has pushed our short term SC sentiment in too optimistic lands. A reversal of spx below 4437 had triggered a bearish cpd.
Chart 3: SC US Sentiment indicator, medium and short term too optimistic

The chart above shows our two SC Sentiment indicators, one for the short and the other one for the medium run. Let’s analyse what they told us in the last 12 months: Sentiment toward stocks reached its trough in September 2022 (denominated extreme Fear in the bottom panel of the above chart). Then the speculative uptrend heading into Mid-February coincided with a peak in some higher-risk assets but not the major indexes. As those indexes trudged lower in March, sentiment has become too pessimistic again. In the above chart, the 3rd chart shows the ratio of Smart money Versus the Dumb Money” traders. When the Dumb money grade is down to les than 40%, the Win Rates for two weeks to 3 months in the table above are impressive. Still, with the character of the market seemingly in a state of change – and with more significant concern about a potential bear market – it can be helpful to look at action during previous bear markets. During those stretches, any rallies that may follow a Dumb Money Confidence signal tended to be short-lived (i.e., two weeks to three months).
Below we present a list of indicators composing our aggregate sentiment indicators:
Dip buying is back. Bloomberg had an excellent chart highlighting that when you look at the average 1D return in the S&P 500 following a down day, 2023 so far has been the second best year on record on data going back nearly 100 years. 2020 is the only year the dip-buying trend has been stronger. Showing the same data for the SX5E, 2023 is currently the strongest dip-buying year on record.
Breadth is finally rebounding. It’s no secret that Technology stocks have roared higher this year, though many seem to attribute it solely to the Magnificent Seven. Those stocks have been a large part of the gains in major indexes but also steal the limelight from what has been good performance under the surface. More than 93% of these stocks have climbed above their 50-day- and 200-day moving averages for the first time in years. The last time it occurred after a long dry stretch was in late 2020, as we emerged from the pandemic panic. When this many Technology stocks climbed above both moving averages for the first time in at least three months, it preceded mostly positive returns across time frames
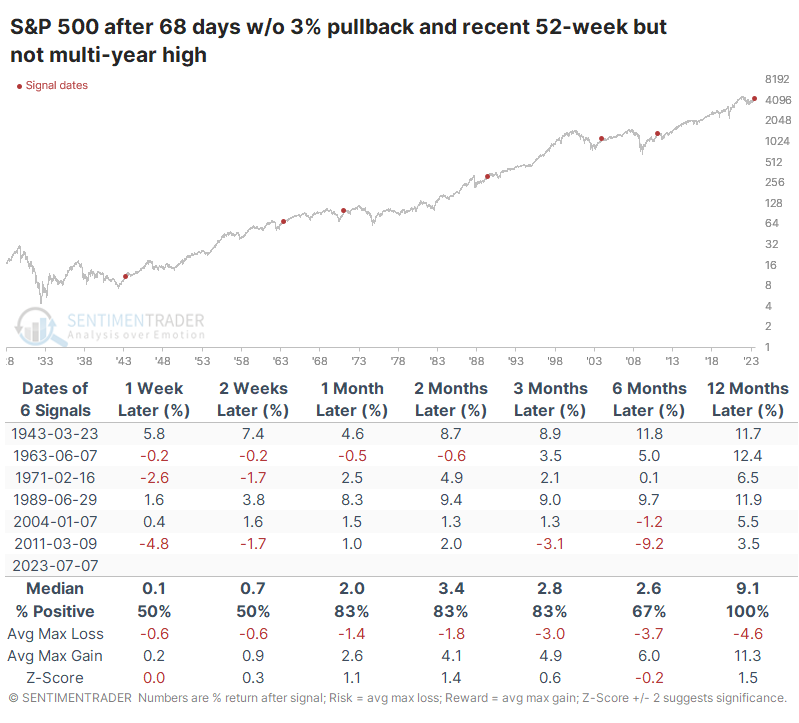
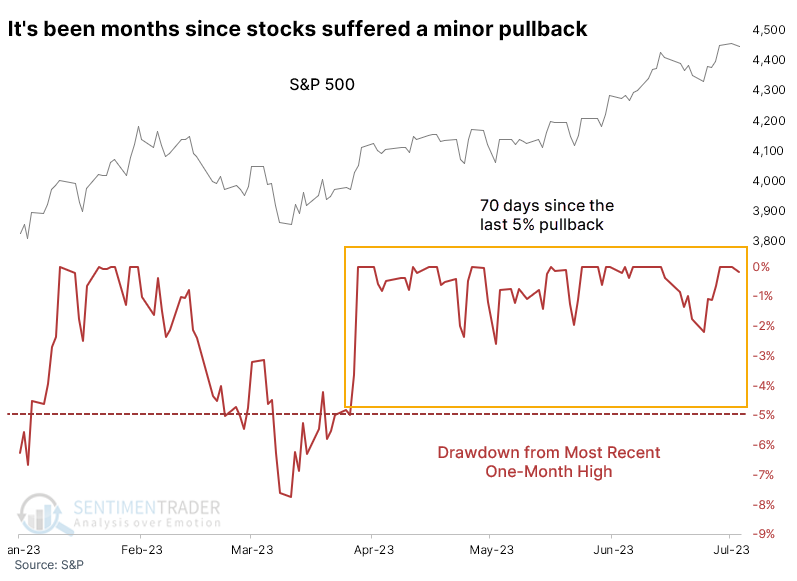
Then, the S&P 500 has gone months without even a 3% pullback. When such calm conditions persist with the index at a 52-week high, they tend to persist; Investors have become a lot more confident over the past couple of months. The most benchmarked index in the world has barely taken a step back for months, with no pullbacks larger than 5%, or even 3%, since March. The lack of a 3% pullback is a tough hurdle to cross, but the sample size doesn’t increase too much, even if we expand it to a 5% pullback. There were still only ten precedents since 1928, with essentially the same conclusion. Over the next 6-12 months, only a single signal witnessed a loss, though that loss was fairly significant. Calm conditions always make contrarians nervous. When those calm conditions exist for months at a time, with stocks continually hitting new highs, that anxiety is often rewarded, as stocks tend to become more volatile soon afterward. But when markets have not been hitting multi-year highs, it has more often occurred as markets move from a period of high volatility to lower volatility, and those conditions have a better record of continuing for months as opposed to ending imminently.
SURVEY – Going into details or components of our sentiment indicators, the American Association of Individual Investors flip is going to the 2021 levels. That shows more bullishness from individual investors, but that should not by itself meaning to sell everything: we need a reversal first.

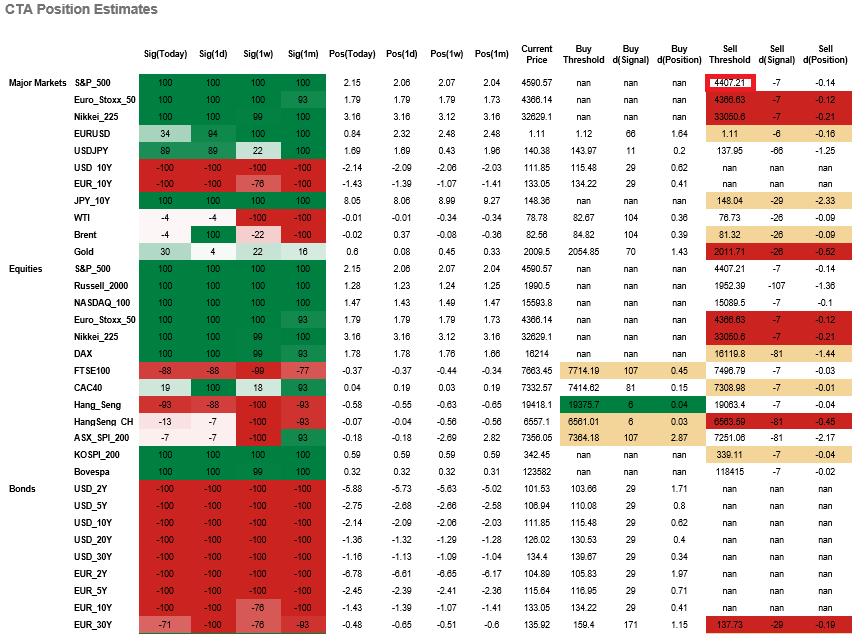
CTA, MARKET MAKERS, FLOWS – CTA are maximum longs on Nasdaq, spx, nikkei & (NEW) Russell. FTSE is less long. Level to sell for the S&P500 is far at 4426 (esu3), on dax at 16184, Eurostoxx50 at 4375, CAC40 sell at 7325. FTSE and Chinese indexes are net short, but the latter are in the process of being covered.
Hedge funds – HFs continued to increase their directional exposure to Global equities being net buyers for the 4th consecutive week. However, this was entirely a product of HFs covering shorts. In N. America, the recent pace of de-grossing continued. US Equity L/S net leverage was unchanged WoW at 49% (98th %-tile over last 12M; 60th %-tile over last 5 years).
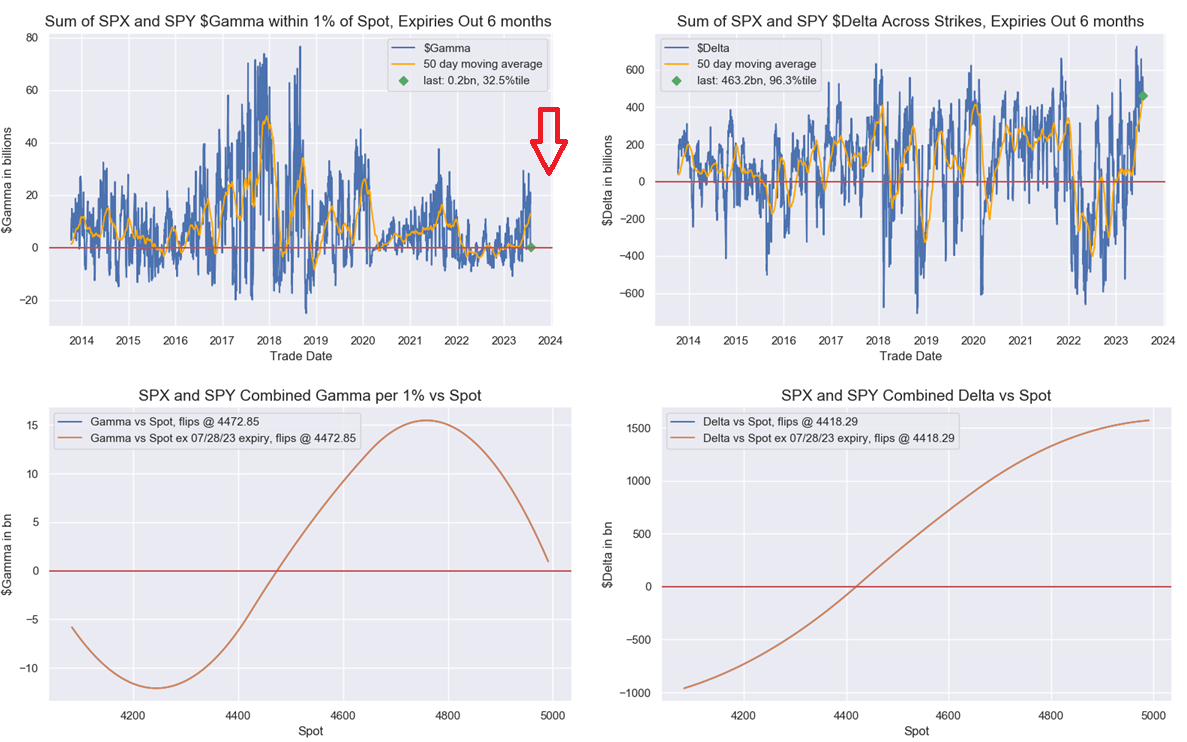
OPTION & GAMMA – Gamma Glut: Implied vols in the US have plummeted alongside a decline in realized vol: 1m SPX realized vol is now at 10% and VIX is at a 13 handle (a ~post-COVID low). This has been driven by a record amount of short-dated vol being sold in S&P 500 options. June 2023 was the largest month of customer gamma supply on records, at +$40bn of net gamma supply MTD. This tremendous vol supply has left dealers in very long gamma, which creates a positive feedback loop. Dealers were long gamma, which suppresses realized volatility as dealers sell rallies and buy dips, which leads to more vol supply – but at the end of July that has turned to neutral: watch out !
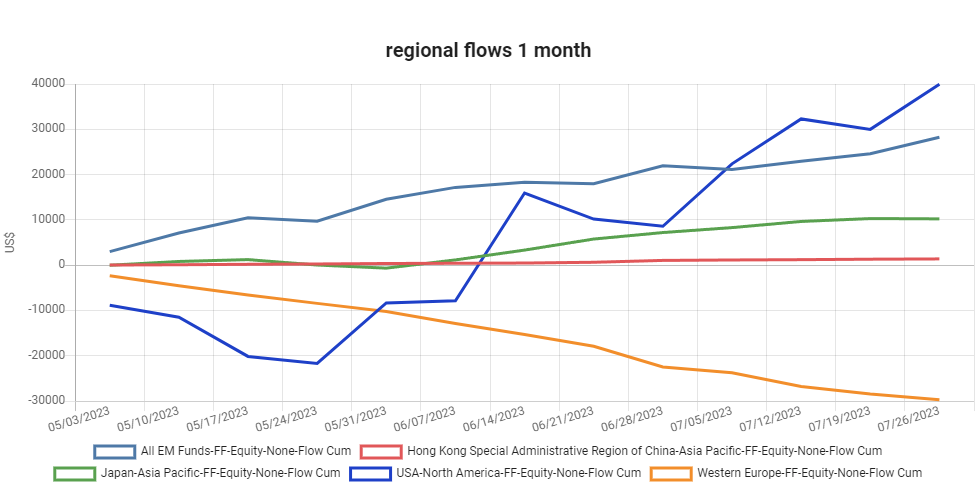
FLOWS ETF – In July, flows buy everything except European equities:
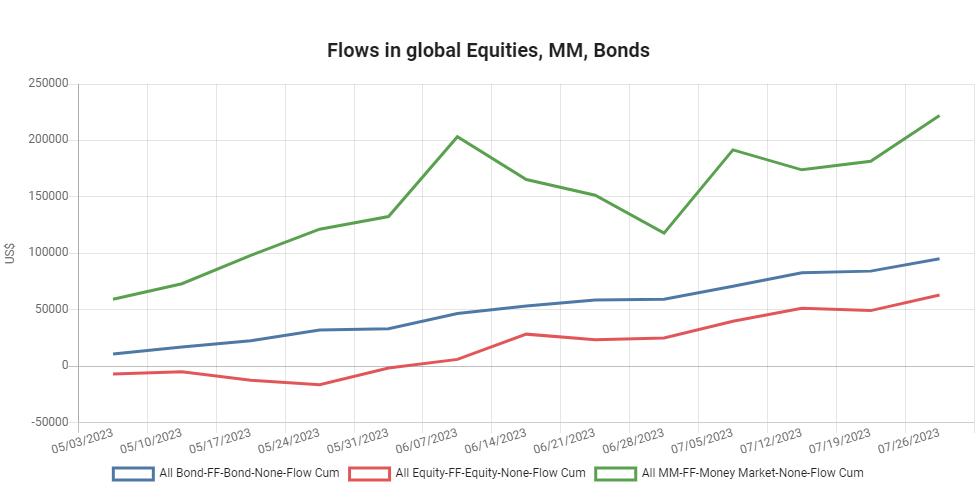
In terms of Equities, strong rebound in US amd EM equities in July. Western equities see continued outflows. EM and Japan sees sustained inflow in 2023.
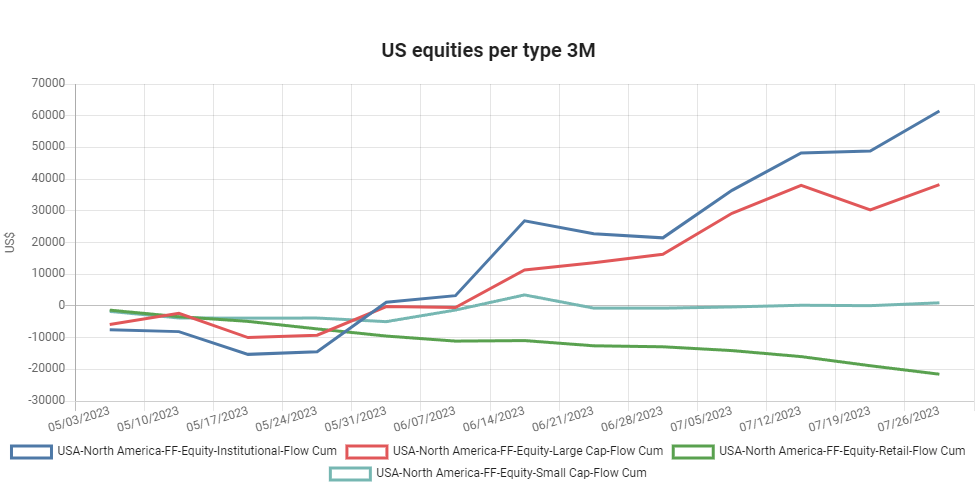
In the USA, Institutionals and Large caps funds rise while retail reduce their holdings and small caps funds get nothing despite their rise.
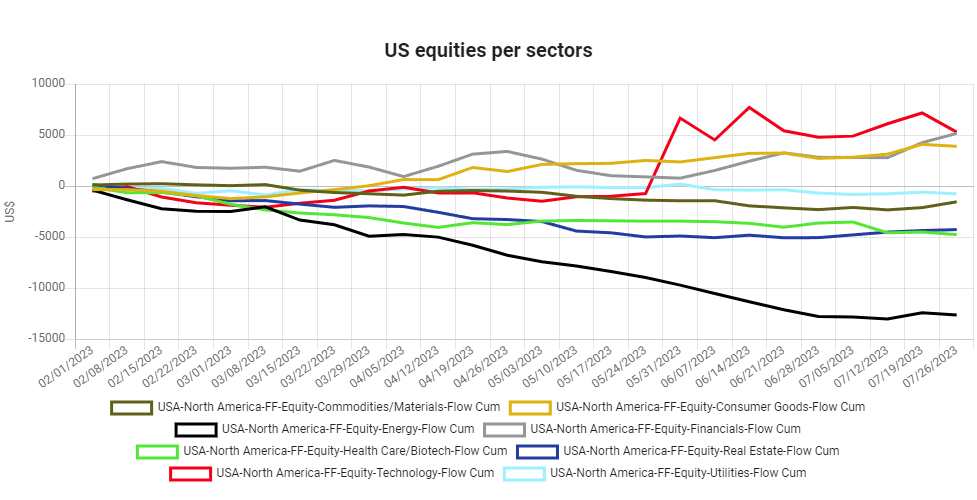
US Equities Breakdown :
In the USA, in terms of sectors, flows favoured Tech until mid-June, Consumer goods, while energy, real estate and health-care are sold.
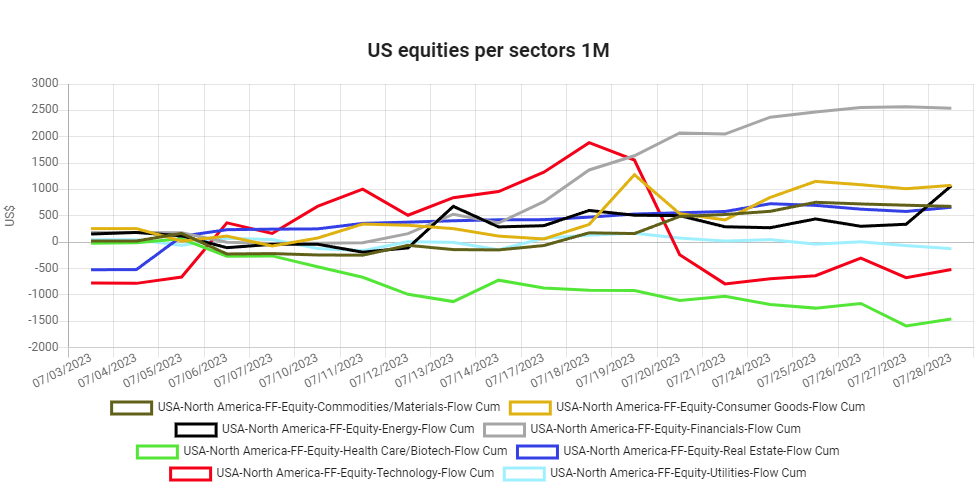
On the very short run, there is a strong rebound of flows into financials, from July 20th, and in energy in the last days.
What the research tells us…
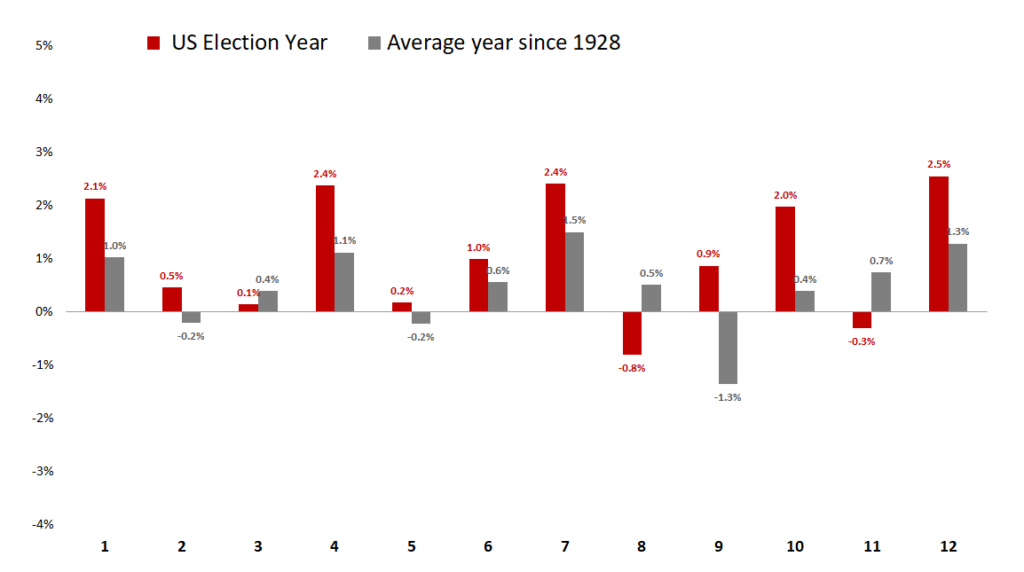

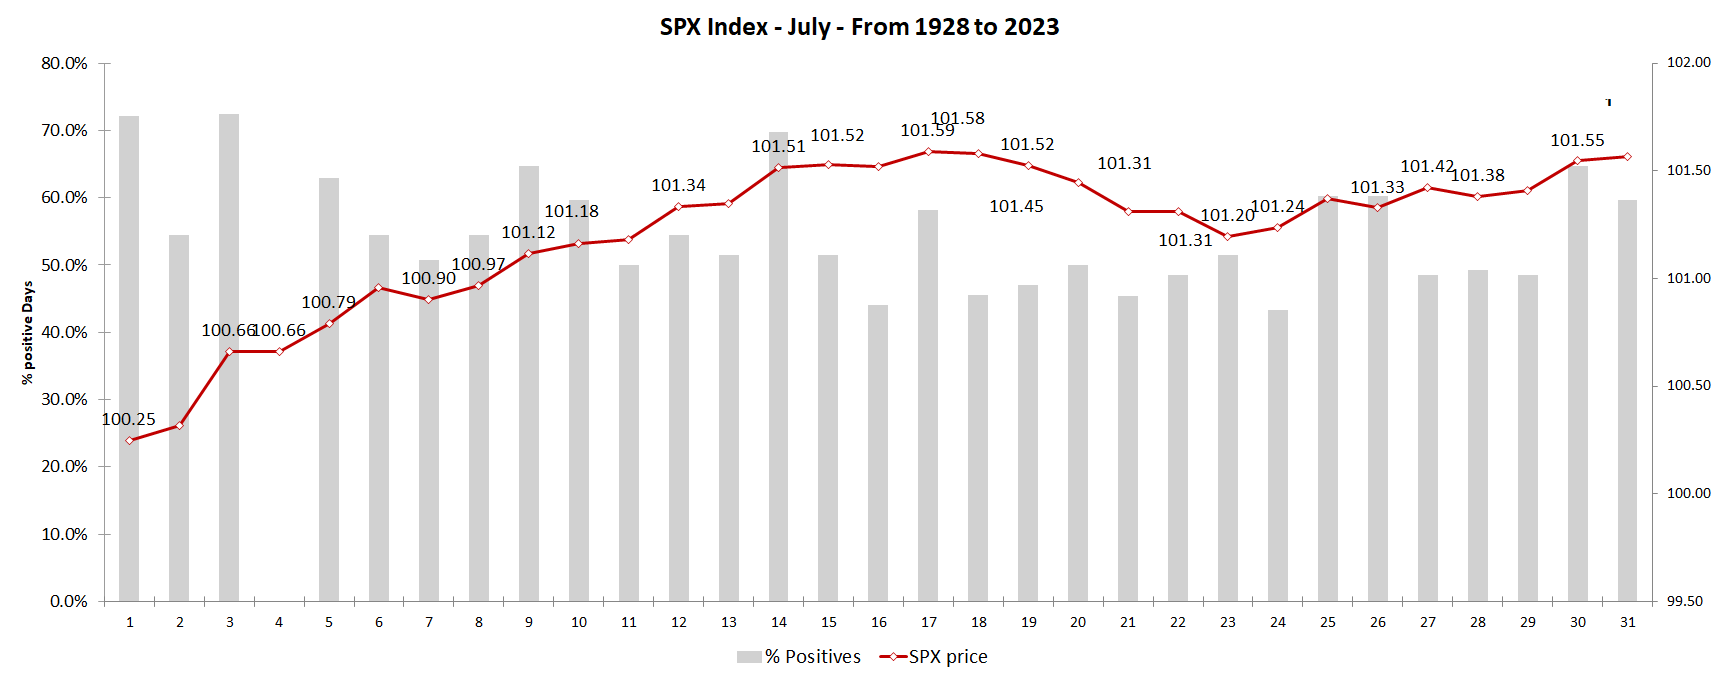
All these statistics on seasonality can be found here. November starts the best statistically positive period of the year. In the third year of a Democrat president, July is one of the best month of the year with a +2.5% return. July is strong until the 17th, corrects until 23rd and ends strongly the end of the month. The first days and week are very strong.
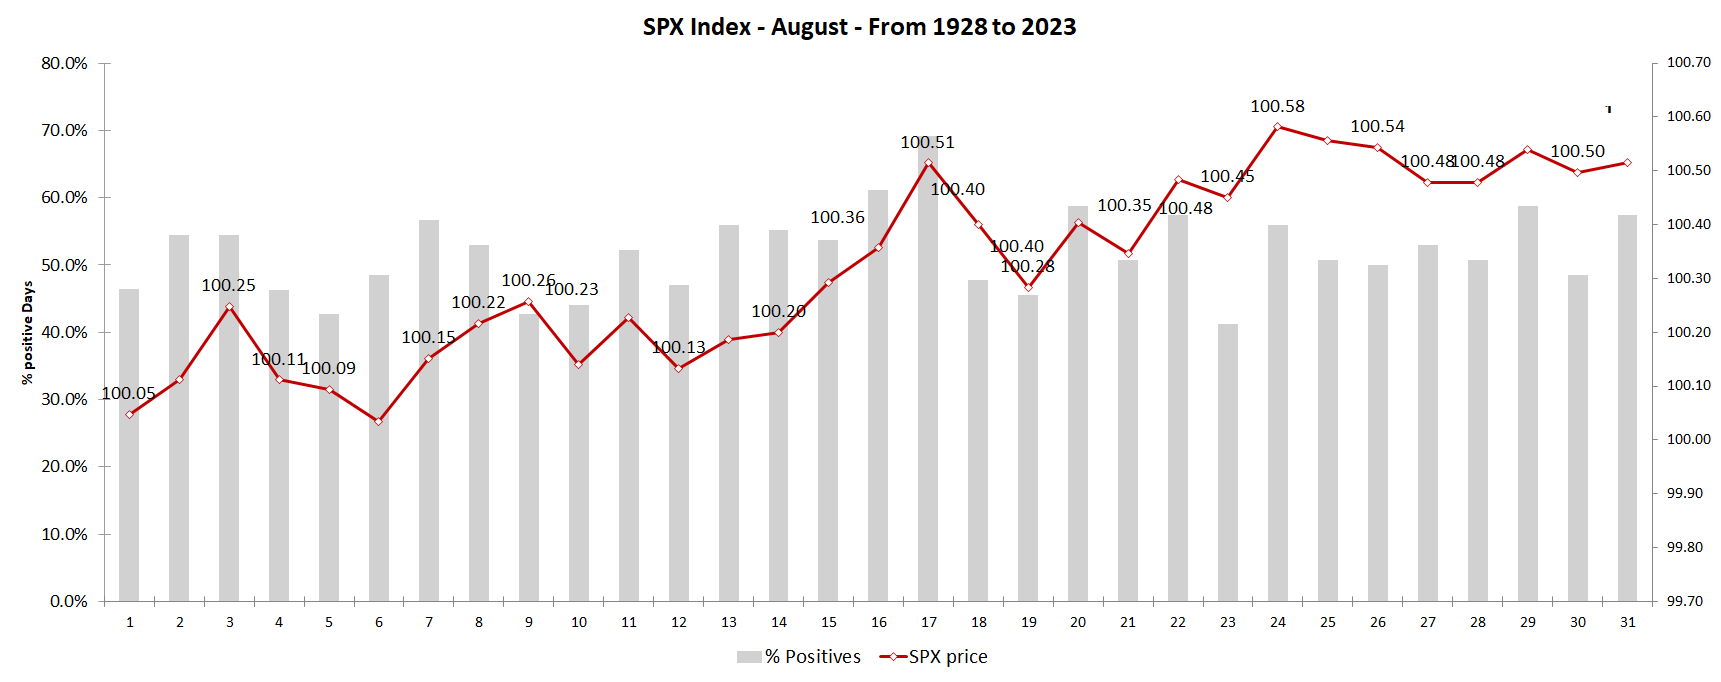
August is a more complicated month, and even negative for the second year of a Democrate president.
Global charts
Table: Macro Season for all countries in December 2022
With respect to global equities, the MSCI World has broken a multi-months resistance and should go back to its all time high.
Chart 4: chart on the MSCI World daily : BREAKOUT but need to breathe

The Nasdaq is a 2023 outperformer: its relative return was linked to the evolution of 10 YR US rates, but it is now essentially driven by the AI bubble:
Chart 5: Nasdaq 100 NDX – strong breakout at the 61.8 fibonnacci retracement

The Nikkei 225 Index is in fact a long USD versus JPY, explaining its massive outperformance until the end of October. It is now breaking a multi decades range trading, which is extremely bullish. But a double top formation with a higher yen is a new headwind.
Chart 6: chart of the Nikkei – breaking out multi decades range – wave 5 ungoing

The DAX and the Eurostoxx50 have been very strong outperformers from september 2022 to mid-may. But there has been a reversal from May 19th. Europe’s relative performance looks vulnerable near-term, as EU macro news flow slows and Growth stocks lead. Medium term, Europe’s relative performance is reasonably protected by a low starting valuation and more resilient EPS trends. Longer term, the region could benefit from global investors rebalancing portfolios to increase exposure to ‘International Value’ where Europe is arguably the best proxy.
Chart 7: chart of the DAX

Chart 8: chart of the Eurostoxx50 – all time High

While China reopening has felt like a clouded dream for months, it is not a straight line with many pauses and pivots: The overall bullish direction should provide a buoy for global demand – perhaps we are finally seeing light at the end of the tunnel.

The free liquidity indicator continues its upward trajectory as PPI is down to -5.4% (deflation in China !). Latest positive developments on property, Covid policy and US/China relationship could help amplify liquidity support. it’s worth noting that positioning in Chinese equities remains light (gross leverage is in the 26th %-tile since 2010) leading to some big swings as investors reluctantly rebuild positions. Chinese stocks got hammered last fall, dragging emerging markets indexes along with them. The recovery over the past few months has been impressive and at a pace typically not seen during ongoing bear markets, only at the end of them. But it came to an end at the time the liquidity stalled. It stays a very frustrative allocation despite our regional matrix staying OW. PBOC CUTS RATE ON 1-YEAR MLF LOANS TO 2.65% FROM 2.75%, but also got more noise regarding potential stimulus measures (still just rumors), and even some POSITIVE GEOPOLITICAL headlines, which is always good (with China’s President Xi meeting with US Secretary of State Blinken today (Jun 19), after Blinken’s meeting with Qin Gang, China’s Foreign Affairs Minister, and Wang Yi, director of the CCP Central Committee Foreign Affairs Commission Office. This development signals a step forward in the recently intensified re-engagement between the US and China and it may increase the odds of a Biden-Xi meeting in Nov near the APEC Summit in San Francisco. Any clarity on that would help alleviate some of the pressure from geopolitical uncertainty and China’s equity risk premium. The incremental positives are on track on the two critical market hurdles we previously highlighted: 1) Policy stance; and 2) geopolitical uncertainty. But more is needed.
Chart 9: fxi us (chinese adr) – a rally underway in wave 3 and III

EEM has rebounded until Jan 26th, 2023, helped by lower US interest rates (blue line on chart 10) and lower dollar (red line). Dollar Regime change historically helps Emerging equities. Retracement this year in DXY evidently had an impact in EEM, and if the USD will decline through the year, EM should out-perform again.
Chart 10: chart of the MSCI Emerging equities – difficult rally with rebounding dollar in a big wave III

What our Matrix tells us : bullish
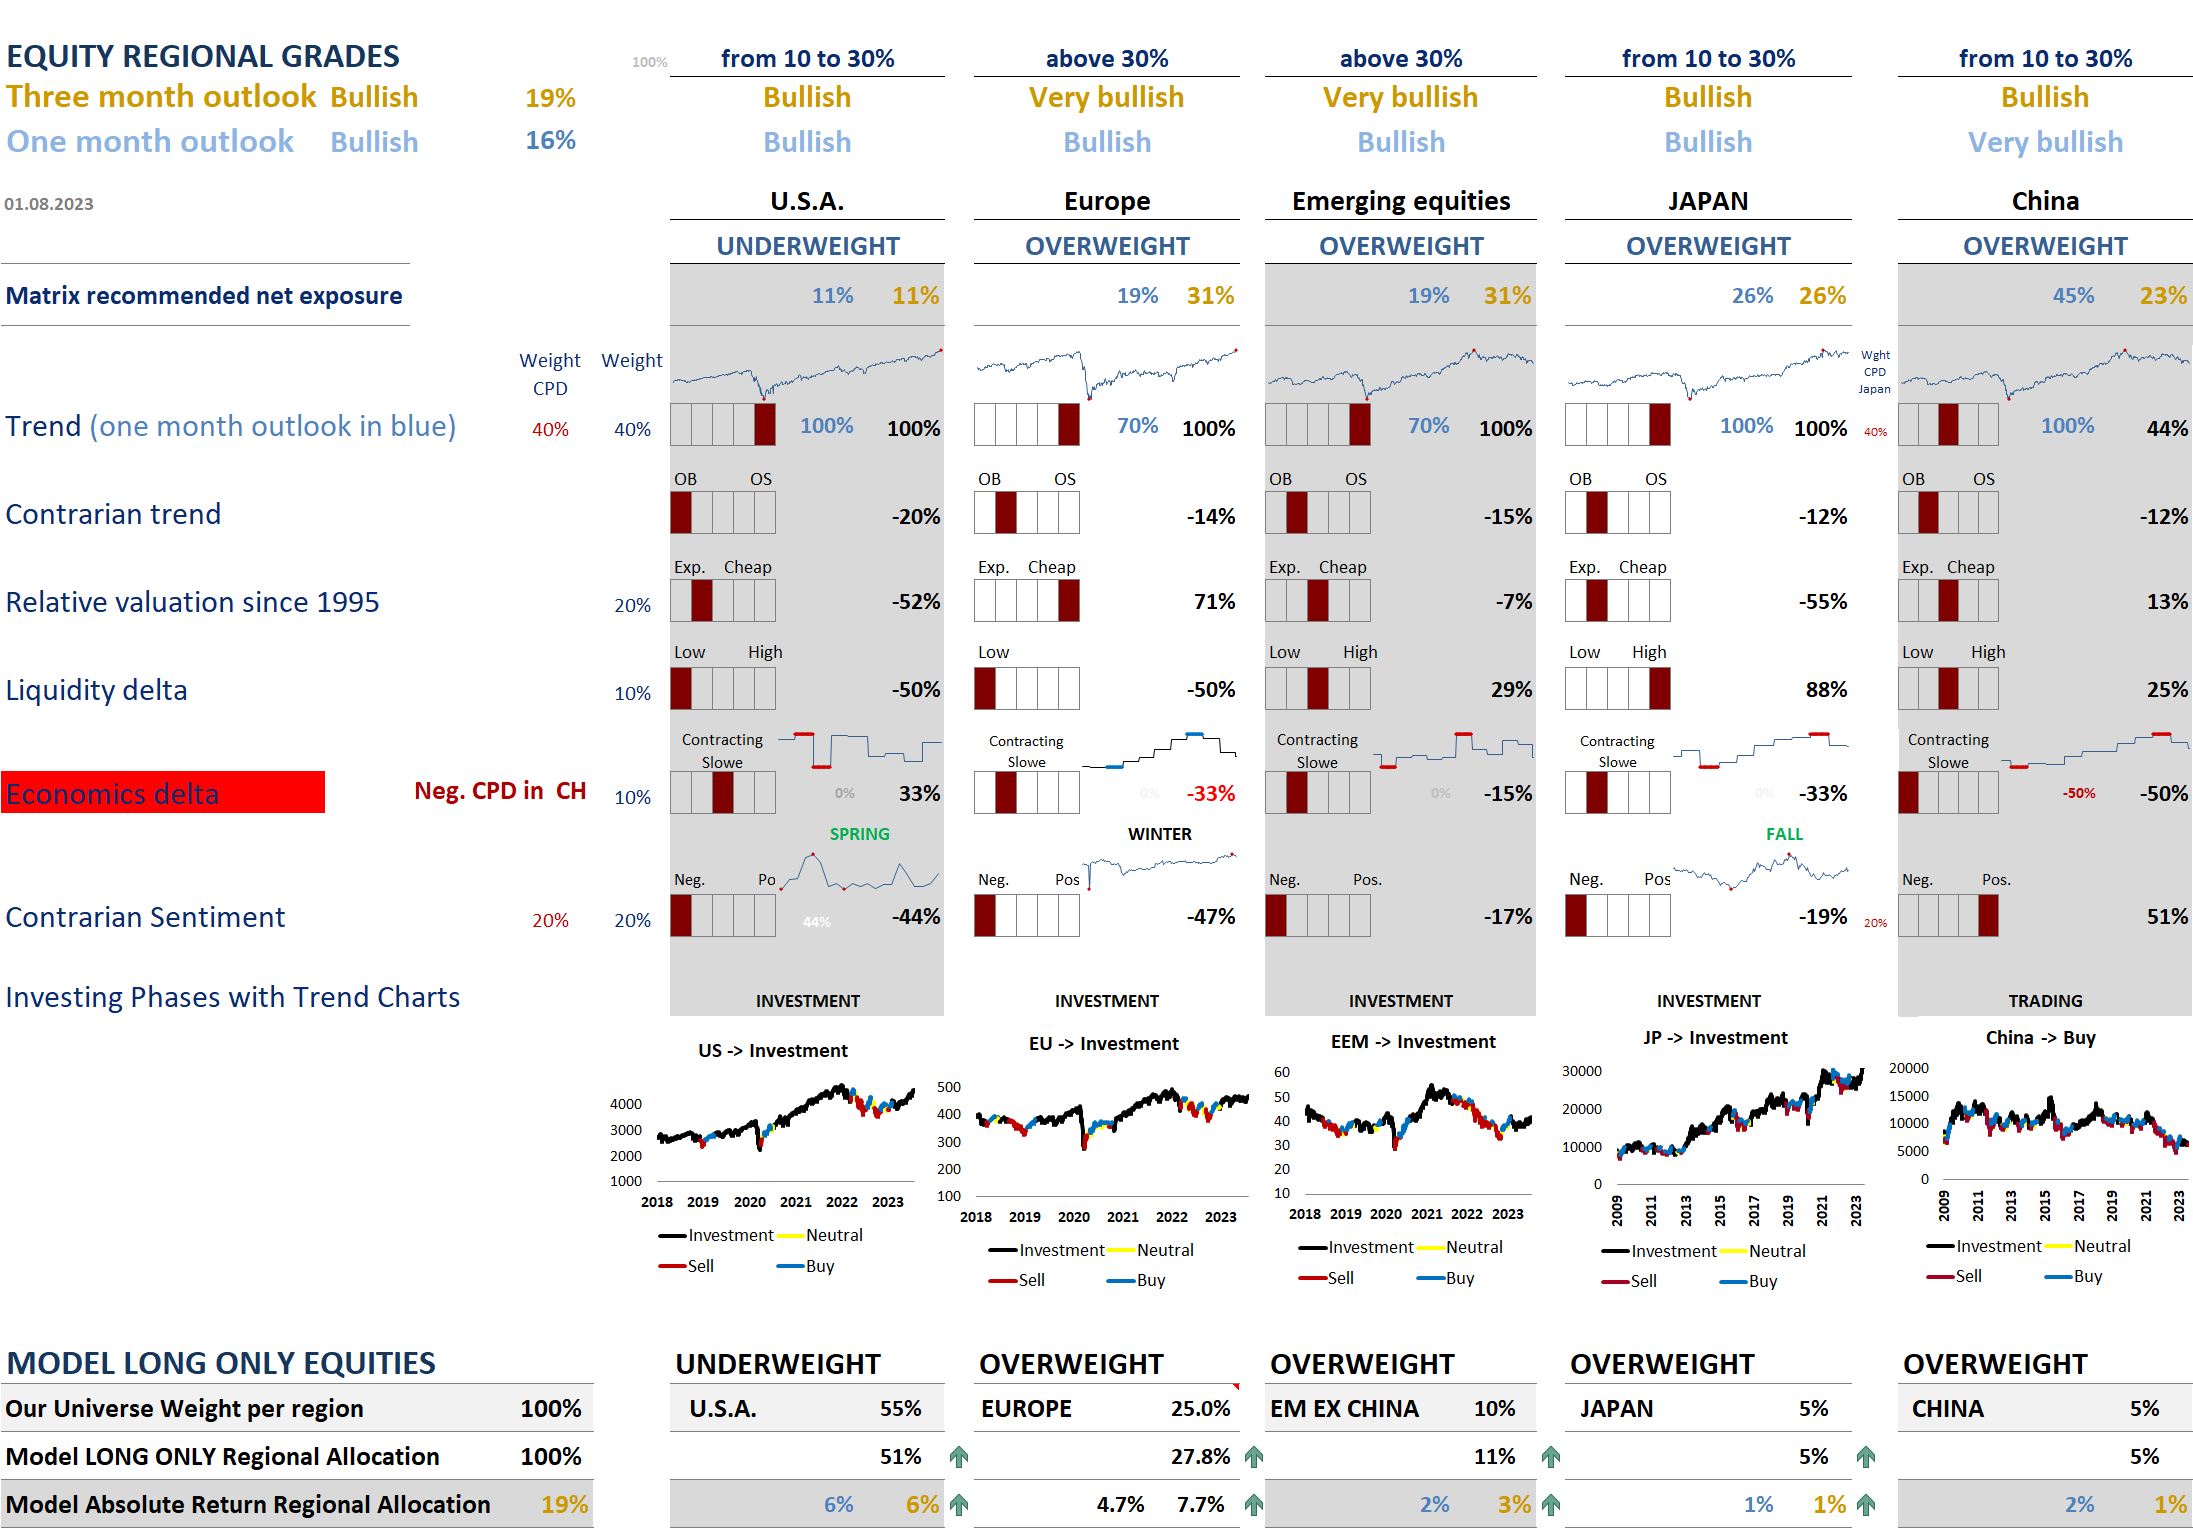
The Regional Matrix is bullish, with a +16 to 19% recommended net exposure. This still means buying the dip as long as 200 days and 50 days moving averages are not broken. The European and Chinese Economics grade have fallen hard, but it has been rebounding in the USA. Trend grades stay strong in US, EM and Japan. Bearish trend in Europe and China have switched to a bullish status. Sentiment grades are giving very negative readings, in the USA and Europe. Liquidity grades are less bearish in the USA at -50% and Europe at -50%, but still OK in the other regions of the world; Valuation is very negative in US at -52%, explaining its UW status, while Europe, China and EM are cheap. Trend models are denominated « Investment » for all, except in China with a Trading Buy ! From a Sentiment point of view, US is a contrarian short with Europe, while China is a perpetual contrarian bull.
FIRST PILLAR OF MATRIX: TREND
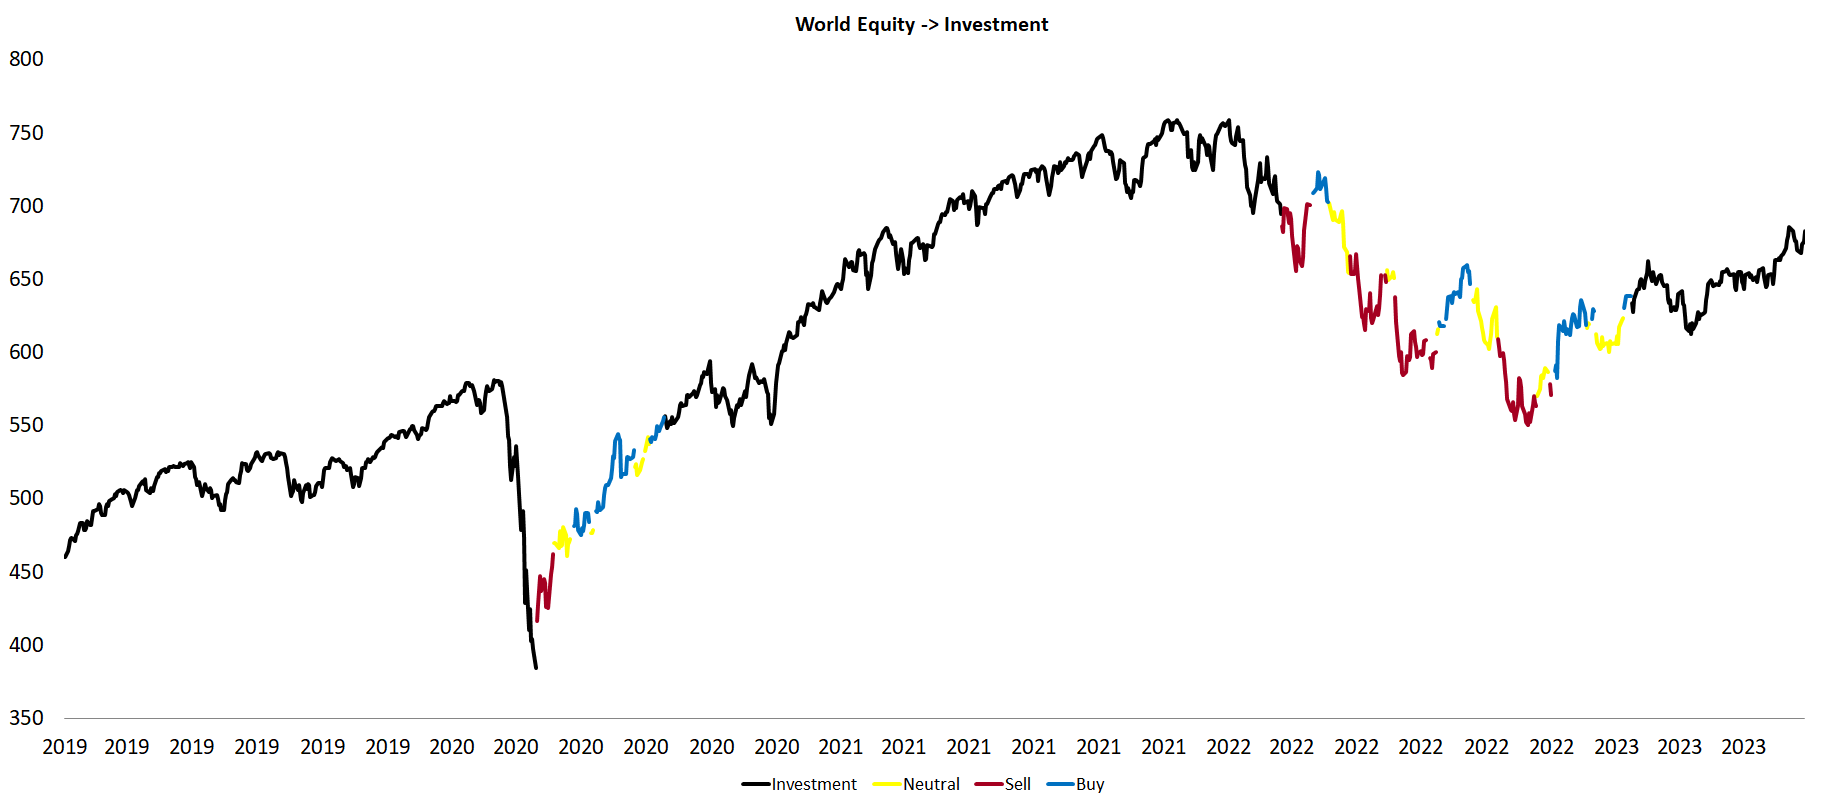
The Trend model is in an Investment phase for global equities:
FIRST PILLAR OF MATRIX: VALUATION

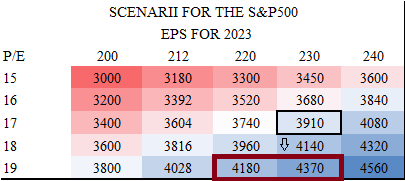
Historically the S&P 500 PE has moved very closely with real yields, and based on data since 1999, the current level of 10Y real yields at 1.63% suggests the S&P 500’s PE should be around 16.5x versus 20x. The table below shows the sensitivity of the S&P500 versus P/E and expected earnings for 2023. It shows the S&P500 is much too rosy now as PE have risen too much. Based on real rates and 2023 estimated EPS at 223.32, it should be between 3910 and 4000, or a -13% downside.
The S&P 500 forward EPS edged down to a record 223.32 from 230 high. The earnings down-cycle seems to be only just getting started and could last into 2024. But let’s see what history tells us: The market tends to be ahead of the earnings cycle, often by several quarters. In an early-cycle bull market, we tend to see valuations expand while earnings are still contracting.
To highlight past cycles, the three charts below show scatter plots of the 36-month Z-score of real earnings against the Z-score of the 5-year CAPE ratio. One chart shows all the cycles together, the other two break out each relevant cycle individually.
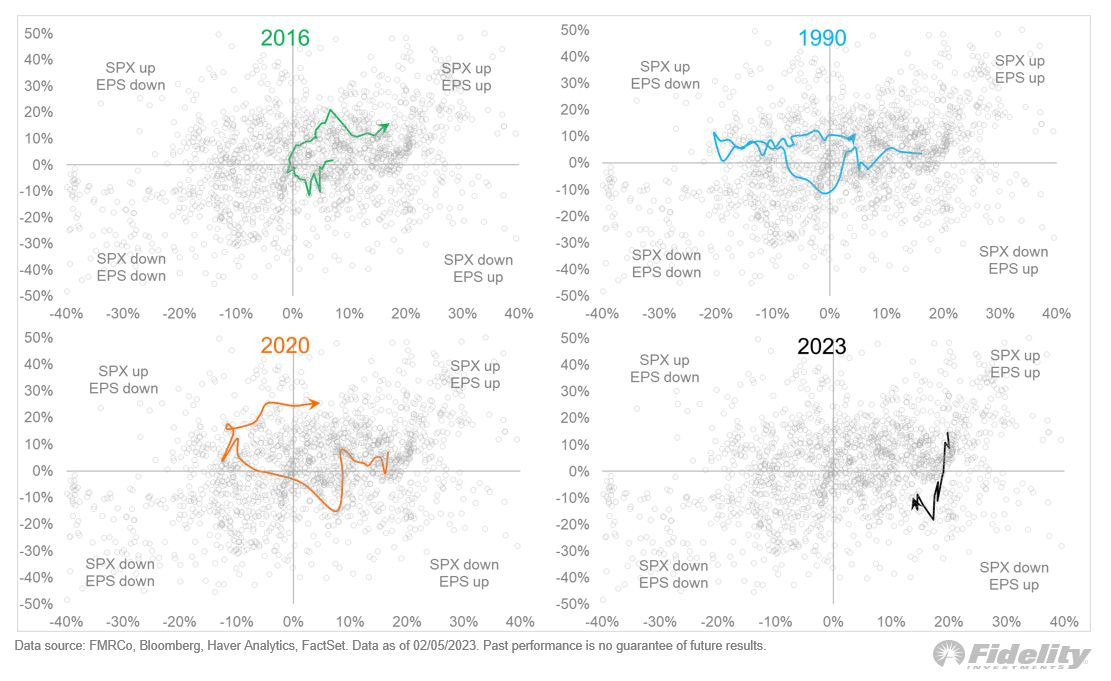
Note how all cycles start in the upper right quadrant (price and earnings are up) and return to that same quadrant during the next bull market cycle. What they do in between is what’s interesting: The 1974 bear market, like 2022, saw market declines as earnings grew. The 1974 bear was bigger than 2022 (48% vs 28%), and the P/E slide was worse (from 20x to 7x, vs from 30x to 15x), but the valuation side was the mirror image of earnings. The Great Recession of 2007-09 was a different beast. It produced a concurrent contraction in both earnings and valuation, a double-whammy that took the market down 57%. Price started to recover two quarters before earnings bottomed. The 2000-02 dot-com bust produced a mild recession but a big valuation derating that took the 5-year CAPE from 30x to 17x (much like the current cycle). Price bottomed after earnings, which is unusual and probably had something to do with the crisis of confidence around the quality of earnings at the time. Remember Enron’s made-up earnings?
The 2016 soft landing began when the Fed attempted (and at first failed) to normalize policy, amid a slowdown of the Chinese economy, a soaring dollar, and tightening financial conditions. The so-called Shanghai agreement eased the pressure, spurring a rally while avoiding a meaningful earnings recession. Given the shape of today’s forward curve (which implies a big Fed pivot), a parallel between today and 2016 is credible.
The 1990 banking recession/S&L crisis produced a mild economic decline, and the S&P 500 only fell 20%. There was a significant left tail for earnings, but it did not produce a big drawdown, and that drawdown was over before the recession even started. The COVID crash is not an apt analog, since it was such a bolt from the blue and not caused by a Fed cycle, but again you can see the orange line hooking up while still in the contraction quadrant. That’s the signal.
Current cycle: Remember, I am showing 36-month Z-scores, which is why earnings are still way on the right. The point is, the black line is hooking up (the rally since October) while we are nowhere near a left tail for earnings. For the lows to be in, this cycle will have to become a repeat of 2016, where the Fed pivots just in time before earnings produce a left tail.
- Global equities back above the 10Y average, Europe still some way below. Global equities now trade ~2% above the 10Y average PE, and while Europe is up 30% from the lows, moving from 10.5x PE last year to ~13x, the STOXX 600 still trades 9% below the 10Y average. Europe trades at a ~15% PE discount to global equities, ~10%pt below the 10Y average.
- The Equity Risk Premium is down to 13Y+ lows. Given the sharp rise in yields MTD, Europe’s ERP is down to a 13Y low, while the US ERP is down to the lowest level since 2007. The ERP on the S&P 500 is also within a few basis points of the lowest level in 15Y. EU equites are at 30M high vs the US, yet the relative risk premium of European vs US equities remains ~120bp above the average since 2006.

European valuations are rebounding from very cheap levels. We added in the below chart the relative valuation of Europe versus the S&P500, the S&P500 value and the MSCI World excluding US stocks. Conclusion is that while Europe stays too cheap versus the US, it is also too cheap versus the S&P500 value:

Asian valuations are rebounding from very cheap levels.

SECOND PILLAR OF MATRIX: LIQUIDITY

US money supply is falling to a -3.5% yoy growth, coming from +27% in 2020. This is a massive yoy contraction: global M2 (in USD) contract to dangerous levels as YoY growth is now negative for the first time since March 2015. The Liquidity Drain could be Bad For Stocks in 2H, as monetary liquidity is set to fall sharply over the next 6 months.

In both the US and Europe, hundreds of billions of dollars of bank reserves will be drained as the US Treasury refills its checking account after the debt ceiling is raised (see chart above), and in Europe a large amount of TLTROs rolls off in June, on top of ongoing QT. Equities typically have a strong correlation to monetary liquidity, and this drain could push stocks down 7 to 10% based on historical relationships. But reality differs: $175bn of liquidity has been added as the drawdown from the Reverse Repos far exceeds the number of T-bills being issued to rebuild the TGA. The amount is so large that the Reverse Repo drawdown is offsetting QT. This is very inflationary, and you are seeing it bear out in the commodities. Wheat is breaking out; Lumber is up +35% since May and Gasoline is +20% in that same period. This liquidity drain flowing in reverse is the main reason why stocks and bonds are working. Some of the liquidity is being soaked up by Treasury bill issuance, but most of it has trickled downstream to bonds and to long duration equities.
The FED and the ECB are currently reducing their balance sheets. The chart below shows that Fed assets could fall to 7.2 $Tn in March 2024:

Yield curves are part of our Monetary pilar. And they have a bad message: not only they are inverted but their are recently un-inverting as 2 years yields are falling, as a function reaction to the banking crisis and a higher probability of recession. Indeed, this un-inversion is not necessarily the good thing that you might think it is. The yield curve tends to invert well ahead of any actual economic contraction and then un-invert as the slope of said curve steepens just as recession becomes imminent. Now, that is usually because the Fed recognizes the coming recession and takes short-term interest rates lower. In this case, we do not have that. The Fed, in deed and in word, appears to be attempting to remain in tightening mode in order to prioritize the inflation fight over both economic growth and national financial stability. While we recognize what the bond market is trying to tell us, we also recognize that this Fed is not playing by precedent.

THIRD PILLAR OF MATRIX: ECONOMICS
US:
GDP Growth Picks Up, Inflation Cools
U.S: economic growth unexpectedly picked up to a modest 2.4% annual from Q1’s 2%. Consumer spending decelerated from a robust Q1 pace. The GDP report’s core inflation rate cooled to a two-year low after heating up in Q1.
The Economy Held Up in Q1, There is plenty of evidence that the economy is getting better, rather than worse. The Atlanta Fed’s GDPNow estimate of the current quarter drawn from data released so far puts growth close to 2%, way higher than the slight fall economists predicted at the start of April. Consumer sentiment is up, according to preliminary figures from the University of Michigan, while inflation expectations are down. Even the highly interest rate sensitive home-construction market is showing signs of life: US housing starts unexpectedly surged in May by the most since 2016 and applications to build increased, suggesting residential construction is on track to help fuel economic growth.
Q2 US GDP is beating once again expectations (+2% vs +1.4% expected) helping bring US Economic surprise index back close to a one-year high. The 2 charts below show softening soft economic data (PMI on manufacturing and services).

In the 19 past episodes where hard and soft data diverged, there was often a factor affecting sentiment one way or the other that with hindsight was distorting the survey responses.Indeed, in those instances in which the surveys signalled growth weakness that never arrived were clustered in periods with depressed sentiment, elevated uncertainty, and downside risks. This argues for placing less weight than usual on business surveys currently, given the continuing “imminent recession” narrative and the concerns in May surrounding the debt limit.

First derivative Citigroup surprise indexes are falling from a very high level in Europe and China, triggering bearish eco cpd. To the contrary, USA is strongly rebounding, thanks to stronger than expected hard data (GDP, housing sales).

In China, there is a weaker momentum, with property sales and a slew of economic data showing notable sequential declines. Year-on-year new home sales growth declined further over the past week. Indeed, China’s manufacturing PMI remained below 50 for the third month. This was a third consecutive month of contraction for the Chinese manufacturing sector after three months of expansion, and suggests that the manufacturer to the world is seeing an uneven recovery as it comes out of the long winter that was its “Zero-Covid” policy. For Asia ex China, PMIs are still at healthy levels, supported by domestic demand..
What our Sector Matrix(es) tell us ?
Find our various charts on sectors in US and Europe here…
In Europe, OW sectors are Tech/ Industrials and discretionary. UW are Saples (NEW), Communication and Real estate.
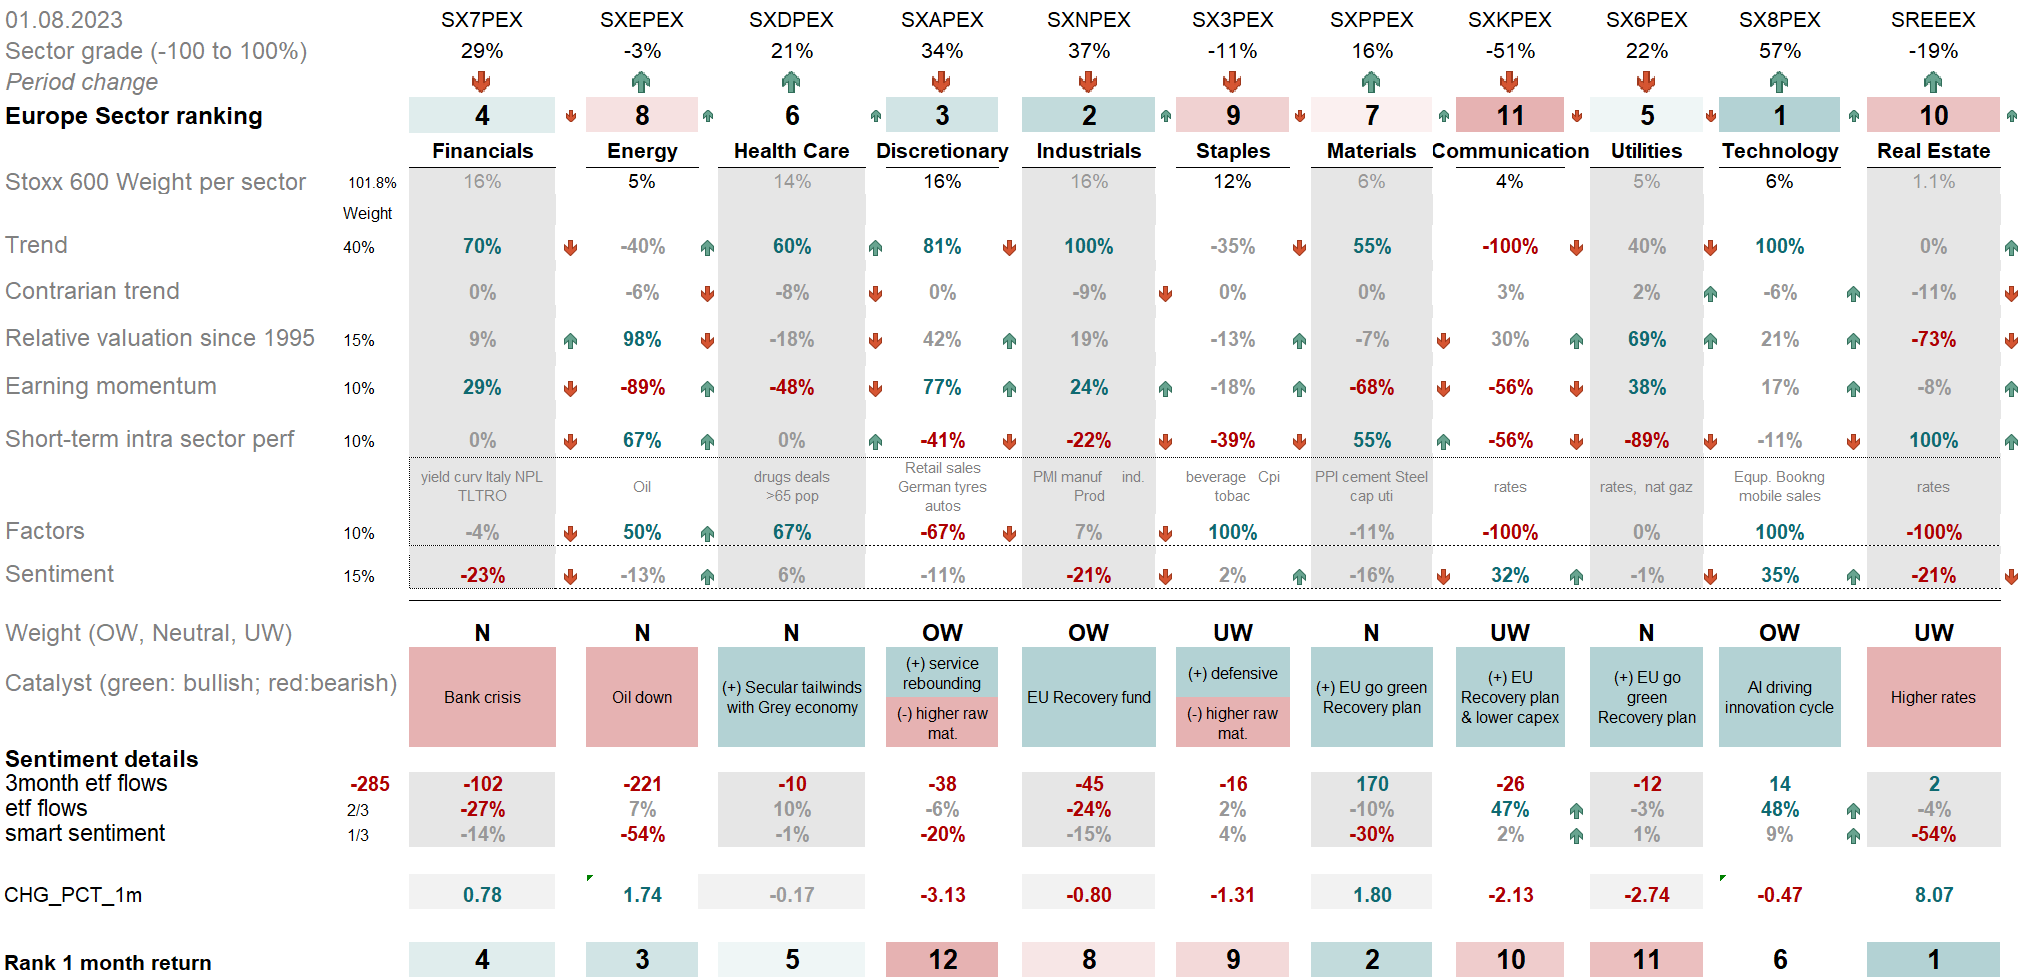
3 months Flows are going in Materials, and exiting Energy and Financials. Smart money is selling energy.
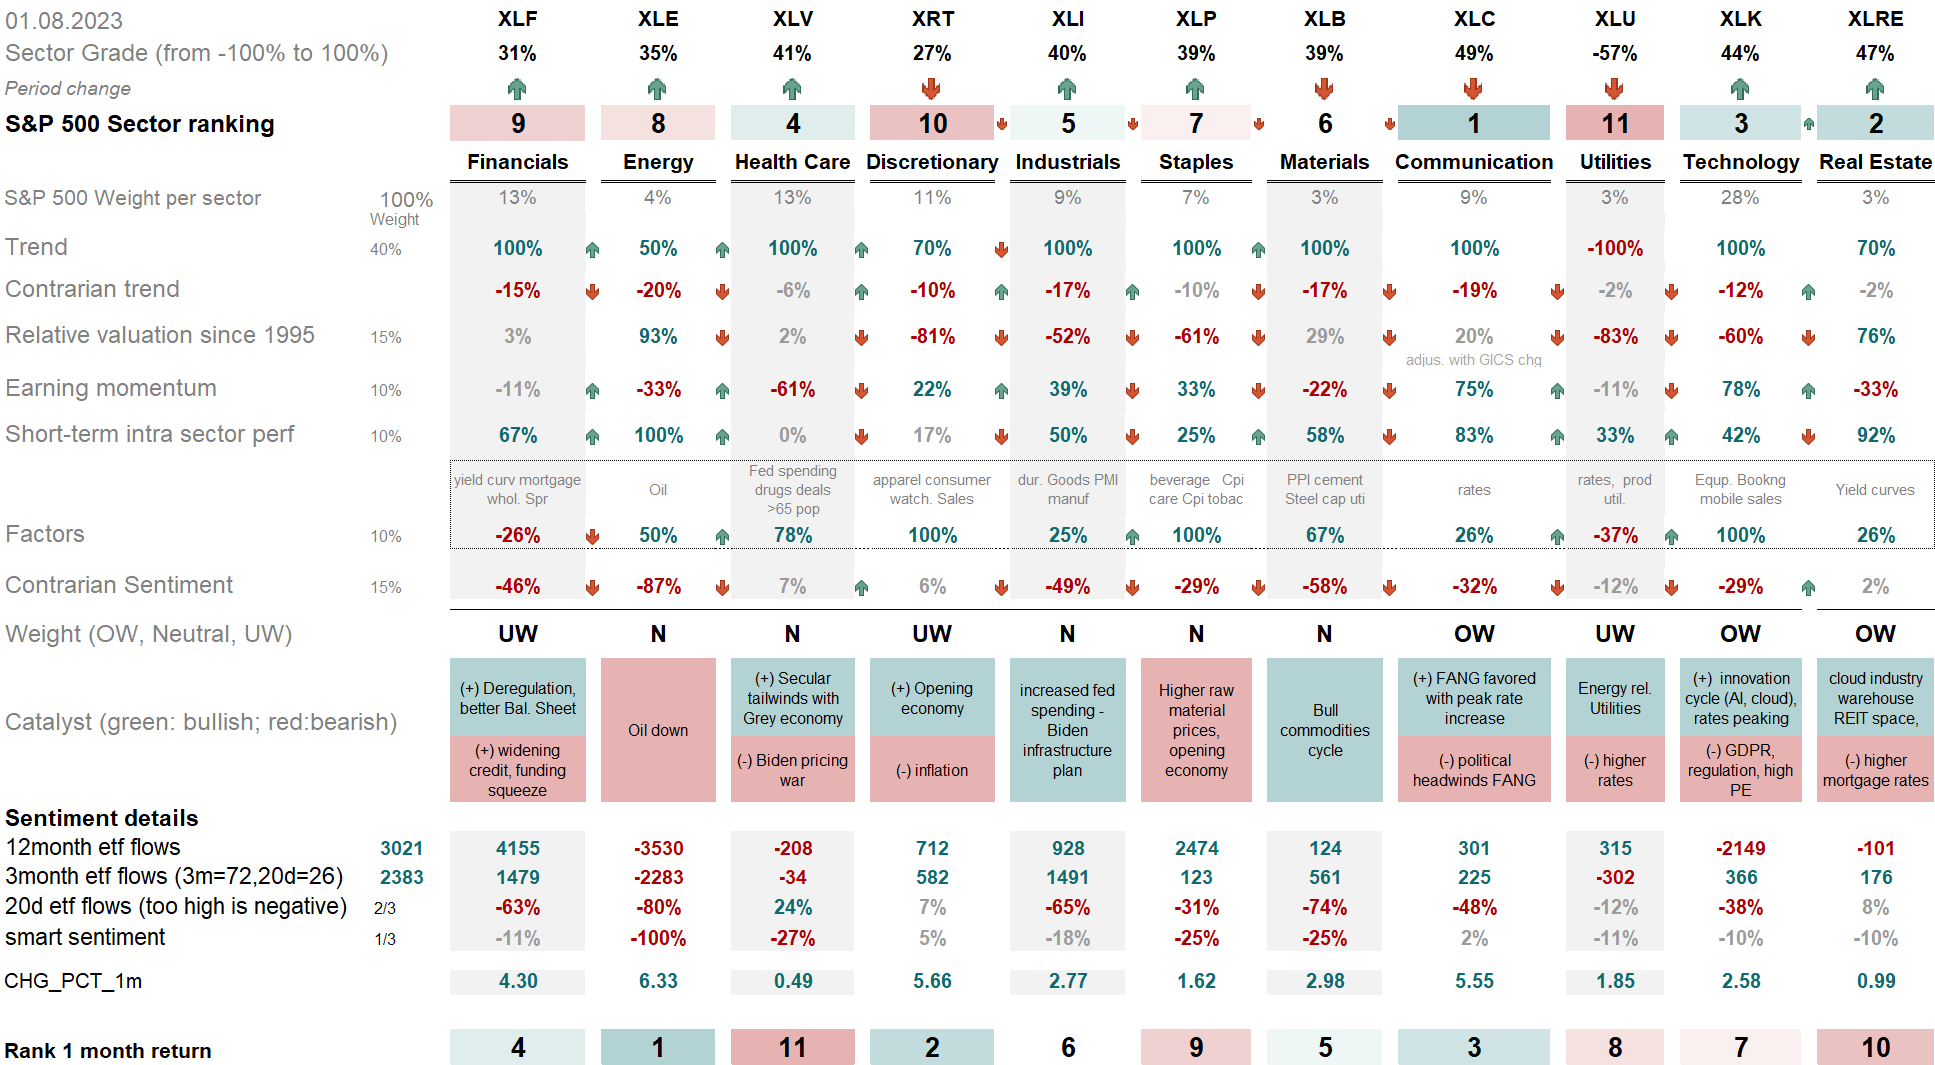
In US, on the below table – OW sectors are Real-Estate (NEW) and TMT ( tech and Communications). Utilities, Discretionary (NEW) and Financials are UW. When looking at Contrarian Sentiment, Energy is maximum sold. In terms of earnings momentum, there’s been a deterioration within health-care & energy; on the other hand,TMT, discretionary, industrials have the strongest earnings momentum.
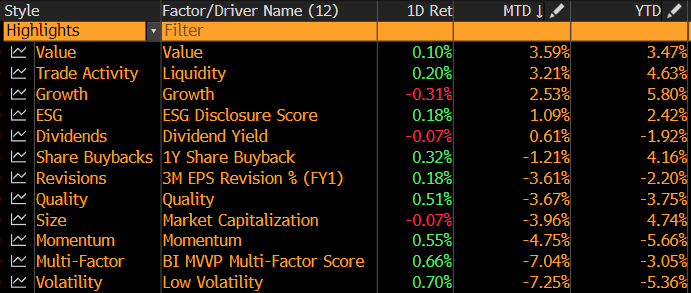
Which factors worked in July – mean reversion in Momentum
The right-hand tables show the returns in USA and Europe based on different factors.
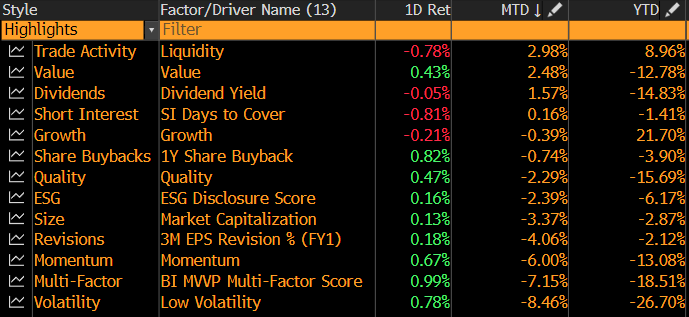
Factor performance in July: Liquidity and Value did well again after June, while Low volatility, Momentum and Quality were negative. Indeed, Value had reached an extreme underperformance in 2023. In the USA, Value ended positive at +2.98% after +2.82% in June. Low Vol (-8.46%) underperformed significantly, while Quality ended -2.29%.
European Value was a clear outsider in July with a +3.59% return. Growth did well at +2.53%, but Size and earnings revisions were down :
The chart below shows that the S&P500 Value’s relative price has now retraced towards its relative earnings trend, and is starting to rebound.
In 2023, quality has outperformed small caps, after the banking crisis,

AND THE RATIO HAS REACHED AN EXTREME ZONE…at the end of June, as we mentioned above, a tentative reversal is under way in line with the ratio equally weighted S&P500/ S&P500 rising. To be followed…

The small-cap Russell 2000 is the big loser since September 2021. Making things worse, in terms of relative trend versus the S&P500, it broke down its support. At the start of May, we observe a tentative dead cat bounce for small caps, in line with a better breadth for the US indexes. Then since June 06, the Russell is outperforming Nasdaq along with a sharp move higher in US rates:

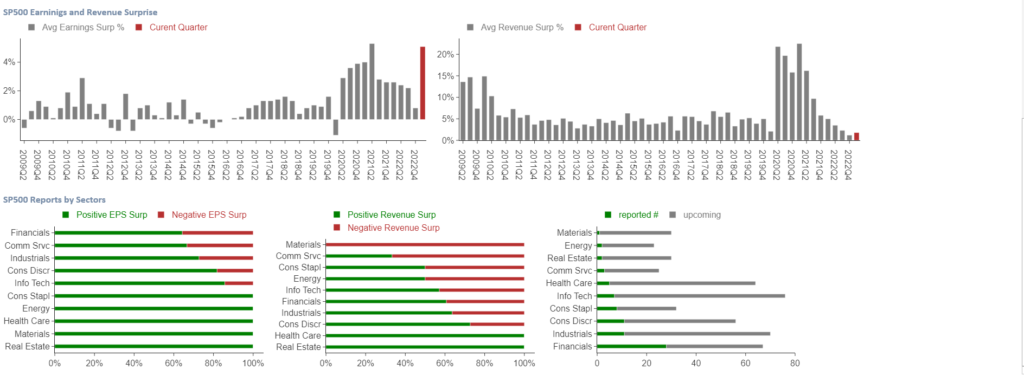
2Q23 earnings:

EUROPE –
week 1: (10th July), 1.4% of the STOXX 600 market cap will be releasing numbers: Ericsson (14th July) is bad.
This week (24th July), 47% of the STOXX 600 market cap will be releasing numbers.
- It’s the largest week of French (89% of CAC), Spanish (79% of IBEX35), SWISS (46% of SMI SWISS) and UK (48% of UKX) companies reporting, and the largest week for all sectors aside from IT.
- Conviction Into Earnings: MS Analysts have conviction that Koninklijke Philips (24th July), Grifols (27th July), Indivior (27th July) and Saint-Gobain (27th July) will “beat” consensus expectations, and Cellnex (27th July), and Capgemini (28th July) will “miss”. They believe these are not appropriately priced into the shares.
- Names that could positively surprise this week: Koninklijke Philips (24th July), LVMH (25th July), Davide Campari (26th July), Endesa (26th July), Orange (26th July), ENEL (27th July), Grifols (27th July), Iberdrola (27th July), Indivior (27th July), Nestle (27thJuly), Prysmian (27th July), Saint-Gobain (27th July), Scor (27th July), Rexel (28th July).
- Names that could negatively surprise this week: SGS (24th July), EDP Renovaveis (26th July), Eurofins (26th July), Just Eat (26thJuly), Acciona (27th July), Anglo American (27th July), Cellnex (27th July), DiaSorin (27th July), Aperam (28th July), Capgemini(28th July), Intertek (28th July), OMV (28th July), Signify (28th July).
- Some of the largest cap companies reporting earnings this week include: LVMH (25th July), L’Oreal (27th July), Nestle (27th July), Roche (27th July), Hermes (28th July).
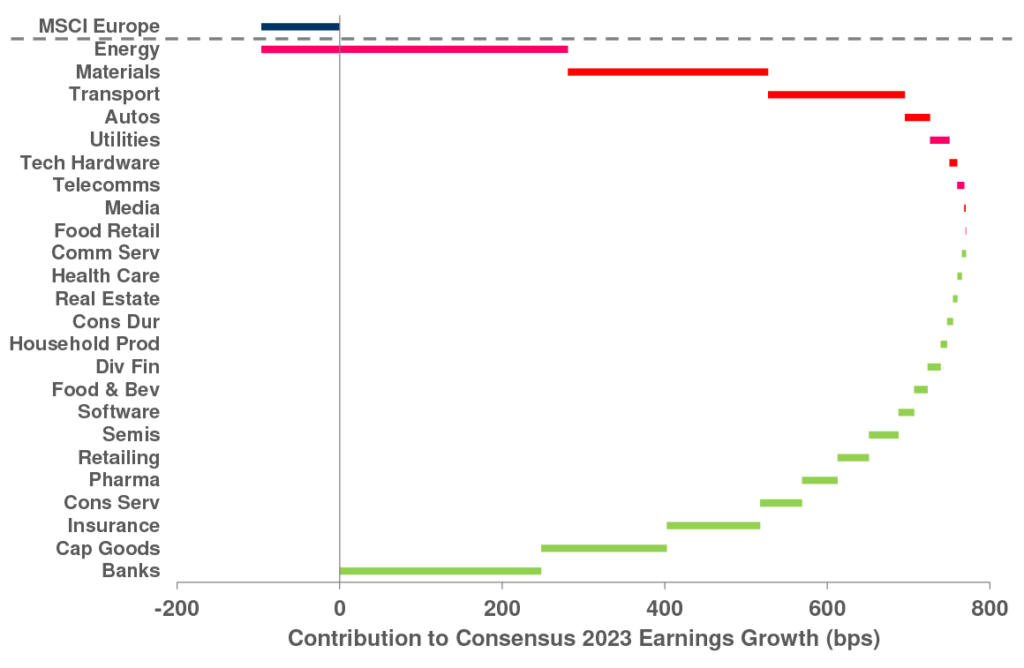
From a sector contribution perspective, it is also worth noting that most of Europe’s EPS outperformance this year is down to the Banks sector:
USA – Expectations for 2Q numbers were for -4.6% y/y earnings growth at the index level, up from -5.6% realised last quarter. Consensus estimates have bounced between $220 and $223.5 for full year 2023 since the beginning of last season. 4
Week 1 (from Friday 14th) with Banks: JPMorgan Chase revenue soared thanks to interest rates and increases guidance,
Week 2: Healthcare, Consumer and Fins the week after, and then a huge week of Tech over the last week of July when 48% of the index will report in one week.
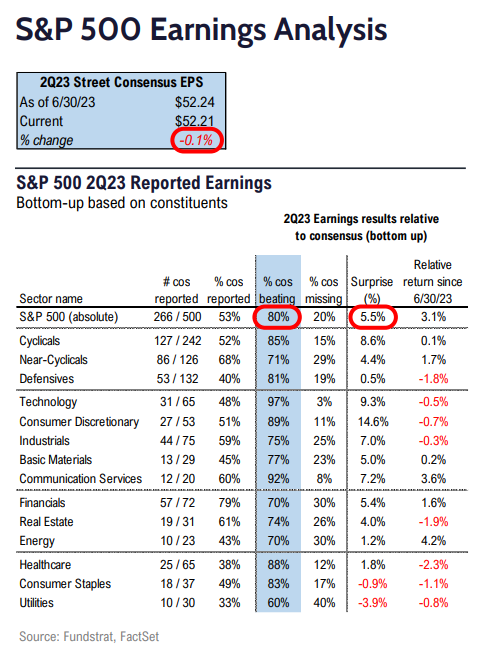
Week 3: Scorecard: of the 266 companies that have reported so far (53% of the S&P 500 and right hand table): Overall, 80% are beating estimates, and those that “beat” are beating by a median of 6%. Of the 20% missing, those are missing by a median of -6%. On the top line, overall results are beating estimates by a median of 3% and missing by a median of -3%, and 64% of those reporting are beating estimates.
1Q23 earnings:
ANALYSIS OF EARNINGS:
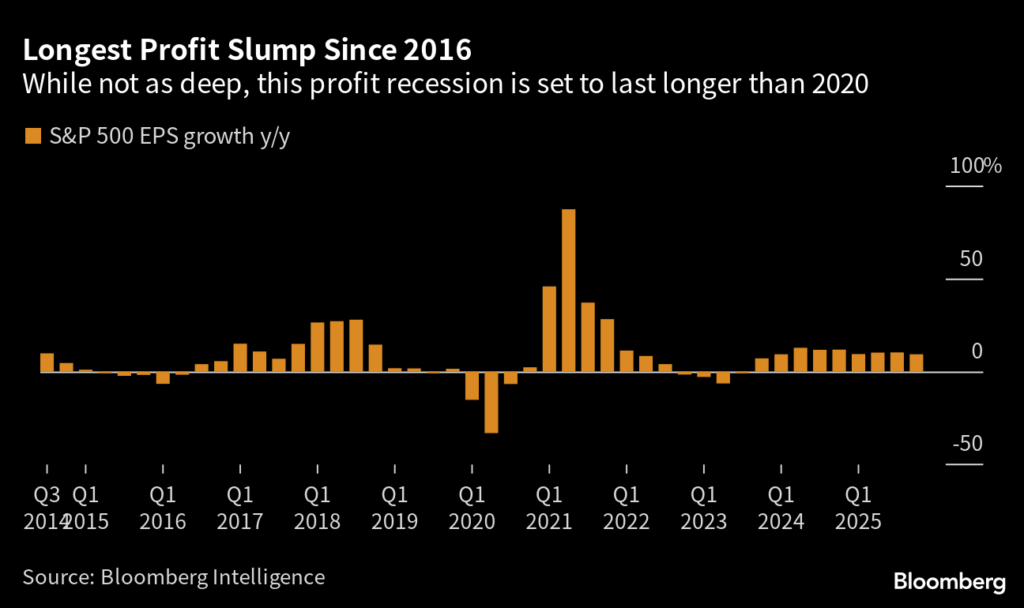
More than 78% of companies and market cap in the S&P 500 have reported 1Q23 earnings thusfar and the numbers continue to improve. As alluded to, the beat rate of this group on EPS is now at 79%, while the Sales Beat ratio is very healthy at 73% (this compares to a pre-pandemic trend of high 60s / low 70s for the EPS beat rate). Real growth figures are also coming in better than expected with the reported numbers +0.7% YoY. Still, with expectations for earnings to get worse throughout the quarter, the profits of S&P 500 companies are estimated to have dropped 3.7% on average, compared to a year ago. While data compiled by Bloomberg Intelligence shows that 78% of firms surpassed forecasts, that’s less impressive than it sounds, given analysts had slashed their expectations before the season kicked off. More crucially, it was the second straight quarter of earnings declines for corporate America. Bearish earnings forecasts now center around the April to June period, for which a 7.3% profit slump is penciled in, according to data compiled by Bloomberg Intelligence. And the pinch from higher interest rates and wilting consumer demand will extend into the third quarter of 2023, analysts reckon, backtracking on earlier predictions that earnings recovery would kick in around then.
That implies a longer profit recession than during the pandemic. An earnings drop of more than three quarters was last seen in 2015 to 2016, when the Federal Reserve started its last interest rate hiking cycle. Unsurprising then that the S&P 500 index has posted no gains since major Wall Street lenders kicked off the earnings season in mid-April.
Europe continues to enjoy better EPS trends than peers with EMU the only region to see a YTD upgrade to consensus FY23 EPS. numbers have also been strong but still met with a lukewarm market reaction, particularly for cyclicals. 1Q23 has seen a 48% sales beat, which is an improvement from last quarter but still below the rest of 2022. A net 40% of companies have beaten consensus EPS expectations so far, which is above the 18% average from the last 3 quarters. Large-cap stocks continue to show the most strength while Consumer Discretionary, Industrials and IT are the best performing sectors. Materials and Communication Services are among the weakest sectors, which is especially notable given share prices are underperforming more on a miss than outperforming on a beat.
Past earnings – will be moved to archive here …
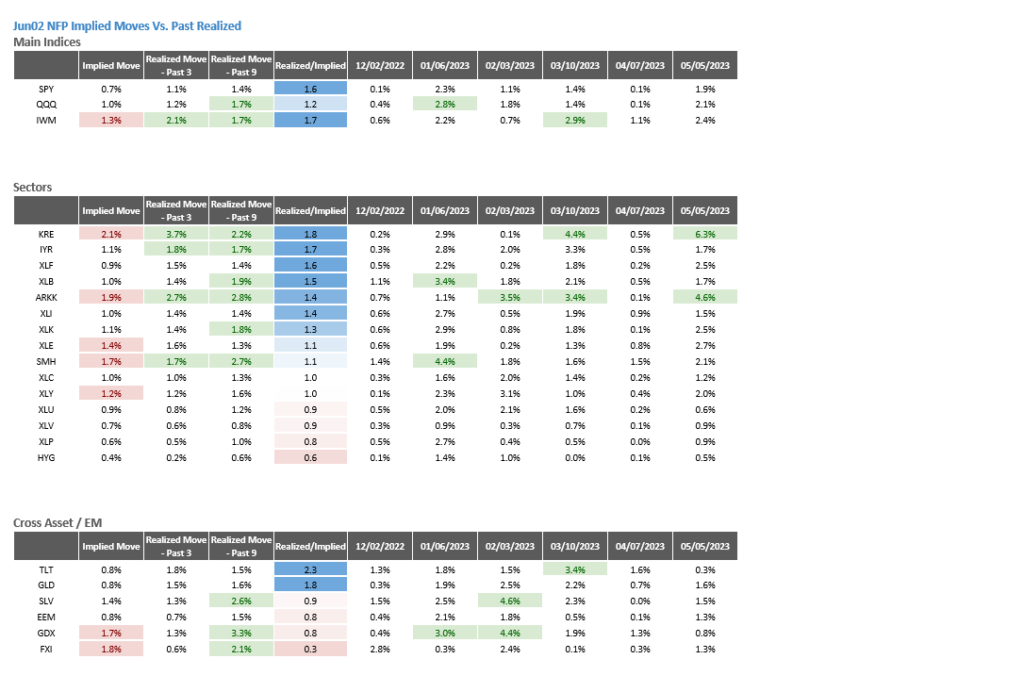
VOLATILTIES
Go long gamma on KRE, XLF, ARKK, Nasdaq, but sell gamma on XLP, XLV, FXI, GDX, EEM and XLY
FRACTALS
AI – There’s no bubble to prick now. The AI boom is in its first year, led by the highly profitable “Magnificent Seven,” including Microsoft, Nvidia, Google and Meta.
AI FRACTAL – AI was mentioned a total of 168 times on the latest round of Big Tech earnings calls, a sign of how much attention artificial intelli- gence technology is attracting. Leading the pack of AI mentions was Alphabet (GOOGL) with 64, Business Insider calculated. Micro- soft (MSFT) executives dropped the term 50 times; Meta (META) 47 times, and Amazon (AMZN) seven times.
We refer to Clayton Christensen’s framework outlined in The Innovator’s Dilemma when thinking about how disruption may play out from the proliferation of generative AI. Based on this framework, the general questions we ask when any new technology emerges are:
- Is a new product or service created using the new technology a substitute for consumers of an existing product or service?
- How big is the gap between the utility, or “performance”, of new products or services vs incumbents, and how fast is the new technology improving?
- What is the basis of competition of the new product or service, i.e. what are the unique or novel features that drive its consumer value proposition?
- How is management responding to disruption? Does management’s response involve harnessing the new technology to match the basis of competition of the new product or service and, if so, is it doing this via a business unit managed separately from the legacy business?
- In this context, we highlight three key conclusions for the potential impact on Media companies:
- Generative AI is potentially disruptive in some areas of European Media where it can power a substitute product or service using data on the open Internet to generate novel text, images, video, music and code;
- The rapid pace of innovation in generative AI will likely create significant uncertainty on the range of possible outcomes for investors. This may mean that the equity market “assumes the worst” until proven otherwise, but may also lead to periods of euphoria when investors focus on the potential considerable opportunities; and
- Investors are likely to focus increasingly on the responses of management teams to the new technology, rewarding those with credible strategies and investment plans, and punishing those without a coherent plan.
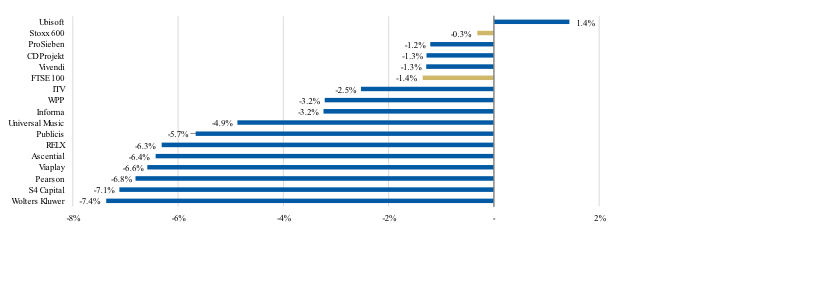
Remember what is novel here: generating new content: When framing the opportunities and risks from generative AI to European Media companies, it is important not to forget to state the obvious – what is new about the technology is the ability of large language models (LLMs) to use text or image prompts to generate new content: text, images, video, music and code. What is not new is aggregating information on the open Internet – which, surprisingly based on our conversations with investors so far, often seems to be overlooked. Pearson has been at the centre of investor debate about potential disruption from generative AI since Chegg’s warning that ChatGPT is having a material impact on its business. We believe: (i) LLMs trained on the open Internet are not substitute products for Pearson’s content, which is structured for learning, embedded in academic and professional institutions and protected by copyright; (ii) when combined with generative AI models, which we think will become ubiquitous, the value of Pearson’s data and content will likely go up; and (iii) the value of accredited learning is unlikely to be materially disrupted by LLMs – as consumers are likely to continue to value degrees, professional and other learning certifications as paths to economic and social advancement. The pace of improvement of generative AI models is the most notable risk, in our view, particularly for US college courseware and exam preparation.
DEBT CEILING – investors are increasingly concerned by the possibility of crossing the X-date absent a resolution by Congress. While we don’t think a default is imminent, as markets and lawmakers begin to contend with these realities, we think it’s worth exploring the mechanics of that scenario and the options that become possible:
- 14th Amendment: Unilateral action by the administration to ignore the debt limit would be unprecedented and subject to various legal challenges, but the Biden administration appears to be open to considering such an option, though seemingly as a fallback after many other options have been exhausted over time.
- Congressional resolution: Market and economic volatility has in the past catalyzed bipartisan action, as crossing the X-date meaningfully increases the probability of default on debt and/or other payments to Americans. This disruption and consequential rapid accrual of negative feedback associated with the risk elevation and unprecedented nature of breaching the X-date would, in our view, be enough to spur a quick intervention by lawmakers.
- Payment prioritization: The Treasury would give instructions to the Federal Reserve to make payments on maturing securities, but to withhold payment of other obligations of the federal government
- Default: Treasury securities miss a payment and defaults on securities. It is plausible to assume that matured but unpaid securities would be enabled to circulate in Fedwire, and that the Fed would accept such securities as collateral at the discount window and now likely at the Standing Repo Facility.
Two key market takeaways if we pass the X-date without resolution:
- Sovereign credit: The risks of ratings moving to negative ratings increase materially, even if no actual downgrades may happen. CDS would move to price in a much higher probability of default, moving past the 8% priced at the peak in 2011, even if an actual missed payment is required for the CDS to trigger.
- T-bills: Yields will be path dependent on the prioritization plans. If maturities are rolled forward, we expect the kinks in the current “red zone” to get pushed out, while resolution would trigger a normalization in pricing, and no prioritization (and possible default) likely would see the sell-off continue.
Of course, policymakers could avoid this outcome by either passing a compromise agreement that reduces spending (although likely below levels requested by House Republicans) or pursuing a short-term suspension, which effectively punts the issue without resolving the underlying debate. As always, we’ll stay tuned in the coming weeks as we learn more from DC.